Université de Sherbrooke
PROPERTIES OF MASS-SPIKING ACTIVITY IN HUMANS MEASURED BY NON-INVASIVE EEG
PROPRIÉTÉS DE L'ACTIVITÉ DE DÉCHARGE NEURONALE DE MASSE CHEZ LES HUMAINS MESURÉE PAR EEG NON INVASIVE
Par Zahra Owji
Département de médecine nucléaire et radiobiologie
Mémoire présenté à la Faculté de médecine et des sciences de la santé en vue de l’obtention du grade de maître ès sciences (M. Sc.)
en Sciences des radiations et imagerie biomédicale
Sherbrooke, Québec, Canada Septembre, 2014
Membres du jury d’évaluation
Kevin Whittingstall, Département de Radiologie Diagnostique
Yves Bérubé-Lauzière, Département de Génie Électrique et de Génie Informatique Benoit Paquette, Département de médecine nucléaire et de radiobiologie
Pierre-Michel Bernier, Faculté d’Éducation Physique et Sportive Philippe Goffaux, École de Réadaptation
RÉSUMÉ
Propriétés de l'activité de décharge neuronale de masse chez les humains mesurée par EEG non invasive
Par Zahra Owji
Programmes de Sciences des radiations et imagerie biomédical
Mémoire présenté à la Faculté de médecine et des sciences de la santé en vue de l’obtention du diplôme de maitre ès sciences (M.Sc.) en Sciences des radiations et imagerie biomédicale, Faculté de médecine et des sciences de la santé, Université de Sherbrooke,
Sherbrooke, Québec, Canada, J1H 5N4
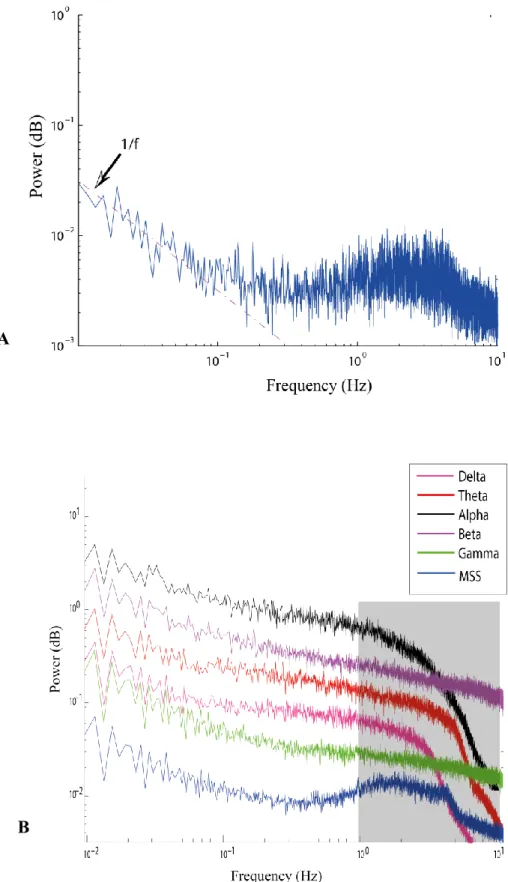
L'électroencéphalographie (EEG) est une modalité de neuro-imagerie non invasive qui a été introduite il y a plus de 80 ans. L’EEG de surface ne mesure pas directement l’activité neuronale et il est généralement supposé qu’elle ne donne pas d’indications sur la décharge neuronale sous-jacente. Cependant des études récentes ont montré à l’aide de mesures invasives que le couplage entre deux bandes de fréquences EEG, soit les bandes Gamma (25-45 Hz) et Delta (2-4 Hz), est un bon indicateur de l’activité neuronale de masse sous-jacente chez les singes. Plus précisément, lorsque le signal Delta est dans un creux (phase de π) et que la puissance dans le signal Gamma est élevée, la probabilité de décharge de masse des neurones est grande. Cette propriété est ici étudiée dans les signaux EEG d’humains sains en état de repos. En se basant sur l'interaction entre la phase du signal Delta et la puissance du signal Gamma, nous avons dérivé un modèle de l’activité neuronale de masse sous-jacente (modeled spike signal - MSS) obtenu à partir du signal l'EEG enregistrée. On trouve que la densité spectrale de puissance (power spectal density - PSD) du MSS est similaire à celle observée dans les études animales. Plus spécifiquement, entre 1-10 Hz la PSD s’écarte d’une tendance en 1/𝑓 et présente un pic de faible amplitude à environ 2-3Hz. En outre, une corrélation inter-hémisphérique a été observée entre les MSS de différentes paires d'électrodes positionnées sur les hémisphères opposés. Nos résultats ouvrent la possibilité d'étudier l’activité neuronale sous-jacente par EEG non-invasive.
Mots clés : EEG, Phase de Delta, Puissance de Gamma, l'activité des masses-dopage, signal de pic modélisé
iii
SUMMARY
Properties of mass-spiking activity in humans measured by non-invasive EEG By
Zahra Owji
Graduate program of Radiation sciences and biomedical imaging
Thesis presented at the Faculty of medicine and health sciences to obtain the Master of Science diploma (M.Sc.) in Radiation sciences and biomedical imaging, Faculty of medicine and health sciences, Université de Sherbrooke, Sherbrooke, Québec, Canada,
J1H 5N4
Electroencephalography (EEG) is a non-invasive neuroimaging modality that was first introduced over 80 years ago. Surface EEG does not directly measure neuronal activity, and it is often assumed that it cannot provide indications on the underlying neuronal firing. However, recent studies based on invasive measurements in monkeys have shown that the coupling between two EEG frequency bands, namely the Gamma (25-45 Hz) and Delta (2-4 Hz) bands, is a good predictor of underlying mass-spiking activity. Specifically, when the Delta signal is in its trough and Gamma power is high, the probability of mass- firing of neurons is large. Here, we investigate this property in healthy human EEG acquired during resting-state. Using the interaction between Delta phase and Gamma power, we derived a modeled spike signal (MSS) from the recorded EEG. We found the power spectrum density (PSD) pattern of the MSS to be similar to that observed in animal studies. Specifically, between 1-10 Hz that the PSD deviates from a 1/f trend and exhibits a small peak at about 2-3Hz. In addition, an inter-hemispheric correlation was found between the MSS of the different pairs of electrode in opposite hemispheres. Our results open the possibility of studying underlying neuronal output with non-invasive EEG.
iv
Dedication
To my parents,
v
Acknowledgement
I would like to thank my supervisors, Dr. Kevin Whittingstall and Dr. Yves Bérubé-Lauzière who taught me a lot during this project and gave me the tools to be a good researcher. I would also thank the members of our laboratory, the Sherbrooke Neuro-Analysis and Imaging Lab. (SNAIL).
TABLE OF CONTENTS
RÉSUMÉ ... II SUMMARY ... III TABLE OF CONTENTS ... VI LISTE OF FIGURES ... VIII LISTE OF ABREVIATIONS ... IX
CHAPTER 1 INTRODUCTION ... 1
1.THE HUMAN BRAIN ... 3
2.NEURONS ... 7
2.1. Neurons classification ... 9
2.2. Communication between neurons ... 10
2.2.1. Resting potential ... 11
2.2.2. Action potential ... 13
3.ELECTROENCEPHALOGRAPHY (EEG) ... 18
3.1. History ... 18
3.2. EEG System ... 19
3.3. EEG Frequency Bands and Properties ... 21
3.4. The Source of EEG signals ... 21
3.5. States of EEG recording ... 24
4.FIRFILTERS AND HILBERT TRANSFORM ... 25
4.1. Hilbert Transform ... 25 4.2. FIR Filters ... 27 CHAPTER 2 HYPOTHESIS ... 32 CHAPTER 3 ARTICLE ... 33 CHAPTER 4 DISCUSSION ... 49 CHAPTER 5 CONCLUSION ... 52
vii
LIST OF REFERENCES ... 53 APPENDICES ... 59 A. GAUSSIAN FUNCTION ... 59
LISTE OF FIGURES
Figure1.1-The nervous system of human body ... 4
Figure1.2-Different functional areas of the adult brain ... 5
Figure2.1-The main components of a neuron ... 8
Figure2.2-Instruction of a synapse ... 8
Figure2.3-Development and preserving the membrane resting potential ... 13
Figure2.4-Channels states during generation of an action potential ... 15
Figure2.5-Examples of firing patterns in different neurons ... 16
Figure3.1-Electrodes positions ... 20
Figure3.2-Different frequency bands of EEG ... 22
LISTE OF ABREVIATIONS
MRI EEG MEG ECoG PNS CNS CT LFP MUA FIR MSS PSD BLP ICA SNRMagnetic Resonance Imaging Electroencephalography Magnetoencephalography Electrocortiography
Peripheral Nervous System Central Nervous System Computed Tomography Local Field Potential Multi-Unit Activity Finite Impulse Response Modeled Spike Signal Power Spectrum Density Band-limited Power
Independent Component Analysis Signal to Noise Ratio
CHAPTER 1
I
NTRODUCTION
For the past centuries anatomy and physiology of the human body has been studied. However, there are still several questions that remained unanswered. Several of these questions relate to the brain and its important role in controlling the connections between different parts of the body. Therefore, it is of high interest to investigate the structure and functional role of the brain to better understand the body system.
Different modalities have been reported in order to study the brain. Magnetic resonance imaging (MRI), electroencephalography (EEG), electrocorticography (ECoG), magnetoencephalography (MEG), etc. are examples of these modalities. Each method has its own advantages and limitation in studying different features of the brain.
This study focuses on the very basic but important aspect of neuroscience and that is the neuronal communication. In other words, we were interested in studying not the cellular-molecular aspect of this communication, but mostly the properties of the signals that are generated for this reason.
There are different methods of recording neuronal spiking activity (the output signal of a neuron), but most of them are known to be invasive methods such as ECoG. Another modality that records the neuronal activity of the brain is surface EEG. For the reasons that are provided in the following sections as well as in the introduction of the article chapter, it is generally believed that surface EEG does not reflect the spiking activity of neurons. However, recent studies have shown that interactions between two frequency bands of
2
surface EEG could be a reliable estimation of underlying mass-spiking activity of neurons in macaque monkeys [22]. We were interested to investigate this property for the very first time in healthy humans and to assess the reliability of surface EEG in estimation of neuronal outputs.
As an introduction to the neurophysiological and mathematical aspects of this project, the subsections of this chapter are defined as follows: the brain and neurons will first be briefly introduced. Secondly, EEG and its properties will be discussed following another section introducing the filtering method used in this study and Hilbert transform. Finally, the concepts of the power law and power spectrum density are briefly introduced.
In the article chapter, the methods and results of this research are introduced and discussed. The final chapters will discuss and conclude the results that are provided in this research, showing a perspective for future investigations on this topic.
3 1. The Human Brain
The nervous system of the body consists of two main parts: the peripheral nervous system (PNS) and the central nervous system (CNS). The PNS is made of spinal and cranial nerves that are branched to all parts of the body. The CNS is composed of two sections: the brain and the spinal cord (figure1.1). The main subdivisions of the brain include the cerebrum, the cerebellum and the brainstem. The cerebrum is composed of two cerebral hemispheres, which are subdivided into other sections. Before going any further on the different parts of the brain, it is important to know about the constituent cells of the nervous system. The principal cells of the nervous system are nerve cells or neurons and glial cells (also known as neuroglia). Neurons are the conducting cells that transmit information via electrical or chemical signals and we will introduce them more precisely in the next section while glial cells have different supporting roles, such as to maintain homeostasis, form myelin, and support and protect the neurons in the brain and other parts of the nervous system [1].
Each of the cerebral hemispheres is divided into different lobes; the number of divisions varies according to different references. However, the major lobes are reported as the frontal lobe, the parietal lobe, the temporal lobe and the occipital lobe (Figure 1.2).
4
Figure1.1-The nervous system of human body. The two divisions of the nervous system are shown : The peripheral nervous system (in blue) and central nervous system (in red) [2]. Copyright: © Mosby (2009). Reproduced with permission from Elsevier.
Some references report five lobes with the fifth lobe called the limbic lobe added [2] while Terminologia Anatomica (1998) divides the cerebral hemispheres into six lobes that in addition to the aforementioned lobes, adds the sixth lobe called the insular cortex [3]. These divisions are mostly according to the principal functions of the different parts of the cerebrum. Here, we introduce the functions of the four major lobes.
5
Figure1.02-Different functional areas of the adult brain. Top: the lateral view, Bottom: the medial view [2]. Copyright: © Mosby (2009). Reproduced with permission from Elsevier.
1. Frontal lobe: This lobe contains motor areas. This lobe, which is divided into smaller sections, is involved in the initiation of the voluntary movements, production of written and spoken language and executive functions which can be described as personality, insight and foresight.
2. Parietal lobe: This lobe contains somatosensory areas. It is involved in processing information related to the sense of touch, the comprehension of language and the complex aspects of spatial orientation and directing attention.
3. Temporal lobe: It contains auditory areas. Comprehension of language, higher-order processing of visual information and complex aspects of learning and memory are some of the major functions that the temporal lobe is involved in [2]. The temporal lobe is engaged in primary auditory perception such as hearing and processing the information as well [4].
6
4. Occipital lobe: It contains visual areas. Occipital lobe is divided into several functional visual areas: The primary visual cortex is involved in the low-level visual processing like local orientation and color properties. The rest of the lobe that is referred to as the visual association cortex is involved in higher-order processing of visual information [2].
As this brief introduction conveys, each part of the cerebral hemispheres holds a specific functional role, and it is clear that in case of any injury or damage to each part, certain neurological and sometimes psychological disorders may occur. However, the reason for all these disorders has not yet been discovered. A major factor is that we do not have enough knowledge about neuronal activities that are going on every second. Therefore, it is of interest to ask some fundamental questions: How do neurons communicate with each other? Is it a regular and predictable pattern? How can we measure the neuronal firing? The following sections will provide information on these fundamental questions.
7 2. Neurons
As mentioned before, neurons are one of the major constitutive cells of the nervous system. Their function is to carry information. To achieve this goal, they use two kinds of signals: electrical signals which are used to convey information from one end of a neuron to the other end, and chemical signals that a neuron uses to transmit information to an adjacent neuron. This duty of the neurons is the reason of their anatomical differences from other cells. The nerve cells can be categorized according to their shape and size or according to their connections. But before that, the main parts of the neurons should be introduced. All neurons have a cell body which is also called soma or perikaryon. The cell body includes the nucleus, the Golgi apparatus, ribosomes and mitochondria. The cell body supports the metabolic and synthetic needs of the rest of the neuron. The cell bodies of neurons range from 5 to 120 µm across [5]. Dendrites are large extensions and branches of the cell body that receive information from other neurons via synaptic contacts or synapses. The large and thin cylindrical part of the neurons that conduct the information from the cell body to the other end of the neurons is called the axon. The electrical signals are conducted through the axons only in one direction and therefore neurons are anatomically and physiologically polarized [2]. The axons can be covered with a substance called myelin which will be introduced later in this section. In humans, axons’ diameter range from 0.2 to 20 µm, and they also vary in length from few µm to over a meter [5]. The axons reach to a series of terminal branches at the other end of the neuron that form synapses on other neurons (Figure 2.1).
8
Figure2.1-The main components of a neuron. Reference: Edited from en.wikipedia.org. Copyright: Creative Commons cc BY-SA 3.0
The synapse is a structure that allows a neuron to send electrical signals, which are passed through the axon to the axon terminals, to the other neurons via neurotransmitters (Figure 2.2).
Figure2.2-Instruction of a synapse. The synapses are the gaps between the axon terminal of a neuron and the dendrites of other neurons through which the neurotransmitters pass the information. Reference: en.wikipedia.org. Public domain.
9
2.1. Neurons classification
According to the structure of neurons which is defined as the size and shape of the cell body, its dendritic tree, and length of axons, they are divided into three categories: multipolar, bipolar and unipolar. Multipolar neurons have multiple dendritic projections from the cell body and almost always possess an axon. Other neurons, which have two or one processes, are called the bipolar and unipolar neurons respectively.
Another classification of neurons is based on the shape of the dendritic tree and the absence or presence of the dendritic spines from which the efficiency of the synaptic connections and the functionality of the cell can be determined. In this classification, there are pyramidal cells which contribute about 60% of the neurons in the cerebral cortex. The name is derived from their pyramidal-shaped cell body and dendrites. Another group of neurons are called stellate cells. Their star-like shape of dendrites has brought this name. Purkinje cells are the last group in this classification. These are located in the cerebellum.
The last type of classification of neurons that we introduce in this section is based on their connections. A neuron that conducts impulses into the CNS is called an afferent neuron. Afferent neurons that are capable of responding to the physiological stimuli directly are called sensory neurons. On the other hand, a neuron that carries the nerve impulses out of the CNS to the muscles or glands is called an efferent neuron. A type of efferent neurons that originate in the motor cortex is called motor neuron.
There are also other categories of neurons that are classified according to their axon’s length or the type of neurotransmitters that they secrete, but we will not go into their details here. As this section implies, there are several type of neurons with different duties in the nervous system, however, there are common properties between them and that is how neurons communicate with each other.
10
2.2. Communication between neurons
Like other cells, a typical neuron contains a nucleus surrounded by cytoplasm. The cytoplasm contains the intracellular fluid and some ions such as K+. The extracellular fluid is a weak solution of salt (NaCl). In fact, the presence of ions inside and outside the neuron causes the membrane of the neuron to be electrically polarized to a resting potential. The changes from this resting potential are the basis of communication between neurons. This section describes the anatomical and physiological aspects of neurons which lead to nerve impulses.
It is important to note that nerve cells are electrically excitable. But what causes this excitability? Similar to other cells in the body, the intracellular and extracellular fluid is separated by a double layer of lipids (fatty acids). Due to the molecular characteristics of the phospholipids (the lipid component of the membrane), the lipid bilayer functions as a capacitor; it is able to store the opposite charges or ions but is unable to pass them across the membrane. However, there are several types of proteins embedded in the cell membrane which have different tasks, but one of the most important is to regulate the movement of solutes (including ions) across the membrane. These proteins give the membrane different permeability to different ions. This is due to their structure; these proteins have several subunits surrounding a central aqueous pore. According to the size and charge of the ions, they might get the chance to diffuse through the protein’s pore. To describe this in electrical terms, the proteins (which serve as ion channels), act like resistors, allowing a certain amount of current to flow in response to a voltage across them. According to the gating property of these proteins they can be classified as follows [2], [5]:
1. Voltage-gated channels: These channels open in response to changes in membrane potential. A good example of these channels is the voltage-gated sodium channel. 2. Ligand-gated channels: They open or close in response to the binding of signaling
molecules. Their name is derived from the name of the bound molecule which is called a ligand. One of the well-known ligand-gated channels are postsynaptic
11
receptors that bind specific neurotransmitters and in response, change their permeability.
3. Thermally-gated channels: They act like tiny thermometers or as thermal injury detectors.
4. Mechanically-gated channels: They open when the membrane is stretched or mechanically deformed. A receptor cell of the inner ear is an example of this type.
2.2.1. Resting potential
It was mentioned before that there are ions in the intracellular and extracellular fluids of the neurons. The extracellular fluid components are sodium (Na+) and chloride (Cl-) ions. The intracellular fluid contains potassium ions (K+) and some organic anions (organic acids, sulfates, phosphates, some amino acids). The permeability of the membrane to K+ is high. That means that potassium ions can diffuse inside and outside the cell easily. Since there are higher concentrations of potassium ions inside the neuron, more K+ will move outside the cell by way of the concentration gradient. This causes an increase in the negative charges inside the cell. As a result, an electrical potential is generated that will prevent more K+ to move out of the cell (figure 2.3-A). By the time that these two forces (i.e. concentration gradient and electrical gradient) balance each other, the neuron has reached equilibrium (i.e. no energy is required to keep the system in this state) (figure 2.3-B). The membrane potential at this point is equal to the potassium equilibrium potential (Vk). This
equilibrium potential can be calculated for different ions using the Nernst equation. According to this equation:
𝐸 = (𝑅𝑇 𝑧𝐹⁄ ) ln(𝐶𝑒⁄ ) (2.1) 𝐶𝑖
E: the equilibrium potential R: the universal gas constant T: temperature in Kelvin
12
F: Faraday’s constant, the quantity of the electricity conveyed when one mole of the univalent ion passes from one solution to another (96,500 coulombs)
Ce and Ci: external and internal concentration of the ion respectively
Usually the potassium equilibrium potential for nerve cells is around -90 mV. However since the membrane in its resting state (absence of stimuli) has some (although small) permeability to other ions as well, such as Na+, the equilibrium potential will not be -90mV. In fact, similar to K+ but with much lower rate, sodium ions diffuse to the intracellular fluid as a result of the interior negativity of the cell and the concentration gradient. Therefore, the flow of Na+ inside the cell causes the membrane potential to be less negative (Figure 2.3-C).
13
Figure2.3-Development and preserving the membrane resting potential. (A)Due to the higher number of potassium ions inside the cell, more K+ move outside the cell membrane. (B) Equilibrium between concentration gradient and electrical gradient for potassium ions. (C) Sodium ions move into the cell with a lower rate compared to K+ causing the cell membrane to be less negative. (D) The inward flow of Na+ counterbalances the outward flow of K+ and the neuron is in its resting potential. Reference: Modified from [2]. Copyright: © Mosby (2009). Reproduced with permission from Elsevier.
By the time the inward current of Na+ counterbalances the outward K+ current, the cell has reached a steady state (Figure 2.3-D). At this point the neuron is at its resting potential which is about -65 mV.
2.2.2. Action potential
Neurons do not always remain in their steady state. They can be excited by synaptic inputs to their dendrites and cell body from other cells or by receptor potentials that sensory organs produce. This excitation causes their membrane potential to become less negative. This drop of membrane potential is termed depolarization. In fact, the permeability of the membrane to different ions changes as a result of the received stimuli, therefore, the membrane potential drops and depolarization occurs. The two most effective channels during the excitation of the neuron are the K+ and Na+ channels. The voltage-gated Na+
14
channels have three states: in the steady state the probability of being open is low, in other words the permeability of the membrane to Na+ is very low. When the neuron get excited (during depolarization), this probability increases rapidly for about a millisecond, therefore the flow of sodium ions into the cell increases and cause the membrane potential to become less negative. The voltage-gated Na+ channels then become inactivated which means that theyare closed and will not reopen in response to any depolarization, no matter how strong the stimuli. Repolarization of the membrane to the resting potential will move the state of these channels from inactivated to the resting state or so called deinactivated. During small depolarization, the inward Na+ current is in balance with the outward K+ current. However, if a neuron is depolarized enough, it will reach a threshold which causes more sodium channels to open; the sodium conductance reaches a value about 50 times greater than that of the K+ conductance [2]. This is the moment that an action potential (also referred to as a
spike or a nerve impulse) will occur. The membrane potential will increase about the
sodium equilibrium potential (VNa). Two phenomena happen as the membrane potential is
increasing, in order to terminate the action potential: as stated before, the voltage-gated sodium channels become inactivated, in addition the voltage-gated K+ channels open. The K+ channels which stay open for a few milliseconds let the potassium ions flow outside the neuron, and this leads the membrane potential to become more negative than the resting potential (there is an overshoot). This is called after hyperpolarization. Hyperpolarization then fades within few milliseconds letting the membrane potential to reach again its resting potential (figure 2.4)
There are common properties in action potential of neurons. The most important ones are: 1. The action potential occurs when the neuron receives a minimum threshold
stimulus. This threshold is defined as the current that causes the neuron’s firing 50% of the times. The amplitude of this stimulus depends on the size of the neuron, since the size of the neuron can affect its resistance to stimuli.
15
Figure2.4-Channels states during generation of an action potential. The blue curve (VM) is
an action potential. 𝒈𝑵𝒂 and 𝒈𝑲 are curves for the conductance of sodium and potassium ions respectively in the neuron’s membrane . During an action potential, the membrane potential increases towards the Na+ equilibrium potential (𝑽𝑵𝒂) and decreases back again
close to K+ equilibrium potential (𝑽𝑲). Reference: Modified from [2]. Copyright: © Mosby (2009). Reproduced with permission from Elsevier.
2. In a particular nerve cell, all action potentials have almost the same amplitude. No matter how different the stimuli are in power, as long as they pass the required threshold for that neuron, an action potential will occur with the same amplitude. This is often called as the all-or-none rule. In fact, the difference in neurons’ firing lies in their frequency of firing (i.e. how often they get excited and send an action potential). Two examples of different neuronal firings are shown in figure 2.5. 3. The action potential will occur with a little latency from the onset of the stimulus.
16
Figure2.5-Examples of firing patterns in different neurons. Two types of cortical neurons respond to steady depolarization (onset and offsets are shown by blue arrows) with series of bursts (A) and declining frequency (B).Reference: modified from [2]. Copyright: © Mosby (2009). Reproduced with permission from Elsevier.
4. For a brief time after the peak of an action potential, most of the Na+ channels are inactivated and as mentioned before, no matter how large a stimulus, another impulse cannot be generated (there is a dead time in the language of electronics). This is called the absolute refractory period. After the spike, some of the Na+ channels are back to their resting state. This period is the relative refractory period in which another spike can be generated. However, since the cell is hyperpolarized, a bigger current or stimulus is required to bring the cell to its threshold voltage. Although both of these periods are very short (about a few milliseconds), they have an important effect on the production and propagation of action potentials:
- They set limits on the frequency of the action potentials that a neuron can produce.
17
5. Action potentials do not decrement (i.e. do not decrease in amplitude) during propagation and this is one of the important properties that let the neuronal outputs convey information to long distances in the cortex and in body.
The opening and closing of the channels that causes action potentials, also triggers them down the axon to finally cause the release of neurotransmitters to the synapses where the information will be transferred to adjacent neurons by neurotransmitter molecules.
18 3. Electroencephalography (EEG)
Electroencephalography is a neuro-imaging modality that is widely used in clinical applications to detect some neurological disorders. It is also used for clinical and fundamental research. Although other imaging technics such as computed tomography (CT) and MRI has been developed over the years, EEG has still its niche applications.
3.1. History
Uncovering the brain’s electrical activity goes back to 1875 when Richard Caton reported the observation of electrical activity in the brain of monkeys and rabbits [6]. He made his measurements using a device called a Thomson’s mirror galvanometer. After this report, brain waves of dogs, monkeys, rabbits and cats were recorded by Caton and others. Years later, in 1924, Hans Berger attempted to record the first electroencephalography in humans. Berger was a professor of psychiatry at the University of Jena in Germany at the time. In his first recording of the human EEG signal (for short an EEG), Berger used a string galvanometer that was designed to record electrocardiograms. The first published recorded rhythm was the EEG of a forty-year old man with a brain tumor. A part of the bone flap was removed in this patient to relieve the brain pressure from the tumor; therefore Berger could record the EEG by placing a needle electrode subcutaneously. During the 1930s,
19
Berger reported different observations in EEG recordings such as the fluctuations of consciousness, first EEG recordings of sleep and the effect of hypoxia on brain rhythms [7]. He was the first to use the word electroencephalogram to refer to brain electric potentials in humans.
3.2. EEG System
Today, surface EEG is recorded using electrodes installed on a cap that the patient wears directly on his scalp. An EEG measured directly from the cortical surface is called an electrocorticogram or ECoG, and when depth probes are used for the recording, it is called an electrogram. Although ECoG and electrograms can record brain activity at higher SNR, due to their invasiveness, they are only used for some special clinical procedures in humans. In this project, we only used surface EEG which is a non-invasive technique, and can be used repeatedly on patients, normal adults and children with virtually no risk or limitation.
The recording system that is employed for encephalographic measurements consists of electrodes with conductive media, amplifiers with filters, analog-to-digital (A/D) converters, and a recording device. Electrodes receive the signals from the scalp; the amplifiers enhance the signals’ amplitude, the A/D converter converts the analog signal into a digital signal, and finally the data is displayed and stored in a computer.
EEG signals show the potential changes of neuronal activity in each electrode over time. In fact the measured voltage is the difference of the electrical potential between each electrode (active electrode) and a reference electrode. A third type of electrode, called the ground electrode is defined within the set of EEG electrodes for getting differential voltages by subtracting a voltage common to the active electrodes and the reference.
The number of electrodes varies depending on the application. It is, however, important to note that increasing the number of electrodes to enhance the precision of recording has its limits, for if the electrodes are too close to each other, they will receive almost the same electrical field and therefore there would be no further enhancement of the spatial resolution. In addition to the variety in the number of electrodes used in different applications, the placement of the electrodes on the EEG-cap can also vary. One of the
20
internationally recognized methods to describe the location of the electrodes is the 10-20
system. This system is based on the position of the electrode on the scalp and the
underlying area of the cortex. According to this method, the distance of adjacent electrodes is either 10% or 20% of the front-back or right-left distance of the skull [8]. Electrodes are labeled according to the underlying brain areas; they can be labeled showing only one area: F (frontal), C (central), T (temporal), P (posterior) and O (occipital), or they can also be labeled combining two areas. The labels are accompanied by odd or even numbers for the left side or right side of the brain respectively. A sample of electrode positions is shown in figure 3.1. In this project a 64-electrode EEG cap was used following the 10-20 system.
Figure3.1-Electrodes positions. Reference: Brain product. Copyright: © 2005. 2006 Brain Products GmbH, Munich. Germany | Mail: [email protected] | Version: 20-07-2006
21
3.3. EEG Frequency Bands and Properties
EEG signals consist of different frequency bands or oscillations. The frequency of a signal is usually introduced by the number of cycles per second or Hertz (Hz). For a complex signal like EEG, one can measure its power spectrum density (PSD) via a Fourier transform and observe the frequency bands in which EEG signals have the highest power. Some of the oscillations of EEG were observed by Hans Berger during his research. He named the large-amplitude rhythms that could be detected during the eye closure of the awake subjects, “alpha”, since he discovered them first. Berger used different Greek letters to name EEG oscillations [9] . Later in 1974, the first classification of EEG frequency bands was done by the experts of the International Federation of Societies for Electroencephalography and Clinical Neurophysiology [10]-[11]. They followed Berger’s tradition using the Greek letters to name the different frequency bands: Delta (0.5-4 Hz), Theta (4-8 Hz), Alpha (8-12 Hz), Beta (12-30 Hz) and Gamma (>30 Hz) are different frequency bands of brain waves. An example of these rhythms is shown in figure 3.2. Each of the above frequency ranges are known to be related to certain mechanisms or functional areas of the brain [12]–[15]. For example, Alpha waves are known to be mostly related to the occipital lobe of the cerebral cortex. They are slow waves with high amplitude that are observed when an individual is relaxing or resting; their amplitude increases during the eye closure. Gamma rhythms are associated with memory tasks and can bind perceptual information from different regions of the brain to episodic representations [16].
3.4. The Source of EEG signals
The source of EEG signals is generally believed to be synchronous post-synaptic potentials [17]–[19]. As was discussed in previous sections, an action potential will occur only if the stimulus is strong enough and the neuron’s membrane potential passes its threshold. In the rest of the cases, the stimulus causes synaptic potential that can be either excitatory post synaptic potentials (EPSPs) or inhibitory post synaptic potential (IPSPs).
22
Figure3.2-Different frequency bands of EEG. Frequency bands of a one second EEG are shown as: (A) Delta, (B) Theta, (C) Alpha, (D) Beta and (E) Gamma, with the same raw EEG one second window.
EPSPs and IPSPs have slower oscillation compared to the fast action potential. In other words, they are considered low frequency signals and an action potential is considered a very high frequency signal. From the signal processing point of view, when a series of asynchronous high frequency signals are summed together, the final signal would be smaller in the amplitude (i.e. the asynchrony of the signals attenuate the effect of each other
23
– some form of destructive interference). For this reason it is believed that surface EEG does not reflect the firing activity of neurons. In addition, the number of neurons reaching their threshold level is smaller than the neurons displaying synaptic potentials [17], [20], and therefore the contribution of EPSPs and IPSPs appears to be much higher than that of action potentials.
Only the electrical activity of large populations of neurons is detectable with surface EEG and this is due to the different layers that exist between the skull and the neurons, and the fact that each electrode of the EEG system detects the sum of electrical field of large populations of neurons underlying that electrode (figure 3.3). In addition, these layers act like resistors for the electrical signal that penetrates through them to the scalp. That is why weak signals are massively amplified by EEG systems.
It has been shown that different factors can affect EEG signals or brain activity including biochemical, metabolic, circulatory, hormonal, neuroelectric and behavioral factors [21]. These factors might affect the characteristics of the brain waves in different frequency bands and in some cases a neurological disorder can be detected by observing an abnormal behavior in a frequency band or in an entire EEG signal. For example, EEG recording of a patient with epilepsy shows high-voltage increases in the voltage that is caused during the seizures.
24
Figure3.3-Layers between scalp and cerebral cortex. The electrode on the surface of the scalp receives the sum of electrical field of the population of neurons which passes through different layers until reaching the scalp. Reference: en.wikipedia.org. Copyright: Creative Commons cc BY-SA 3.0
3.5. States of EEG recording
An EEG can be recorded with different methods. This usually depends on the frequency bands that are required for a specific study. A first method is recording the EEG during stimulus related tasks. The stimulus can be auditory or visual. Usually the tasks are short periods followed by periods of rest. A second method is recording EEG during sleep. One of its applications is to study individuals with sleep disorders. Finally, an EEG can be recorded during resting state. In this method, subjects are asked to calmly sit in a quiet room with eyes closed. Usually the subject is instructed not to fall asleep and only to relax. In this project data was collected during resting state. One of the great advantages of resting state recording is that it doesn’t require the active participation of the subject; therefore it makes it ideal for future clinical research as in some neurological disorders where the patient might not be able to follow a task related recording procedure completely.
25 4. FIR Filters and Hilbert Transform
To process EEG signals, one has to use different filtering techniques to remove some artifacts and to obtain signals from different EEG frequency bands. Usually, aside from filtering, other methods such as independent component analysis (ICA) are performed to remove the motion artifacts from EEG signals caused by movements of muscles. However, since during resting state the subject’s movements are minimized, no major motion artifacts were observed in the collected data.
In this project, it was of great importance to calculate the power and phase of EEG rhythms efficiently. Hence, the two following subsections are brief introductions to the techniques that were used to carry out the required information.
4.1. Hilbert Transform
The Hilbert transform is named after the great German mathematician, David Hilbert (1862-1943). In a Hilbert transform, a complex-valued signal is generated from a real-valued signal. In other words, it is a process used to transfer a signal to a new dimension which subsequently allows simplifying the analysis of the signal. It is commonly used for signal processing in many applications such as instantaneous frequency estimation, radar/ sonar signal processing, high-definition television (HDTV) receivers, loudspeaker, room
26
acoustics and mechanical vibration analysis, etc. All these application require the measurement or processing of a complex time-domain signal and that is where the Hilbert transform simplifies the process by taking the two-dimensional real signal to three-dimensional complex signal.
The Hilbert transform of a real continuous signal 𝑥𝑟(𝑡) is defined as:
𝑥ℎ𝑡(𝑡) = ℎ(𝑡) ∗ 𝑥𝑟(𝑡), (4.1)
where 𝑥ℎ𝑡(𝑡) is the Hilbert transform of 𝑥𝑟(𝑡) in time-domain, ℎ(𝑡) is the time impulse
response of the Hilbert transformer and the ∗ symbol means convolution between the two signals. The spectrum of 𝑥ℎ𝑡(𝑡) can be defined as:
𝑋ℎ𝑡(𝜔) = 𝐻(𝜔)𝑋𝑟(𝜔), (4.2)
where 𝑋ℎ𝑡(𝜔) is the Fourier transform of 𝑥ℎ𝑡(𝑡), 𝐻(𝜔) is the frequency response of a Hilbert transformer and 𝑋𝑟(𝜔) is the Fourier transform of the real input 𝑥𝑟(𝑡). Equation
(4.2) shows how the Hilbert transform and the Fourier transform are related to each other. Mathematically, 𝐻(𝜔) = −𝑗 over the positive frequency range and it is equal to +𝑗 for the negative frequency range. This means that the positive-frequency components of 𝑥ℎ𝑡(𝑡) are equal to the positive-frequency components of 𝑥𝑟(𝑡) shifted in phase by -90 degree and
negative-frequency components of 𝑥ℎ𝑡(𝑡) and 𝑥𝑟(𝑡) are equal with a phase shift of +90
degree. Therefore, as an example, the Hilbert transform of a cosine wave is a sine wave.
In order to measure the instantaneous power and phase of the real time-domain signal 𝑥𝑟(𝑡), a complex (analytic) signal 𝑥𝑐(𝑡) must be generated.
𝑥𝑐(𝑡) = 𝑥𝑟(𝑡) + 𝑗𝑥𝑖(𝑡) (4.3)
As it is shown in the above equation, the real part of the complex signal is equal to the original input signal. The imaginary part of 𝑥𝑐(𝑡) is the Hilbert transform of 𝑥𝑟(𝑡). In many
27
the instantaneous power, phase and frequency of a signal. It is important to note that in many situations the signals are not as simple as a cosine wave, particularly in this project where there are signals with different frequency bands and complicated characteristics. Therefore using the Hilbert transform and the analytic signal is an efficient way to calculate the required information.
We can measure the instantaneous magnitude (envelope or amplitude), 𝐸(𝑡), of a real signal 𝑥𝑟(𝑡) from an analytic version of the signal using
𝐸(𝑡) = |𝑥𝑐(𝑡)| = √𝑥𝑟(𝑡)2+ 𝑥
𝑖(𝑡)2. (4.4)
The magnitude of the analytic signal is a more accurate representation of the input waveform than taking the envelope of 𝑥𝑟(𝑡) by low-pass filtering it.
On the other hand, if one wants to get the instantaneous phase, 𝜙(𝑡), of the signal 𝑥𝑟(𝑡) at
any given time point, it can be estimated using
𝜙(𝑡) = tan−1(𝑥𝑖(𝑡)
𝑥𝑟(𝑡)). (4.5)
It is worth noting that the Hilbert transform is one of the few techniques to calculate the instantaneous characteristics of a signal. In next chapter, we exploit this capability to calculate the power and phase of two frequency bands of EEG signals.
4.2. FIR Filters
Filtering is an important part of data processing. The key point to choose the right type of filter in this project was to avoid any phase distortion in the data, as phase of a certain frequency band was important for the analysis. Finite impulse response (FIR) filters could satisfy this requirement.
Generally, a causal discrete time FIR system of order N is introduced by its difference equation:
28
𝑦(𝑛) = ∑𝑁𝑘=0𝑏𝑘𝑥(𝑛 − 𝑘). (4.6)
This means that the output is a weighted sum of the recent inputs. In this equation, 𝑏𝑘 is the value of the impulse response for the kth instant for 0 < 𝑘 < 𝑁, 𝑦(𝑛) is the output (filtered) signal and 𝑥(𝑛) is the input signal.
The impulse response ℎ(𝑛) of an FIR filter is defines as:
ℎ(𝑛) = ∑𝑁 𝑏𝑘𝛿(𝑛 − 𝑘)
𝑘=0 = {𝑏0 𝑜𝑡ℎ𝑒𝑟𝑤𝑖𝑠𝑒𝑛 0 ≤ 𝑛 ≤ 𝑁. (4.7)
Some of the main properties of FIR filters are:
1. They do not require feedbacks. Therefore if any rounding error occurs, they are not combined by the summed iterations.
2. They are inherently stable. This is due to the fact that the output is the weighted sum of a finite number of inputs, and therefore cannot be greater than ∑𝑏𝑘 times the greatest value of the input.
3. As mentioned before, they are ideal in applications that are phase sensitive. They can be designed to be linear phase by making the coefficients symmetric.
In this project we used FIR filters from the open source toolbox, EEGLab, which is designed to process EEG data and therefore, they are designed to be linear phase.
29
5. Power Spectrum Density (PSD) and Power law distribution
To better understand the importance of the results that are provided in the next chapter, two concepts are introduced here: power spectrum density and power law distribution.
5.1.Power Spectrum Density (PSD)
Power spectrum density shows the variation of power (strength) of a signal as a function of frequency of the signal. Therefore, for a time-domain signal 𝑥(𝑡), power spectrum density shows how the energy of the signal is distributed over frequency components of the signal. The average power of 𝑥(𝑡) is defined as:
𝑃 = lim𝑇→∞𝑇1∫ 𝑥(𝑡)−𝑇𝑇 2𝑑𝑡 (5.1)
If the signal has a finite total energy then the energy of the signal is simply:
𝑃 = ∫ |𝑥(𝑡)|∞ 2𝑑𝑡
−∞ . (5.2)
In this case, according to Perseval’s theorem, an alternative expression for equation (5.2) as follows:
30
∫ |𝑥(𝑡)|−∞∞ 2𝑑𝑡= ∫ |𝑋(𝑓)|∞ 2𝑑𝑓
−∞ , (5.3)
Where 𝑓 is the frequency and 𝑋(𝑓) is the Fourier transform of the signal 𝑥(𝑡).
Having the power of signal on one side of equation (5.3), |𝑋(𝑓)|2 can be interpreted as a
density function which describes the energy per unit frequency that signal have at the frequency 𝑓. Therefore the power spectrum density for the signal 𝑥(𝑡) can be defined as:
𝑆𝑥𝑥(𝑓) = |𝑋(𝑓)|2. (5.4)
5.2. Power law distribution (1/f Noise)
Power law, also known as Taylor’s law in ecology or the fluctuation scaling law among physicists is a functional relationship between two quantities such that one of the quantities varies as a power of another. In other words this law states that the variance of a quantity has a power functional relationship with the mean. In this study, what interests us the most, is the 1/𝑓 trend that we get from the PSD of the derived signals from EEG recording, which will be explained in more details in the next chapters. This 1/𝑓 trend is also interpreted as 1/𝑓 noise and recently in neuroscience it is also known as “scale-free brain activity”. Here a brief introduction to 1/𝑓 noise is provided.
When the spectral density, 𝑆(𝑓), of a signal has the form:
𝑆(𝑓) = 𝐶/𝑓𝛼, (5.5)
it is interpreted that the signal has the “1/𝑓 Noise” properties. However not in all of the cases, this trend can be taken as noise. In equation (5.5), C is a constant and α is a signal-dependent parameter. The signals with such pattern with 0.5 < 𝛼 < 1.5 are observed a lot in the nature. As it was mentioned before, in physics, ecology, biology, astrophysics, geophysics, economics, psychology, language and even music, there are examples of the 1/𝑓𝛼 signals [22], [23]. For 𝛼 = 1, also known as pink noise, it is interesting to mention
31
From the mathematical point of view, the so called 1/𝑓 noise is an intermediate between white noise (𝛼 = 0) which has no correlation in time and Brownian motion (𝛼 = 2) with no correlation between increments. A simple mathematical operation shows that Brownian motion is the integral of white noise. Integration or the inverse operation, differentiation, changes the exponent α by 2 degrees. Therefore, 1/𝑓 noise cannot be simply derived from white noise or Brownian motion, and except from the description of fractional Brownian motion which is the half integral of a white noise signal, there are no recognized physical explanations for 1/𝑓 noise. Nevertheless, observing the same distribution (1/𝑓 noise) in very different phenomena in nature, suggests that a mathematical and physical explanation must exist. It is important to investigate the contribution of 1/𝑓𝛼 signals in each
observation, instead of simply interpreting them as noise and remove them from further studies.
More related to the topic of this project, is the power spectrum of the brain electrical field potentials in which power falls off by increasing the frequency, following a power law distribution [24]. As one of the main characteristics of the signals with power law function is their scale invariance, which means that no particular time scale or frequency can dominate the dynamics. This suggests that the brain activity that follows a 1/𝑓 slope in the power spectrum is arrhythmic and is devoid of periodicity. As a result, recently in neuroscience the term of “scale-free brain activity” has brought up mostly according to the scale-invariant nature of these signals [25]. According to different studies and recording of different brain activities, He et al. [25] propose two categories for neuronal activity: Brain oscillation versus scale-free brain activity. The former group is considered the periodic and rhythmic brain activities which can be defined in certain frequency domain, whereas, the latter, is arrhythmic. However, due to different evidences that are mentioned by He et al. [25] and the mathematical concerns mentioned above, the second group should also be considered in analysis and not to be ignored by interpreting them as noise.
32
CHAPTER 2
H
YPOTHESIS
In previous sections, we alluded to the general belief that the contribution of the neuronal firing is a negligible source for the EEG signal. However, a recent study has provided evidences showing that coupling between two frequency bands of EEG can be a good predictor of underlying neuronal firing [26]. According to this study which was done on macaque monkeys, when there is high Gamma power during negative going Delta rhythm, the probability of spiking activity of neurons is higher. Simultaneous surface EEG and intracranial recording was performed on the monkeys in order to be able to establish such relationship.
Here for the very first time to our knowledge we used this method and the aforementioned relationship of Gamma power and Delta phase during the mass-spiking activity of neurons to derive an estimated spike signal from the surface EEG in normal adult humans.
We hypothesized that due to the similarity of the brain of macaque monkey with human brain [27]–[30] and previous evidences from LFP and EEG signals [26], [31]–[34], a similar interaction exists between Gamma and Delta frequency bands of human EEG during spiking activity of neurons. In addition, resting-state recording of EEG was assumed to be an ideal modality of recording EEG as it does not require any active involvement of the subject.
The goal of this study was to derive a modeled spike signal (also introduced as MSS in this document) from this interaction and to assess the reliability of it, and also to investigate the reliability of resting-state recording for this study.
CHAPTER 3
A
RTICLE
Properties of mass-spiking activity in humans measured
by non-invasive EEG
Authors: Zahra Owji, Yves Bérubé-Lauzière, Kevin Whittingstall
Status of the article: Submitted to Clinical Neurophysiology
Foreword: This article is the result of the research I have done during my master’s studies. It describes an investigation on the possibility of deriving a modeled signal for spiking activity of neurons through non-invasive EEG. In this article a method to derive the modeled spike signal (MSS) is provided and then the different properties of MSS are studied to qualify the reliability of the signal. Specifically, the article focuses on the properties of the power spectrum density (PSD) of MSS and shows high similarities with the PSD obtained in animal studies. It also provides evidences on the existence of correlations between inter-hemispheric MSS signals.
According to the results of this research, the proposed method can be used for further studies of mass-spiking activity in fundamental research in which one cannot access to
34
intracranial recordings of neurons. It could also be applied in clinical research to prevent invasive recordings such as ECoG as much as possible.
References cited in the article:
35
Title: Properties of mass-spiking activity in humans measured by
non-invasive EEG
Authors: Zahra Owji 1, Yves Bérubé-Lauzière 2, 3, Kevin Whittingstall 3, 4*
1. Department of Molecular Medicine and Radiobiology, Faculty of Medicine and Health Sciences, Université de Sherbrooke, 12e Avenue Nord, Sherbrooke, Qc, Canada, J1H 5N4
2. Department of Electrical and Computer Engineering, Faculty of Engineering, Université de Sherbrooke, 2500 Boulevard Université, Sherbrooke, Qc, Canada, J1K 2R1
3. Sherbrooke Molecular Imaging Center, Université de Sherbrooke, 12e Avenue Nord, Sherbrooke, Qc, Canada, J1H 1N4
4. Department of Diagnostic Radiology, Faculty of Medicine and Health Sciences, Université de Sherbrooke, 12e Avenue Nord, Sherbrooke, Qc, Canada, J1H 5N4
*Corresponding author
Address: 3001, 12e Avenue Nord Sherbrooke, Québec, Canada J1H 5N4 Phone: 819 820-6868, poste 14647
Fax: 819 829-3238
Email: [email protected]
Conflict of interests: The authors declare that they have no conflict of interests.
Acknowledgement: We would like to thank Mr. David Provencher for his generous supports in computational analysis of the project. Our funding supports are the Canada Research Chair program (CRC), the Natural Sciences and Engineering Research Council of Canada (NSERC) and the Ministère du Développement Économique, de l'Innovation et Exportation (MDEIE).
36
Highlights:
1. We report on a method for deriving a modeled spike signal (MSS) from non-invasive EEG measurements in humans
2. The pattern of the power spectrum density of our modeled spike signal was found to
be similar to that of animal studies.
3. There is an inter-hemispheric correlation between the modeled spike signals which
37
Abstract
Objective: Recent studies have shown that the coupling between two EEG frequency bands, Gamma (25-45 Hz) and Delta (2-4 Hz), is a good predictor of underlying mass-spiking activity in monkeys. Specifically, when the Delta signal is in its trough and Gamma power is high, the probability of mass- firing of neurons is large. Here, we investigate this property in healthy human EEG acquired during resting-state.
Method: We measured resting-state (10 minutes) EEG in 15 healthy subjects. Using the interaction between delta phase and gamma power, we derived a modeled spike signal (MSS) for each.
Result: We found the power spectrum density pattern of the MSS to be similar to that observed in previous animal studies. Specifically, between 1-10 Hz the power spectrum density deviated from its 1/f trend and exhibited a small peak at about 2-3Hz. In addition, inter-hemispheric correlations of spontaneous fluctuations in the MSS were larger than intra-hemisphere correlations.
Conclusion: Our results thus open the possibility of studying neuronal output with non-invasive EEG.
Significance: Modeled spike signal is a reliable estimate of the mass-spiking activity and may be used as an alternative measure for analyzing EEG activity in humans.
38
Introduction
Electroencephalography (EEG) is the oldest tool used for studying brain activity though is still commonly used in many clinical and fundamental research applications. The source of the EEG signal is generally believed to be mainly driven by synchronous post-synaptic potentials (Musall et al. 2014; Klee et al. 1965; Creutzfeldt, Watanabe & Hans D. Lux 1966; da Silva & van Rotterdam 2005). For several reasons, it is commonly believed that the contribution of action potentials to the surface EEG signal is negligible. Excitatory synaptic potentials (EPSPs) and inhibitory post-synaptic potentials (IPSPs) generally oscillate at lower frequencies than spikes do and can thus more easily synchronize with neighboring neurons, allowing for constructive summation of signals which can propagate at longer distances in the extracellular space. In addition, the number of neurons reaching the threshold of an action potential is much less than the number of neurons displaying EPSPs and IPSPs which again increases the contribution of postsynaptic potentials to the surface EEG signal (Buzsáki 2006; Creutzfeldt, Watanabe & Hans D Lux 1966).
However, recent studies have shown that during the negative phase of the low-frequency (~<10Hz) local field potential (LFP), spiking is generally stronger than during the positive phase of low-frequency LFP (Rasch et al. 2008; Vato et al. 2012; Lakatos et al. 2005; Whittingstall & Logothetis 2009). In addition, negative-going phases of the LFP/EEG signal which are accompanied by a gamma-burst have shown to be relatively good predictors of the mass-spiking activity of neurons in macaque monkeys (Whittingstall & Logothetis 2009). Specifically, increases in spiking are associated only with gamma bursts which are nested in negative-going delta oscillations. Gamma amplitude and Delta phase act in a complementary manner to predict the spike rates and this is due to the nonlinearities in the engagement of excitatory-inhibitory loops and from temporal modulations in the amplitude of the network input (Mazzoni et al. 2010). Hence, it is now possible to broadly estimate the properties of neuronal firing from surface EEG.
In this study we focused on resting state EEG recordings to better explore non-invasively the spontaneous spiking activity of neurons. Given the high percentage of energy consumption (~60-80%) of the brain during spontaneous neuronal activity (Raichle 2006), we sought to investigate the frequency range of spontaneous mass-spiking fluctuations in humans. In addition, resting state recording does not require an active participation of the individuals that makes it more applicable in
39
studies of pathological cases. For this, we derived a modeled spike signal (MSS) based on the interaction between gamma power and delta phase and studied its properties. Our findings are two-fold: First, we observed that the power spectrum density of the MSS is similar to that observed via spike recordings in animals and humans, specifically in the 1-10 Hz range. Secondly, we also found that inter-hemispheric MSS correlations are stronger than intra-hemispheric, thus confirming previous invasive studies in patients. Overall, our proposed method for estimating mass-spiking in humans may lead to alternative ways of analysing and interpreting non-invasive EEG recordings in humans.
1. Methods 1.1. Data acquisition
Continuous 64-channel EEG was recorded at a sampling rate of 500Hz for 15 individuals (18-30 years, including 6 females). The electrodes placement followed the international 10-20 system with a reference electrode at the FCz location. All subjects had no history of neurological or psychiatric illness. Subjects were comfortably seated in a quiet room with eyes closed while EEG was recorded continuously for 5 minutes. The study was performed according to the guidelines of the Internal Review Board of the Centre Hospitalier Universitaire de Sherbrooke (CHUS).
1.2. Data analysis
All data analysis was carried out using functions in the EEGLab toolbox (Delorme & Makeig 2004) and custom-written scripts using the MATLAB programming language (Mathworks). We studied the data without re-referencing the signals to be in agreement with a previous study in monkeys (Whittingstall & Logothetis 2009) and only focused on the electrodes corresponding to the occipital lobe of the cortex (although more electrodes were used for studying the inter-hemispheric correlations, as described below). EEG signals were band-passed filtered into Gamma (25-45Hz) and Delta (2-4Hz) rhythms using FIR filters. The Hilbert transform was then used to derive instantaneous power and phase of Gamma and Delta bands, respectively. According to the previous studies in monkeys (Whittingstall & Logothetis 2009), the probability of mass-spiking activity of neurons is large when there is high Gamma power during negative Delta. In other words, the interaction of Delta trough and high Gamma power is a good predictor of neuronal outputs. This relationship between Gamma power and Delta phase opened the possibility to represent the spiking activity when direct access (i.e. intracranial recording) to neuronal outputs is not possible. Therefore, to derive a modeled spike signal (MSS), the instantaneous phase (defined to be in the
40
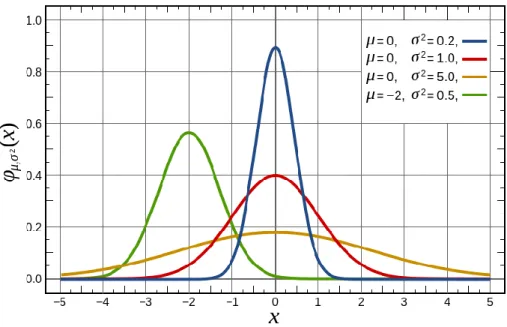
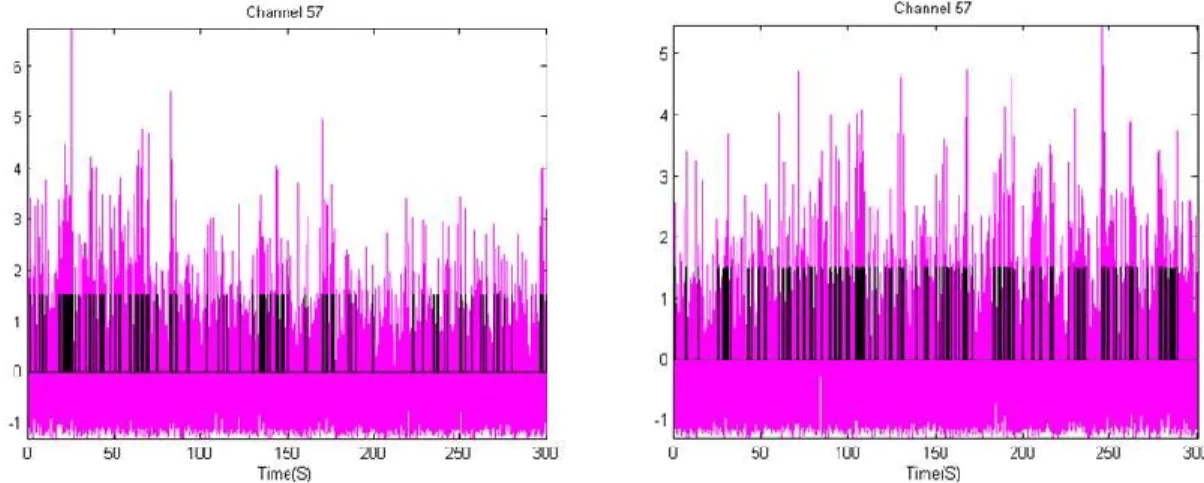
interval [0 2π]) of the Delta signal was used as a Gaussian weighting factor (µ = 0, 𝜎2 = 2.5) (i.e. 0
and 2π had the lowest weight and π had the highest weight). By multiplying the instantaneous Gamma power with these weights, the MSS was derived for each individual and for each electrode. An example of steps for deriving MSS is shown in Fig. 1.
2. Results
We first calculated the power spectrum density (PSD) of the MSS in occipital electrodes (Oz, O1, O2, PO9, PO7, PO3, POz, PO4, PO8, and PO1) and then averaged them over all ten electrodes of the occipital lobe. As shown in Fig. 2-A, frequencies below 0.5Hz represented the most important contribution and followed a 1/𝑓 trend. However, between 1-10 Hz the PSD deviated from the 1/𝑓 behaviour and exhibited a small peak at about 2-3Hz (Fig. 2a). To verify whether or not the pattern of the MSS PSD is similar to that of power modulations in different frequency bands, we also computed the PSD of the band-limited power (BLP) (Leopold et al. 2003) for each traditional frequency band of EEG in each channel. This verification is to ensure that the MSS PSD provides different information than the BLP. The BLP of a signal is carried out by taking the absolute value of the Fourier transform of the rectified signal. Although the 1/𝑓 pattern was observed in all signals, the slow peak between 2-3 Hz was only observed in the MSS PSD (Fig. 2-B).
Previous studies have shown that spontaneous fluctuations in neuronal firing are correlated across hemispheres (Nir et al. 2008). That is, slow fluctuations in spontaneous firing within the same functional area across hemispheres are more correlated than with other regions in the same hemisphere. To investigate this property on our data, we chose two sets of electrodes which had roughly the same distance apart but one set on the same hemisphere and the other on the opposite hemisphere. For this, we considered PO7 as the seed electrode and computed the Pearson Correlation Coefficient (CC) between the MSS of this channel with two other channels: (1) C5, which is located in the same hemisphere as the seed electrode with an inter-electrode distance of 𝐷𝑃𝑂7−𝐶5 = 82.02mm, and (2) PO8, which is on the opposite hemisphere with 𝐷𝑃𝑂7−𝑃𝑂8 =
99.37 mm. The CC was calculated for the aforementioned sets of electrodes in each subject. On average, we found a significantly higher CC between the MSS of the opposite hemispheres (𝑟𝑃𝑂7−𝑃𝑂8= 0.61 ± 0.07 and 𝑟𝑃𝑂7−𝐶5= 0.42 ± 0.13, 𝑝 = 0.002) . We repeated the same