Science Arts & Métiers (SAM)
is an open access repository that collects the work of Arts et Métiers Institute of Technology researchers and makes it freely available over the web where possible.
This is an author-deposited version published in: https://sam.ensam.eu Handle ID: .http://hdl.handle.net/10985/10418
To cite this version :
Bardia ESMAEILLOU, Joseph FITOUSSI, Fodil MERAGHNI, Abbas TCHARKHTCHI - Micro-mechanisms of fatigue in short glass fiber reinforced polyamide 66: A multi-scale experimental analysis - 2014
Any correspondence concerning this service should be sent to the repository Administrator : archiveouverte@ensam.eu
Science Arts & Métiers (SAM)
is an open access repository that collects the work of Arts et Métiers ParisTech researchers and makes it freely available over the web where possible.
This is an author-deposited version published in: http://sam.ensam.eu Handle ID: .http://hdl.handle.net/null
To cite this version :
Bardia ESMAEILLOU, Joseph FITOUSSI, Fodil MERAGHNI, Abbas TCHARKHTCHI - Micro-mechanisms of fatigue in short glass fiber reinforced polyamide 66: A multi-scale experimental analysis - 2014
Any correspondence concerning this service should be sent to the repository Administrator : archiveouverte@ensam.eu
MICRO-MECHANISMS OF FATIGUE IN SHORT GLASS FIBER
REINFORCED POLYAMIDE 66: A MULTI-SCALE EXPERIMENTAL
ANALYSIS
B. Esmaeillou a, J. Fitoussia*, F. Meraghnib, A. Tcharkhtchia a
PIMM - UMR CNRS 8006, Arts et Métiers ParisTech, 151, boulevard de L’Hôpital. Paris 75013, France
b
LEM3 - UMR CNRS 7239, Arts et Métiers ParisTech, 4, rue Augustin Fresnel. Metz Technopôle 57070, France
*joseph.fitoussi@ensam.eu
Keywords: polyamide composite, fatigue behavior, damage mechanisms
Abstract
The objective of this work is to identify and to analyze the main micro-mechanisms which govern the fatigue behavior of a short glass fiber reinforced polyamide 66 composite through a multi-scale experimental analysis. Tension-tension fatigue tests have been performed at different applied maximum stress and have been analyzed at both microscopic and macroscopic scale. Together with the progressive stiffness reduction, the temperature rise due to self-heating during cyclic loading has been measured using an infrared camera. Moreover, SEM fractography observations have been performed to assess the chronology of deformation mechanisms. Two principal mechanisms have been identified: matrix deformation due to self-heating and fiber-matrix interface damage. In addition, localized deformation zones have been observed around the fibers. The evolution of the size of these micro-ductile areas have been statistically related to the maximum applied stress. Finally, a competition between thermal fatigue and mechanical fatigue have been shown according to the loading amplitude.
1. Introduction
In the last ten years, the use of short glass fiber reinforced (SGFR) polyamide composites for highly stressed component has strongly increased. Because of their good thermomechanical properties [1], the increased production rates and the ease of obtaining complex shapes, these materials are a good candidate for the substitution of metal parts in particular in the automotive industry in which the polyamide composites allow the reduction of weights and improved corrosion resistance [2]. However, in order to be efficient, the introduction of this class of composite material needs new design methodology particularly for components submitted to fatigue loading in relation with the damage accumulation.
However, in order to improve the numerical predictive methods, the knowledge of the local mechanisms is mandatory. Such as several recent studies [3],[4], the objective of this work is to identify the main micro-mechanisms which govern the fatigue behavior of a SGFR PA66 composite. Through a multi-scale experimental analysis, we aim to relate the thresholds of these local mechanisms to the load amplitude, mean stress and self-heating effect.
After describing the PA66/GF30 composite material in terms of microstructure, viscoelastic properties and experimental conditions, the influence of damage and deformation mechanisms occurring under quasi-static and tension-tension fatigue loading is described.
2. Material and experimental procedure
2.1.Material
Polyamide 66 reinforced with 30 wt% glass short fibers with a density of 1409 13 (kg/m3) was provided by Solvay-France. It contains a black pigment, ideal for the automotive under hood parts. The fiber length is between 100 and 300 micrometres.
Viscoelastic characterization using Dynamic Mechanical Thermal Analysis (DMTA) with three point bending show a loss modulus (E”) spectrum with an transition temperature of 55°C. Differential Scanning Calorimetry (DSC) led to a lower value (Tg=42°C) of the glass transition temperature and to a degree of crystallinity is 354 (%).
Moreover, dumbbell-shaped (dogbone) tensile tests specimens according to the ISO 3167 standard, were injection moulded.
Most of the studies use specimen with different orientations of the reinforcing fibers in the skin, shell and core layers. In the present work, the injection conditions have been chosen to assure an homogeneous distribution of the fibers through the thickness of the sample. Indeed, tested specimens were injected at the required dumbbell-shaped geometry.
Observations under an optical microscope show that the majority of the fibers are oriented in the direction of injection, characterized by the Mold Flow direction (MFD), even in the core of the sample [5].
2.2.Quasi-static and Tension-Tension (TTF) Fatigue test
All mechanical tests were performed at 24 °C (room temperature) and at relative humidity of 50% (air conditioned room) where the specimens contain 0.1 % of water.
Tensile properties were carried out using Instron 5881 machine with a 10 KN load cell capacity. The strain was measured using an extensometer (INSTRON 2630-101).
Fatigue tests were conducted using an uniaxial servo-hydraulic fatigue test MTS 830. Tension-tension stress controlled fatigue tests were achieved at a load ratio of (R=0.1) and a frequency of 20Hz. Nine level of maximum stress have been applied for those TTF tests (MPa): 114.5 - 89 - 76 - 66 - 63 - 62 - 61 - 60.5 - 58.5. Temperature induced by the self-heating during fatigue tests were measured in the same specific area by an infrared thermometer (Raynger-MX4).
2.3.SEM fractography
The fracture surfaces were analysed by Hitachi S-4800 Scanning Electron Microscope with a potential acceleration of 0.8 KV.
3. Experimental results and analysis
3.1.Overall tensile behavior of the PA66 matrix and the P66/GF30 composite
Figure 1 compares the results of tensile tests performed on the pure PA66 and on the composite PA66/GF30 at room temperature. The presence of the strongly oriented glass fibers leads to an increased modulus and a low value of strain to failure (3%). For the pure PA66 matrix the strain to failure occurs after a necking and can reach up to 200%. One can also observe a non-linear behavior beginning up to 30% of the ultimate stress. The first
nonlinearity in the composite behavior corresponds to the non-linear behavior of the matrix since the important loss of ductility is due to damage mechanisms occurring at the microscopic scale.
Figure 1. Strain-stress curves of tensile tests performed at room temperature on the neat PA66 matrix (1) and the
P66/GF30 composite (2). Strain is measure by means of an extensometer
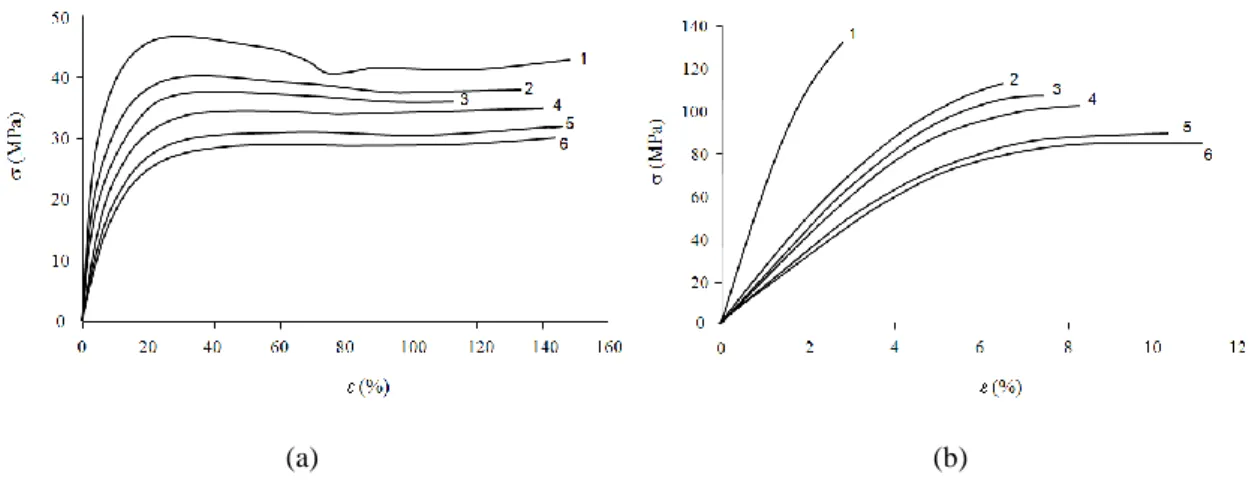
In order to evaluate the influence of the temperature on the pure PA66 matrix behavior, tensile tests have been performed on both PA66 and PA66/GF in a weathering (environmental) chamber at various temperatures ranging from 25°C to 90°C (figure 2). The strain was obtained using the temporal derivative of the displacement measured by a LVDT displacement sensor. Because of the limitation of chamber height, the test on pure matrix has been stopped before fracture. It can be seen in figure 2 that the mechanical properties are significantly affected by temperature especially when the temperature is higher than Tg.
(a) (b)
Figure 2. Stress-strain curves of pure PA66 (a) and PA66/GF (b) at various temperatures 25°C (1), 35°C (2),
45°C (3), 55°C (4), 75°C (5) and 90°C (6).
All of the material characteristics of the composite at room temperature are recapitulated in table 1. PA66/GF30 Vf (%) Density (kg/m3) Tg (°C) (%) E (MPa) r (MPa) r (%) 30 1409 13 55 (42) 354 8000185 13010 30.1
Table1. Main characteristics of the PA66/GF30
3.2.1. Wöhler curve
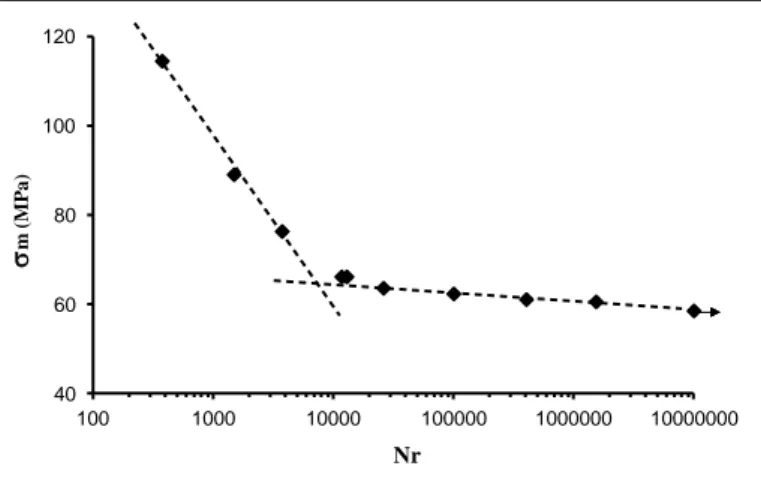
Tension-tension fatigue tests (TTF) have been performed at room temperature for a frequency of 20Hz. The minimum applied stress is always chosen to be equal to 10% of the maximum applied stress (load ratio R =0.1). The aim of this work being to analyze the main mechanisms and fatigue regimes, only one TTF specimen was tested for each of the nine chosen applied maximum stress levels mentioned in section 1.2. From these TTF tests on can build the Wöhler curve given on figure 3.
This Wöhler curve is obtained for the studied material molded according to the specific injection conditions assuring an homogeneous distribution of the fibers through the thickness of the sample as mentioned above in section 1.1. As it can be noticed, the fatigue life is about 105 cycles for a maximum applied stress equal to 62 MPa. It reaches about 106 cycles for a maximum applied stress of 60 MPa. So, a variation of only 2 MPa leads to a fatigue life 10 times higher. It is worth noting that a pseudo-endurance limit can be reached for a stress level of 58 MPa. It corresponds to a state where no macroscopic failure on the specimen was noticed or detected until 107 cycles. However, at this level of stress local damage mechanisms can occur.
Basically, this Whöler curve presents two different domains: higher (from 67 to 114 MPa) and lower values (from 58 to 64MPa) of applied maximum stress. It can be noticed that the maximum stress, m, in each of these domains can be approximated by a linear function of Nr. These two domains are separated by a transition zone around 65 MPa (intermediate maximum applied stress level).
40 60 80 100 120 100 1000 10000 100000 1000000 10000000 m (M P a) Nr
Figure 3. Wohler curve obtained from TTF tests performed at room temperature in tension-tension for a
frequency of 20Hz and R=0.1.
3.2.2. TTF curves
The chosen frequency is high enough to induce a thermal fatigue process in PA66/GF30 composite due to the self-heating of the matrix. Indeed, the observed temperature rise is mainly due to self-heating but can also be related to damage dissipation. The TTF curves are presented hereafter through the evolution of the relative Young's modulus (defined as the ratio of the Young’s modulus (E) at cycle N to the initial Young’s modulus (E0))versus the number of cycles. It can be noticed in the following TTF curves (figure 4) that the temperature follows the evolution of the loss of stiffness. The temperature evolution appears to be a good indicator of the fatigue behavior.
0 25 50 75 100 0 0.2 0.4 0.6 0.8 1 1.2 1 100 10000 1000000 T ( °C) R el a ti v e Y o u n g 's M o d u lu s E /E 0 N (cycles) 61 MPa-20 Hz E/Eo T Stage 1 Stage 3 Stage 2 Tg =55 C 0 25 50 75 100 0 0.2 0.4 0.6 0.8 1 1.2 1 10 100 1000 10000 100000 T ( °C) R el a ti v e Y o u n g 's M o d u lu s E /E 0 N (cycles) 66 MPa-20 Hz E/Eo T Mechanical fatigue Thermal fatigue (a) (b) 0 25 50 75 100 0 0.2 0.4 0.6 0.8 1 1.2 1 10 100 1000 10000 T ( °C) R el a ti v e Y o u n g 's M o d u lu s E /E 0 N (cycles) 76 MPa-20Hz E/Eo T 0 25 50 75 100 0 0.2 0.4 0.6 0.8 1 1.2 1 10 100 1000 T ( °C) R el a ti v e Y o u n g 's M o d u lu s E /E 0 N (cycles) 114MPa-20Hz E/Eo T (c) (d)
Figure 4. TTF curves : Evolution of the relative Young's modulus (E/E0) and temperature versus the number of
cycles for different maximum applied stress.
3.2.3. TTF curves analysis
The evolution of the relative Young’s modulus and the temperature has been analyzed as a function of the number of cycles. Figure 4(a) shows these results obtained for a low maximum applied stress (61 MPa)
The evolution of the relative Young’s modulus and of the temperature during a fatigue test shows three stages (see figure 4(a)):
1) Stage 1 is characterized by a rapid decrease of the relative Young’s modulus according to two regimes. Simultaneously, the temperature rises due to self-heating. This stage corresponds to the setting up of a thermal regime. One can notice that during this stage, the temperature exceeds the glass transition temperature (Tg =55°C).
2) Stage 2 is characterized by a plateau for both Young’s modulus and temperature. During this stage, the thermal regime is established and characterized by a stable value of the temperature (up to 63°) during a range of cycle from 104 to 105.
3) Stage 3 is characterized by a new decrease of the Young’s modulus simultaneously with a new increase of the temperature until final rupture is observed.
It is worth noting that the duration of this stage corresponds to 75% of the fatigue life (3.105 cycles for a fatigue life of 4.105 cycles). It can be assumed that during this final stage, occurring after the stabilization of the temperature, damage mechanisms become predominant. An accumulation of a diffuse damage over the whole volume of the specimen is then developed.
For intermediate level of stress (figure 4(b)) corresponding to the knee point in the Wohler curve shows an inflexion point : stage 2 (stable thermal regime) tend to disappear and stage 3
(damage) remains relatively short. Indeed, one observe that the stage 2 becomes very confined for intermediate level of stress (figure 4(b)) and both stage 2 and 3 completely disappear for higher stress level (figure 4(c) and 4(d)).
This results lead to consider the influence of two main phenomenon : thermal fatigue characterized by temperature rise due to self heating and mechanical fatigue due to damage development. In the case of low applied stress level (under 63MPa), thermal fatigue appears to be the predominant phenomenon during stage 1 (elevation of temperature) and stage 2 (stabilized thermal regime) since stage 3 is mostly governed by mechanical fatigue induced by damage accumulation.
The inflexion point observed in figure 4(b) is the result of the competition between thermal fatigue and mechanical fatigue. Indeed, due to the early contribution of the damage (from 5000 cycles), the stabilized thermal regime observed for the lower stress level (stage 2 in figure 4(a)) do not succeed to take place. The application of a higher stress level tends to produce a continuously increase of the temperature mainly due to self-heating and an emerging damage. For intermediate value of the maximum applied stress level, although the effect of the damage persists, thermal fatigue tends to become predominant. For the highest values of the maximum applied stress (higher domain of the Whöler curve) fatigue response is mainly governed by thermal fatigue (self-heating). No damage stage is observed. However, on can note that self-heating is also limited when the stress level increases. Indeed, applying a high level of stress leads to a rapid failure.
3.3.Analysis of the fatigue behavior at the microscopic scale 3.3.1 Micro-ductile areas
In order to determine the microscopic mechanisms at the origin of the fatigue behavior, SEM observations have been performed on the fracture surfaces of fatigue specimens. Micro-ductile areas have been observed around the fibers (figure 5)). This phenomenon have also been observed in the case of high strain rate loading performed on thermoplastic composites [6]. These local deformations are distributed over the whole observed fracture surfaces and are mainly due to stress concentration around the fibers leading to a more intensive self-heating localized around the fiber-matrix interface.
During a fatigue test, the presence of the fiber creates heterogeneous stress and strain fields enhancing locally self-heating due to cyclic variations of the applied stress. Consequently, the cyclic variations are more intensive around the fiber. The average temperature consecutive to self-heating is higher around the fiber. This temperature gradient leads to a more clear failure in fatigue (figure 5(a)) than in the case of the tensile test performed at 90°C (figure 5(b)). 3.3.2. Quantitative analysis
Image analysis have been performed on the fracture surfaces. D is defined to be the diameter of the locally deformed area and d corresponds to the diameter of the considered fiber. In order to understand the influence of this local effect on the fatigue life, a statistical quantitative analysis relating the size of these micro-ductile areas to the maximum applied stress is proposed hereafter. Each measurement of D corresponds to average of 4 values. The evolution of the ratio D/d is plotted in figure 6 as a function of the maximum applied stress together with the number of cycle at rupture. The micro-ductile areas are observed for
maximum applied stresses ranging from 61 to 114 MPa. In this range, D/d decreases with the maximum applied stress.
(a) (b)
Figure 5. Apparition of micro-ductile areas around the fibers: (a) in the case of tension-tension fatigue test, (b)
in the case of a tensile test performed at 90°C.
1 1.5 2 2.5 3 3.5 4 1 10 100 1000 10000 100000 1000000 10000000 50 60 70 80 90 100 110 120 D /d N r (c yc le s) Stress (MPa) Wohler curve D/d
Figure 6. Evolution of the size of the micro-ductile areas as a function of the maximum applied stress.
When the composite is submitted to lower applied loads the whole specimen is firstly submitted to a quit uniform temperature consecutive to self-heating. However, at the microscopic scale, due to the concentration of stress, the micro-ductile zone around the fibers keep on developing (average D/d up to 3) over the whole volume of the specimen. Note that in this case, around 80% of the fracture surfaces show micro-ductile zones.
The stabilization of the thermal regime (plateau) appears to be a preliminary condition to the damage development over the whole volume of the specimen. When the temperature is macroscopically stabilized (horizontal plateau), the temperature rise is quit homogeneous and a diffuse damage can be developed. Final fracture occurs when micro-cracks appears at the external limit of the micro-ductile zone just before final fracture due to the coalescence of the microcracks. Finally, one can reasonably affirm that for the lower values of the applied stress, a balanced regime between mechanical fatigue and thermal fatigue is established. However, it should be noted that 80% of the fatigue life corresponds to the damage stage. However, for the very low levels of the applied stress, the material keeps in stabilized thermal regime. Damage and failure do not appear even after 107 cycles. In this range of applied stress (until 65 MPa), a small variation of the maximum applied stress produces a very high variation of the fatigue life.
When applying a medium level of stress, a competition between thermal and mechanical fatigue is observed. At the local scale, micro-ductile area are also observed around the fibers
with the same D/d ratio than for the lower applied stress. Self-heating does not succeed in reaching a stabilized thermal regime. One can affirm that, due to the relatively high level of the applied load, mechanical fatigue governs the final fracture.
Although in the microscopic scale we were able to observe the local effect of the self-heating, it remains relatively limited with values of D/d which do not exceed 2. The mechanical fatigue is dominant and quickly leads to the failure.
4. Conclusion
The multi-scale analysis presented in this paper leads to several conclusions :
1) fatigue life is strongly influenced by the contribution of both thermal fatigue (self-heating and plateau) and mechanical fatigue (damage),
2) long fatigue life (observed for the lower value of the maximum applied stress) is mainly due to damage development. Indeed, in figure 4(a), stage 3 corresponds to 75% of the fatigue life,
3) the establishment of a stabilized thermal regime (plateau) seems to be a preliminary condition to the development of a diffuse damage at the microscopic scale over the whole volume of the specimen,
4) increasing the maximum applied stress leads progressively to the total disappearance of stage 3 (damage) and stage 2 (plateau). Consequently, at intermediate values of the maximum applied stress, fatigue life is limited because of a competition between thermal and mechanical fatigue. At high values of the maximum applied stress, fatigue life is very limited. Mechanical fatique (damage) becomes predominant.
5) Self heating during fatigue tests occurs macroscopically but also microscopically through the development of local ductile deformation around the fibers. According to the good properties of the fiber-matrix interface and visco-plastic behavior of the matrix, the development of these micro-ductile deformation zones could be promoted as the level of applied load decreases accompanied of an established of a thermal regime. The facilitated damage delocalization leads to a more diffusing damage over the whole volume of the specimen and consequently to a better fatigue life of the composite.
References
1. A. Bernasconi, P. Davoli, D. Rossin, C. Armanni, Effect of reprocessing of fatigue strength of fiber glass reinforced polyamide, Composites Part A, 38: 710-718, 2007.
2. J. J. Horst and J. L. Spoormaker, Mechanism of fatigue in short glass fiber reinforced polyamide 6, Polym. Engin. Sci., 36: 2718-1726, 1996.
3. F. Cosmi, A. Bernasconi, Micro-CT investigation on fatigue damage evolution in short fibre reinforced polymers, Compos Sci Technol, 79, 70–76,2013.
4. M.F. Arif, N. Saintier, F. Meraghni, J. Fitoussi, Y. Chemisky, G. Robert, Multiscale fatigue damage characterization in short glass fiber reinforced polyamide-66, Composites Part B: Engineering, 61, 55-65, 2014.
[5] S. Barbouchi, V. Bellenger, A. Tcharkhtchi, Ph. Castaing, T. Jollivet, Effect of water on the fatigue behaviour of a PA 66/glass fibers composite materials, J. Mater. Sci., 42, 2181 -2188, 2007.
[6]. J. Fitoussi, M. Bocquet, F. Meraghni, Effect of the matrix behavior on the damage of ethylene–propylene glass fiber reinforced composite subjected to high strain rate tension, Compos Part B: Engineering, 45, Pages 1181-1191, 2013.