ÉCOLE DE TECHNOLOGIE SUPÉRIEURE UNIVERSITÉ DU QUÉBEC
THESIS PRESENTED TO
ÉCOLE DE TECHNOLOGIE SUPÉRIEURE
IN PARTIAL FULFILLEMENT OF THE REQUIREMENTS FOR THE DEGREE OF DOCTOR OF PHILOSIPHY
PH. D.
BY
Francis PELLETIER
POWER PERFORMANCE EVALUATION AND IMPROVEMENT OF OPERATIONAL WIND POWER PLANTS
MONTREAL, APRIL 4, 2014
This Creative Commons licence allows readers to download this work and share it with others as long as the author is credited. The content of this work can’t be modified in any way or used commercially.
BOARD OF EXAMINERS
THIS THESIS HAS BEEN EVALUATED BY THE FOLLOWING BOARD OF EXAMINERS
Mr. Christian Masson, Thesis Supervisor
Department of Génie Mécanique at École de technologie supérieure
Mr. Antoine Tahan, Thesis Co-supervisor
Department of Génie Mécanique at École de technologie supérieure
Mr. Simon Joncas, President of the Board of Examiners
Department of Génie de la production automatisée at École de technologie supérieure
Mr. Louis Lamarche, Member of the jury
Department of Génie Mécanique at École de technologie supérieure
Mr. Hussein Ibrahim, External Evaluator TechnoCentre éolien
THIS THESIS WAS PRENSENTED AND DEFENDED BEFORE A BOARD OF EXAMINERS AND PUBLIC
ACKNOWLEDGMENT
It goes without saying that a project of this scope could not have been completed without the precious collaboration of a number of individuals and companies.
Firstly, I would like to thank my director and co-director for their financial and technical support throughout this long endeavour. Without the confidence of my director Dr. Masson, this project would never have been completed. I also thank Dr. Masson for providing the opportunity to gain invaluable experience and contacts in the research sector. A special thanks to my co-director Dr. Tahan as well for always being there to answer my questions and for supporting me at every step of the elaboration of this project.
Several individuals from within various companies have also made this project possible. My sincere thanks to Martin Jetté of OSIsoft for the financial and priceless technical support he and all of his team offered. Thanks also to Normand Bouchard, Robert Guillemette, and all the technicians at Cartier, without whose help this project would not have been possible. Special acknowledgement goes to GL GH for its financial assistance and specifically to Bouaziz Ait-Driss and Dariush Faghani for the technical support they so graciously provided. Thanks to Philippe Giguère and Peter Gregg of GE for their support without which this project would have been unfeasible.
I also express my gratitude to the IT technicians (Mamadou Gueye, Martin Gauthier) at ETS for their great work in installing and maintaining the PI system. Martin Boulay from Ohméga and his team also provided vital assistance in the installation and follow-up of the PI system. I also thank all the trainees who supported me throughout this project.
Lastly and most importantly, I thank my partner Katia for her unconditional support, her trust and her complete confidence in me throughout this project. I am not able to thank her enough for giving us our two beautiful girls as well: Élia and Sofia. Thanks to my little girls for
POWER PERFORMANCE EVALUATION AND IMPROVEMENT OF OPERATIONAL WIND POWER PLANTS
Francis PELLETIER
RESUME
L’exploitation de centrales éoliennes à une échelle industrielle est plutôt récente. Avec cette nouvelle ère industrielle, les exploitants sont parfois enclins à appliquer à l’éolien les mêmes méthodes d’évaluation et d’amélioration de performance (économique, énergétique, environnementale, etc.) que celles utilisées pour leurs centrales électriques dites conventionnelles. L’évaluation de la performance énergétique est sans contredit le paramètre le plus étudié par les exploitants. La comparaison entre la production énergétique réelle d’une centrale (habituellement l’électricité) et l’apport énergétique nécessaire à cette centrale (ex. : charbon, pétrole, vent, etc.) permet d’évaluer sa performance énergétique. Cette évaluation ne représente habituellement pas un défi technique important pour les centrales dites conventionnelles. Cependant, la nature complexe du vent et de son interaction avec les éoliennes rend cette évaluation ardue et laborieuse pour le domaine éolien.
À l’heure actuelle, seule la norme CEI 61400-12-1 est acceptée par l’industrie. Cependant, cette méthode est onéreuse et permet l’évaluation de la performance énergétique d’une seule éolienne à la fois. De plus, l’utilisation de cette norme par l’industrie depuis plus de 15 ans a permis d’établir clairement ses limites d’applicabilité et sa précision relative, conséquence des hypothèses simplificatrices qui ont été retenues.
Le premier objectif de ce projet consiste donc à tenter d’améliorer les méthodes présentement utilisées pour l’évaluation de la performance énergétique des éoliennes et des centrales éoliennes en phase d’exploitation. Ainsi, l’élaboration d’un modèle à l’aide de réseau de neurones à six entrées (inputs) et selon une technique à plusieurs étapes a permis d’obtenir une modélisation minutieuse de la courbe de puissance de deux éoliennes. Les résultats de ce modèle ont été comparés à plusieurs autres techniques de modélisation et sa précision accrue a été démontrée pour les cas analysés.
Le deuxième objectif de ce projet consiste à tenter d’améliorer la production énergétique de projets éoliens déjà en exploitation. À la suite de l’identification d’un modèle affichant une précision accrue, des essais sur deux éoliennes en exploitation ont été réalisés sur une période de presque deux ans. La méthode choisie afin de tenter d’améliorer la production énergétique consiste à optimiser l’orientation des girouettes nacelles. Les résultats obtenus ont permis d’anticiper des gains énergétiques potentiels de l’ordre de 1% à 3 %.
l’acquisition d’une option d’amélioration de performance a fait appel à l’auteur de ce document afin de quantifier les gains énergétiques y étant associés. Une méthode de comparaison « Side-by-side » a été utilisée sur deux éoliennes ayant reçu l’option d’amélioration de performance. Divers tests statistiques ont été développés afin de quantifier les gains énergétiques ainsi que leur niveau de précision.
Mots clefs : éolienne, test de performance, amélioration de performance, réseau de neurone, erreur d’orientation, Girouette.
POWER PERFORMANCE EVALUATION AND IMPROVEMENT OF OPERATIONAL WIND POWER PLANTS
Francis PELLETIER ABSTRACT
The operation of wind farms on an industrial scale is relatively recent. With this new industrial era, wind farm operators are sometimes inclined to apply to wind the same methods of assessment and performance improvement (economic, energy, environmental, etc.) as those used for their so-called conventional power plants. The evaluation of energy performance is unquestionably one of the parameters most analyzed by operators. Energy performance can be evaluated by comparing the energy production of a plant (usually electricity) and the energy intake required for the said facility (e.g. coal, oil, wind, etc.). This assessment does not usually represent a significant technical challenge for so-called conventional plants. However, the complex nature of wind and its interaction with wind turbines makes this evaluation difficult for the wind energy sector.
At present, the IEC 61400-12-1 standard is the only method accepted by the industry and which allows the energy performance of a single turbine to be evaluated. However, this approach is relatively costly. Further, the application of this standard in the industry over the past 15+ years has clearly established a number of associated limits.
Thus, the first objective of this project was to try to improve current methods for assessing the energy performance of operational wind turbines and wind farms. In this context, the power curves of two wind turbines were able to be deducted by means of a model based on a neural network with six inputs and a multi-step technique. The results of this model were compared to several other modelling techniques and an increased accuracy was demonstrated for the cases analyzed.
The second objective of this project consisted of attempting to improve the performance of turbines already in operation. After developing a more accurate method for power performance evaluation, tests on two operational turbines were conducted. The method used in an effort to increase energy production was based on optimizing the orientation of the nacelle-mounted wind vanes. Tests were conducted to assess the effect of wind vane orientation on the energy performance and the results obtained suggested that potential energy gains in the order of 1-3% could be achieved.
Lastly, a number of findings from this project have been applied to various industrial projects in different contexts. Specifically, one wind farm owner has requested the services of the author to analyze the energy gain achieved pursuant to the installation of an improvement
turbines fitted with this improvement package. Statistical tests have been developed in order to properly assess and quantify the energy gain and the associated uncertainty level.
Key words : wind turbine, power performance testing, power performance improvement, artificial neural network, yaw error, yaw offset, wind vane.
TABLE OF CONTENTS
Page
INTRODUCTION ... 1
CHAPTER 1 LITERATURE REVIEW – POWER PERFORMANCE EVALUATION ... 7
1.1 Power Performance Evaluation Methods and Objectives ...7
1.1.1 Groups Involved in PPE of Individual WTGs and WPP ... 11
1.1.2 Current Methodologies for PPE of Individual WTGs ... 14
1.1.3 Shortfalls of Current Method ... 27
CHAPTER 2 POWER PERFORMANCE IMPROVEMENT – RESULTS FROM REVIEW OF LITTERATURE AND CONSULTATION ... 29
2.1 Definition and Objectives of Power Performance Improvement (PPI) ...29
2.2 Yaw Offset Optimization ...32
2.2.1 Context and Definitions ... 32
2.2.2 Literature Review... 35
CHAPTER 3 DATABASE DESCRIPTION AND IMPLEMENTATION ... 41
3.1 Database Architecture ...41
3.2 Archived Data ...43
CHAPTER 4 MODELLING OF POWER PERFORMANCE THROUGH ARTIFICIAL NEURAL NETWORKS ... 45
4.1 Description of ANN ...46
4.2 Learning Process and its Challenges...50
4.3 WTG Power Curve Modelling Using Artificial Neural Network ...54
4.3.1 Data Pre-processing ... 54
4.3.2 Modelling Inputs and Derived Parameters ... 55
4.3.3 Database Re-sampling ... 56
4.3.4 Cross-correlation Analysis ... 56
4.3.5 ANN Modelling Elaboration ... 58
4.3.6 Training of the ANN ... 59
4.3.7 ANN Model Validation ... 60
4.3.8 Results on Power Curve Comparison ... 62
4.3.9 Error Calculations for Each Wind Speed Bin ... 64
4.3.10 Weighted Error Calculations ... 67
4.4 Investigation on Air Density Impact ...68
CHAPTER 5 POWER PERFORMANCE IMPROVEMENT – TEST NO.1: YAW OFFSET OPTIMISATION ... 71
5.1 Context ...71
5.3.1 Define Objectives of the Test ... 77
5.3.2 Select Process Variables ... 77
5.3.3 Data distribution ... 78
5.3.4 Data Recoding ... 80
5.3.5 Select an Experimental Design ... 81
5.4 Testing Implementation ... 84
5.5 Results of IYO Testing ... 86
5.6 Analysis and Interpretation of Results ... 89
5.6.1 Similarities ... 89
5.6.2 Discrepancies Observed ... 90
5.7 Conclusion ... 91
5.8 Recommendations ... 94
CHAPTER 6 POWER PERFORMANCE IMPROVEMENT – TEST NO. 2 ... 97
6.1 Description of Test Site ... 97
6.2 Description of the Side-by-Side Methodology ... 98
6.3 Testing Results for Turbines WTG#3 and WTG#5 ... 100
6.3.1 Reference Period ... 100
6.3.2 Testing Period ... 101
6.3.3 Data Quality Control ... 101
6.4 Comparison with Other Performance Testing Methods ... 109
6.5 Conclusion ... 113
CONCLUSION ... 115
ANNEX I ALIGNMENT SYSTEM AND METHOD, E.G. FOR WIND TURBINES (PATENT, US 61/720,145) ... 119
ANNEX II TESTED INPUTS FOR ARTIFICIAL NEURAL NETWORK MODELLING ... 121
ANNEX III VALIDATION OF THE NACELLE WIND SPEED TRANSFER FUNCTION ... 125
ANNEX IV DATA DISTRIBUTION ... 127
ANNEX V STATISTICAL TEST RESULTS FOR THE SIDE-BY-SIDE COMPARISON ... 133
ANNEX VI UNCERTAINTY ANALYSIS OF THE SIDE-BY-SIDE TESTING .... 141
LIST OF TABLES
Page
Table 1-1 Normalization institutions involved in PPE of WTGs or WPP ...11
Table 1-2 Research groups involved in PPE of WTGs or WPP ...12
Table 1-3 Parametric methods ...25
Table 1-4 Non-parametric methods ...26
Table 2-1 PPI methodologies based on availability improvement ...31
Table 2-2 PPI methodologies for WTGs during periods of availability ...31
Table 2-3 Estimated yaw offset distribution (1σ) ...37
Table 4-1 Data set description for WTG#1 and WTG#2 ...55
Table 4-2 Training algorithm and stopping criteria ...60
Table 5-1 Comparison of current testing and Madsen test (1999) ...72
Table 5-2 Data distribution ...79
Table 6-1 Reference period start and end dates ...101
Table 6-2 Testing period start and end dates ...101
Table 6-3 AEP gain evaluation ...107
Table 6-4 AEP gains and associated uncertainty levels ...109
Table 6-5 Nacelle power curve (without statistical tests, wake included) ...109
Table 6-6 Nacelle power curve (without statistical tests, wake excluded) ...110
Table 6-7 Nacelle power curve (with statistical tests (alfa=0.5), wake included) ...110
Table 6-8 Nacelle power curve (with statistical tests (alfa=0.5), wake excluded) ...111
Table 6-9 Side-by-side (without statistical tests, wake included) ...111
Table 6-12 Side-by-side (with statistical tests (alfa=0.5), wake excluded) ... 112 Table 6-13 Summary of energy gains ... 114
LIST OF FIGURES
Page
Figure 0-1 Quebec installed and projected wind power plants (Obtained from TCE, 2012) ...1
Figure 1-1 Power coefficient for different wind turbine types ...8
Figure 1-2 Typical wind turbine power curve ...9
Figure 1-3 WTG power curve procedure in flat terrain (Pelletier, 2007) ...16
Figure 1-4 WTG power curve procedure in complex terrain (Pelletier, 2007) ...17
Figure 1-5 Typical effect of turbulence on power curve (Kaiser et al., 2003) ...19
Figure 1-6 Influence of topography and obstacles on vertical wind speed distribution (Obtained from Bailey, 1997) ...20
Figure 1-7 Influence of surface roughness on vertical wind speed distribution (Obtained from Berlin, 2007) ...21
Figure 1-8 Influence of atmospheric stability on vertical wind speed distribution (Alinot et al., 2002) ...21
Figure 2-1 Wind Turbine nacelle and yawing system ...33
Figure 2-2 Perfect alignment of wind vane with nacelle centre line ...34
Figure 2-3 Yaw error (dynamic) ...34
Figure 2-4 Yaw offset (static) ...35
Figure 2-5 Power vs. yaw error: measured and calculated relative power ...36
Figure 2-6 Romo’s spinner anemometer...38
Figure 3-1 Architecture of database ...41
Figure 3-2 Layout – Site no. 1 ...42
Figure 3-3 Layout – Site no. 2 ...42
Figure 4-1 General neuron model ...46
Figure 4-4 Recurrent single-layer network ... 48
Figure 4-5 Feed-forward multilayer neural network (multilayer perceptron (MLP)) ... 49
Figure 4-6 Example of a modelling function with overfitting ... 50
Figure 4-7 Function approximation (in red) with 1, 4, and 50 neurons ... 52
Figure 4-8 Impact of the quantity of data sampling on overfitting ... 52
Figure 4-9 Early stopping (Asension-Cuesta et al., 2010) ... 53
Figure 4-10 Typical example of cross-correlation graphics for 3-4 m/s bin (Site 1) ... 57
Figure 4-11 MLP Topology ... 58
Figure 4-12 ANN training stages methodology ... 59
Figure 4-13 Multi-stage evaluation process ... 60
Figure 4-14 Impact on power curve and power coefficient ( ) ... 62
Figure 4-15 Wind turbine power curve modelling ... 63
Figure 4-16 Mean Error (ME) for each normalized wind speed bin (Site 1) ... 66
Figure 4-17 Mean Absolute Error (MAE) for each normalized wind speed bin (Site 1) ... 66
Figure 4-18 Modelling error calculations for WTG#1 ... 67
Figure 4-19 Modelling error calculations for WTG#2 ... 67
Figure 4-20 Air density correction ... 69
Figure 5-1 Top view of a clockwise-rotating turbine with negative (left) and positive (right) yaw error ... 73
Figure 5-2 Angle nomenclature ... 75
Figure 5-3 10-minute average wind deviation ( ) distribution for WTG#1 ... 76
Figure 5-4 Variables used in model ... 78
Figure 5-5 Air density scaling value ( 1.15 ≥ ≤ 1.34 ) ... 80
Figure 5-6 Probability of occurrences for the first testing period ... 82
Figure 5-8 Probability of occurrences for the two testing period ...83
Figure 5-9 WTG#1 scatter plot before (blue) and after (red) 2011 ...84
Figure 5-10 Nacelle instrumentation pre- (left) and post- (right) installation of sonic anemometer ...85
Figure 5-11 WTG no.1 – Project Schedule ...86
Figure 5-12 WTG no.2 – Project Schedule ...86
Figure 5-13 Nacelle wind speed transfer function ...87
Figure 5-14 WTG#1 – PFn vs. IYO ...88
Figure 5-15 WTG#2 – PFn vs. IYO ...89
Figure 5-16 Monte Carlo results for the distribution of three levels of accuracy in wind vane alignment ...92
Figure 5-17 WTG#1 – energy gain at different IYO values and levels of accuracy ...93
Figure 5-18 WTG#2 – energy gain at different IYO values and levels of accuracy ...93
Figure 6-1 Zoom of wind farm layout showing turbines relevant to analysis ...98
Figure 6-2 Valid wind direction sectors (white) – WTG#3 and WTG#4 ...102
Figure 6-3 Valid wind direction sectors (white) – WTG#5 and WTG#6 ...102
Figure 6-4 WTG#3 vs. WTG#4 ...103
Figure 6-5 WTG#5 vs. WTG#6 ...104
Figure 6-6 Results of side-by-side comparison including statistical testing of each power bin – WTG#3 & WTG#4 ...105
Figure 6-7 Results of side-by-side comparison including statistical testing of each power bin – WTG#5 & WTG#6 ...106
LIST OF ABREVIATIONS AEP Annual Energy Production
ANN Artificial Neural Network
GUM Guide to the Expression of Uncertainty IEC International Electrotechnical Commission IYO Imposed Yaw Offset
LIDAR Light Detection and Ranging
MLP Multi-layer Perceptron
O&M Operation and Maintenance
PF Power Factor
PFn Normalized Power Factor
PPA Power Purchase Agreement PPE Power Performance Evaluation PPI Power Performance Improvement SODAR Sonic Detection and Ranging
TCE TechnoCentre éolien
WPP Wind Power Plant
LIST OF SYMBOLS Coefficient of performance
IYO Imposed Yaw Offset [o] P Active power output [kW]
Estimated power output from the multi-stage ANN model [kW]
PF Power Factor
PFn Normalized Power Factor
Rotor Radius [m]
TI Turbulence Intensity [%]
WS Wind shear (V80m/V40m)
WD Nacelle orientation [deg]
Instantaneous free stream wind speed [m.s-1] 10-minute average wind speed [m.s-1] V 10-minute nacelle wind speed [m.s-1]
V40 10-minute average wind speed at 40m agl [m.s-1] V80 10-minute average wind speed at 80m agl [m.s-1]
Air density normalized wind speed [m.s-1] λ Tip speed ratio
Air density [kg.m-3]
Reference air density [kg.m-3]
10-minute standard deviation of wind speed [m.s-1]
Angle given by the anemometer, also referred as the wind deviation [o] Nacelle orientation angle compared to true north [o]
Φ Wind direction angle compared to true north [o] Φ Yaw Offset angle [o]
INTRODUCTION Context
Though the generation of wind energy on an industrial scale has been around for several decades, Wind Power Plants (WPP) with installed capacities of more than 100 MW are relatively new, but have been becoming more common in recent years. The objectives established in the framework of the Government of Quebec’s energy policy (2006-2015) with regard to wind energy are an illustration of this trend. Indeed, Quebec has established an objective of installing 4,000 MW of wind capacity by the end of 2015. Once in operation, this figure will represent close to 10% of the nominal power output of Hydro-Québec’s production capacity. Similar examples of energy policies with high levels of penetration for wind energy can be found in all other Canadian provinces and around the world. Figure 0-1 presents the wind capacity built to date and projected (i.e. with signed Power Purchase Agreements (PPA)) in Quebec (Technocentre Éolien, 2012).
Figure 0-1 Quebec installed and projected wind power plants (Obtained from TCE, 2012)
In this new context and because the profitability of wind assets is subject to very tight margins, wind farm operators are now paying attention to elements that were not considered significant just a few years ago. Likewise, owners are increasingly interested in investigating new avenues that could optimize their return on investment. New methods, research, tools or services that were not economically viable in the past are now beginning to emerge.
Numerous modern studies (Bell, 2008; Kragh, 2013; Randal, 2008) and even recent specifically dedicated conferences (Wind Farm Underperformance & Partnerships
Conference, Texas 2012) suggest that operational wind power plants typically exhibit
potential for power performance improvement in the order of 1-2% over current output. A good comprehension and improved control of the power performance evaluation (PPE) of the wind assets is therefore crucial to understanding the actual energy inefficiencies and to ensure that proposed mitigation methods are conveniently developed, analyzed, implemented and that their published benefits are valid.
In light of the increased interest of wind farm owners and operators in this field, and because this study is fundamentally focused on improving current methodologies for evaluating and improving power performance outputs of wind assets, several technical and financial partners have agreed to participate in this project.
Technical Challenges and Background
Despite the importance of PPE and the fact that a number of working groups and researchers have been conducting studies in this area for several years, the most widely used methodology, IEC61400-12-1 (International Electrotechnical Commission, 2005), has typically shown an uncertainty level in the order of 5-8% (Pedersen et al., 2002). Although several attempts have been proposed in order to decrease this level of uncertainty (through turbulence intensity normalization (Albers, 2010), wind shear and veer (Wagner, 2010), and numerous other methodologies (Albers, 2004; Anahua et al., 2008; Antoniou et al., 2007; Llombart et al., 2005a; Llombart et al., 2005b; Montes et al., 2009), the level of uncertainty is still typically greater than the 1-2% presented earlier.
The i) stochastic nature of the wind combined with the fact that today’s wind turbine rotors are significantly larger than those of the past (>100 m in diameter), ii) the fact that only one wind speed measurement point (at hub height) is generally considered, and iii) the non-linear relationship of power as a function of wind speed or other meteorological variables are all elements that, when combined, represent an important challenge in achieving a proper PPE of individual wind turbines and especially of an entire WPP. This poor level of precision of current PPE techniques renders the detection of underperformance and the evaluation of efficiency improvement measures difficult or unreliable.
Objectives and Methodologies
This study has two main objectives: i) to improve current PPE techniques for individual wind turbines, and ii) to demonstrate a potential improvement in the Annual Energy Production (AEP) of the wind assets under study. Ideally, this increase in AEP would be in the order of 1% or more.
The first objective will mainly focus on the techniques for the PPE of individual WTGs. To date, only the project team PT 61400-12-3 from the IEC Technical Committee 88 (TC 88 / PT 61400-12-3) (TC88WG6, 2004) has proposed to publish a Technical Specification (TS) that will detail a procedure for power performance testing of an entire WPP. This technical specification has not yet been issued nor has the date of publication been determined. Furthermore, no official verification using this proposed methodology has been completed for large WPP located in complex terrain, meaning that the uncertainty level of this method is still unknown. Consequently, PPE for the vast majority of new, large WPP can only be accomplished using partial methodologies, each with their own technical and commercial shortcomings. For this reason, it has been decided that PPE of individual wind turbines would be more relevant in that modelling the behaviour of an individual WTG would be more easily achievable than that of an entire WPP. Additionally, if a significant increase in the precision of a prediction is found through the PPE of individual WTGs, it is expected that by extension this improvement could be applied to an entire WPP.
This first objective will be achieved through testing and comparison of several power performance modelling techniques (old and novel) for wind turbines. In order to do so, real operational data of existing wind turbines will be used. The standard modelling process – data normalization, recoding, reduction and linearization, modelling elaboration, modelling validation (residual analysis) – will be used for this part of the study. Models will be compared by quantifying the error levels of each model.
The second objective will consist of identifying and testing concrete novel methodologies that will increase the energy output of the WTGs under study. This objective will mainly focus on the identification, installation, testing and assessment (through statistical tests) of techniques/methods that would contribute to an increase in AEP. Emphasis will be made on techniques that could be applied to individual WTGs. Ideally, the power performance improvement of the proposed methodology or methodologies would enable an increase in AEP of approximately 1% or greater.
Further, in order to achieve the second objective, a thorough review of literature will be completed and a steering committee will be created in order to identify the most realistic method that could be used in the context, timeframe and logistic possibilities of the actual study. Once such a method has been proposed to and approved by the turbine manufacturer and the wind farm owner, it will be implemented on two selected WTGs. Optimal models developed in the context of the first objective will be used in the pursuit of this second objective in order to perform a continuous monitoring and statistical assessment of the level of improvement of the proposed method.
Thesis Organization
This dissertation is presented in several chapters. Chapter 1 will present a concise review of literature with regard to current methods used for PPE of individual WTGs.
Chapter 2 will present the review of literature and the recommendations received from the steering committee with regard to current methods used for Power Performance Improvement (PPI).
Chapter 3 describes the database provided and installed specifically for this project, which is the foundation for the entire study (and future studies of the Research Laboratory on the
Nordic Environment Aerodynamics of Wind Turbines, NEAT).
Chapter 4 presents all the steps required to develop a novel technique for modelling WTG power curves, i.e. modelling through Artificial Neural Networks (ANN). The results of this model will be compared with those of discrete, parametric, and non-parametric models.
Chapter 5 and Chapter 6 provide the results obtained using the author’s methodology (through ANN) and the Side-by-side methodology for two case studies: i) improvement of AEP through yaw offset optimization and ii) improvement of AEP through aerodynamic component and control algorithm changes.
Lastly, a brief overview of a patent developed during the elaboration of this project is presented in Annex I. This patent enables the in-situ calibration of a nacelle-mounted wind vane with a proper degree of accuracy.
CHAPTER 1
LITERATURE REVIEW – POWER PERFORMANCE EVALUATION
The present section presents the succinct results of an extensive review of literature of all available techniques for the PPE of individual WTGs.
1.1 Power Performance Evaluation Methods and Objectives
The theoretical power that can be extracted by a WTG from the wind is expressed by Equation (1.1):
=1
2 (1.1)
where: is the theoretical power captured by the rotor of a given WTG is the air density
is the radius of the rotor is the power coefficient is the wind speed.
, and all have a significant impact on wind turbine power output. Of these, modelling and is particularly challenging in that – unlike air density which remains generally constant over a WTG’s rotor-swept area – the power coefficient and wind speed can vary substantially across this zone.
Betz (1919) demonstrated that the hypothetical maximum ratio of energy that can be extracted from a given volume of air in movement corresponds to 16/27. This means that the most efficient wind system could extract only 59% of the theoretical kinetic energy. This value corresponds to what is known as the optimal coefficient of performance ( ).
Figure 1-1 illustrates the value for different types of WTGs as a function of the tip speed ratio ( ), where:
= = (1.2)
Figure 1-1 Power coefficient for different wind turbine types
As can be seen from Figure 1-1, high-speed two- or three-bladed turbines are the most efficient turbines in terms of extracting energy.
While the is a very good indication of a WTG’s performance, the wind industry has developed another metric that is more practical and intuitive to use for power performance evaluation: the power curve. The power curve of a WTG shows the net active power output
(in kW) as a function of wind speed measured at hub height (in m/s). Figure 1-2 provides an example of a typical wind turbine power curve (the red line).
Figure 1-2 Typical wind turbine power curve
The scatter plot depicted in Figure 1-2 is composed of gray dots which represent all 10-minute averaged wind speed and power output data for a typical wind turbine. The red line is referred to as the power curve of a wind turbine. The power curve is obtained by averaging wind speed and power bins (gray dots) which are generally 0.5 m/s wide.
As can be seen from the power curve depicted in Figure 1-2, the expected value of power output has a non-linear relationship with wind speed, i.e. it is not proportional to . In Zone I this is mainly due to the fact that that WTGs require a minimum wind speed – referred to as the cut-in wind speed – in order to begin producing energy. Zone I in Figure 1-2 represents the wind speeds which are insufficient for energy production. In Zone II this non-linear
I II III IV
Hub Height Wind Speed [m/s]
Po wer O utp ut [k W] Power Curve Nominal Power Output Nominal Wind Speed Cut-in Wind Speed Cut-out Wind Speed
character is due to the fact that once a turbine has begun to generate energy, power output is mostly proportional to the cube of the wind speed ( ). The first part of this zone is mainly driven by the search of the optimal efficiency (maximum extraction of power output). As the wind speed increases, the turbine needs to regulate the power output in order to protect the WTG’s components. At a certain wind speed threshold, the power output is kept constant in order to protect the integrity of the wind turbine equipment. This is known as the nominal wind speed and power. The turbine limits its power throughout Zone III until higher wind speeds induce loads too severe on the turbine and it needs to be shut down. The end of Zone III corresponds with the cut-out wind speed. Beyond the cut-out wind speed (Zone IV) the turbine does not produce energy, but rather remains at a standstill in order to protect itself. It will restart only when the wind speed falls low enough to ensure the structural integrity of the WTG.
The technical and commercial rationale for using a power performance verification strategy based on comparison of WTG power curves – as mentioned by WPP owners or wind energy industry consultants – are numerous and can be summarized as follows:
I. General performance follow-up (Pelletier, 2007),
II. Identification of areas where performance could be improved (Harman et al., 2003; Pelletier, 2007),
III. Identification of changes in power performance (e.g.: pitch control malfunction, blade damage/fouling, control problems, aerodynamic enhancements, etc.) (Harman et al., 2003),
IV. Quantification of discrepancies between actual and forecasted energy production (Graves et al., 2007; Klug, 2007),
V. Diagnosis where production does not meet expectations (Harman et al., 2003), VI. Improvement and maximization of power plant performance (Pelletier, 2007), VII. Warranty verification and negotiation (Pelletier, 2007),
VIII. Failure and fault analysis (losses, diagnosis and solution) (Pelletier, 2007),
IX. Minimization of uncertainty in long-term forecast (Graves et al., 2007; Harman et al., 2003; Klug, 2007),
X. Maximization of power plant value (Graves et al., 2007; Klug, 2007),
XI. (Re)evaluation of projects for (re)financing (Harman et al., 2003; Pelletier, 2007). The more precise the PPE methods are, the more easily the PPI objectives will be achievable, hence showing the importance of improving these methods. The following section will summarize the various groups involved in the improvement of these methods and the techniques that have been applied to date.
1.1.1 Groups Involved in PPE of Individual WTGs and WPP
Before providing the results of the review of literature and in order to give a general view of the main groups involved in PPE, Table 1-1 and Table 1-2 summarize the major groups or institutions that have been involved in PPE of individual WTGs or WPP. For clarity purposes, these groups will be presented in two separate tables, namely normalization institutions and research groups.
Table 1-1 Normalization institutions involved in PPE of WTGs or WPP
International Electrotechnical Commission (IEC)
The IEC is an organization that prepares and publishes international standards for all electrical, electronic and related technologies. The IEC has developed a series of standards for WTG systems. More specifically related to this work, the IEC has developed the IEC 61400-12-1 (International Electrotechnical Commission, 2005) standard entitled: Power
performance measurements of electricity producing wind turbines. This standard is the most
widely recognized and used standard in the wind industry. For this reason, further details of this standard will be given in the subsequent sections.
International Energy Agency (IEA)
The International Energy Agency (IEA) acts as energy policy advisor to 27 member countries in their effort to ensure reliable, affordable and clean energy for their citizens. The
IEA Wind agreement sponsors cooperative research tasks and provides a forum for international discussion of research and development issues. For this reason, many publications and work related to wind technology have been presented under the IEA group.
The international Measuring Network of Wind Energy Institutes (MEASNET)
MEASNET represents a collaboration of institutes which are engaged in the field of wind energy and which strive to ensure high quality measurements, uniform interpretation of standards and recommendations as well as interchangeability of results. In this context, MEASNET has developed four procedures related to wind technology: Cup Anemometer
Calibration Procedure, Acoustic Noise Measurement Procedure, Power Quality Measurement Procedure, and Power Performance Measurement Procedure. With respect to
the latter, it is only quite recently that the MEASNET group has adopted (without modification) the latest version of the IEC61400-12-1.
Canadian Standard Association (CSA)
The Canadian Standard Association is a not-for-profit membership-based association that develops standards to enhance public safety and health for multiple areas of expertise. In the 1980-90s, the CSA developed several standards related to renewable energy. The standard entitled Wind Energy Conversion Systems (WECS) – Performance (CSA-F417M91) was specifically dedicated to the power performance evaluation of wind turbines. Recently however, the CSA adopted without modification the IEC Standard 61400-12-1.
Table 1-2 Research groups involved in PPE of WTGs or WPP
Risø National Laboratory
The Risø National Laboratory from the Technical University of Denmark (DTU) carries out scientific and technical research on society and systems, wind energy, fuel cells and hydrogen, bioenergy, emerging energy technologies and nanobiotechnology. With more than a thousand publications specifically dedicated to wind energy, Risø is inarguably one of the predominant research groups worldwide dedicated to wind energy.
following section dedicated to this standard will present the institute’s findings and suggestions. A list of all Risø’s publications related to wind energy can be found at: http://www.risoe.dk/Risoe_dk/Home/Knowledge_base/publications/VEA.aspx
National Renewable Energy Laboratory (NREL)
The National Renewable Energy Laboratory (NREL) is the primary US laboratory for renewable energy and energy efficiency research and development (R&D). With more than 60 staff and numerous publications related to wind energy research, NREL is an important research group in the wind industry. A list of its publications can be found at: http://www.nrel.gov/wind/publications.html.
Energy research Centre of the Netherlands (ECN)
The aim of ECN Wind Energy is to contribute to the realization of both national and international targets for wind energy through:
I. Long-term R&D work that aims to increase the value-cost ratio of wind energy; II. Removal of technical barriers for the implementation of wind power,
particularly for large-scale wind power plants;
III. Technical assistance for innovative wind energy projects and solutions to technical problems.
ECN has presented several papers related to power performance evaluation of wind turbines (see http://www.ecn.nl/en/wind/publications/).
Centro Nacional de Energías Renovables (CENER)
The Centro Nacional de Energías Renovables (CENER) is a technical centre specialized in the applied research and development of renewable energies. CENER’s wind department is mainly involved in applied R&D related to wind energy. Three main areas of research have been identified by CENER:
I. Evaluation of wind potential and wind farm design, II. Wind turbine certification,
Wind Energy Institute of Canada (WEICan)
The WEICan institute was founded 25 years ago with the objective of advancing the development of wind energy through research, testing, innovation, and collaboration. WEICan’s location at North Cape, Prince Edward Island with 300° exposure to the Gulf of St. Lawrence is unique and offers a number of characteristics which make it an ideal site for conducting research on wind turbine operations in Nordic conditions, namely:
I. IEC Class 1 wind resource with relatively low turbulence, II. A harsh marine environment with high corrosion rates, III. Icing events during winter months,
IV. Large winter/summer temperature differences.
Site nordique expérimental en éolien CORUS
The TechnoCentre éolien owns an experimental wind energy site, the Site nordique expérimental en éolien CORUS (SNEEC) that features two REpower wind turbines, two 126 m wind measurement masts, a LIDAR (Light Detection and Ranging) unit and a microgrid. Located at an elevation of 350 m in Rivière-au-Renard (Quebec, Canada) this research centre is mainly focused on the impact of icing and complex terrain on wind turbine performance.
Though several other groups worldwide have been involved to varying degrees in wind turbine PPE, the preceding table presents the most renowned and influential groups in this area of research.
1.1.2 Current Methodologies for PPE of Individual WTGs
This section presents the results of a literature review on the different approaches used to estimate the power output of a given WTG. These methods fall into four fundamentally different categories of approaches:
I. Discrete (mainly IEC method), II. Parametric,
IV. Stochastic.
The following sections describe each of the above-listed types of PPE methods, their advantages and disadvantages, as well as the techniques associated with each approach.
1.1.2.1 Discrete Methods
Discrete methods consist of modelling a continuous process with discrete approximations. The IEC61400-12-1 (IEC-12-1) (International Electrotechnical Commission, 2005) and IEC61400-12-2 (IEC-12-2) (International Electrotechnical Commission, 2012) standards use this type of method. In these standards, all wind speeds are classed in 0.5 m/s bins. Power output is then modelled according to these discrete inputs. The general steps proposed by the IEC standard can be summarized as follow:
I. Installation of a meteorological mast with anemometer, wind vane, temperature and pressure sensors at hub height and at a distance between 2 and 4 rotor diameters of the tested wind turbine;
II. When the turbine to be tested is located in a complex terrain (see Annex B of IEC-12-1), a systematic difference in wind speed between the position of the meteorological mast and the centre of the turbine can be found. Prior to wind turbine installation, a site calibration will be required by means of a second (temporary) meteorological mast in order to establish flow correction factors for all wind measurement sectors;
III. Once the turbine installation has been completed (including installation of power measurement devices), the simultaneous collection of wind speed, power output, temperature, and pressure can begin. Data shall be collected continuously at a sampling rate of 1 Hz or higher. The mean (10-minute averages), standard deviation, maximum and minimum values for all measured parameters shall be stored in a database;
IV. Once the database is considered complete, data should be analyzed per the following steps:
A. Quality control of the recorded data (meteorological data, electrical data, turbine and data acquisition system availability),
B. Correction of wind speeds according to the flow correction factors obtained during the site calibration (for complex sites only),
C. Data normalization to account for air density impacts on power curve, D. Power curve elaboration using the “bin method”,
E. Calculation of the AEP by referencing the measured power curve with a reference wind speed frequency distribution, assuming 100% availability, F. Evaluation of Type A and B uncertainties (As defined in GUM, 2008).
Figure 1-3 and Figure 1-4 schematically present the major steps required for the elaboration of a WTG power curve located in flat or complex terrain.
Figure 1-3 WTG power curve procedure in flat terrain (Pelletier, 2007)
Figure 1-4 WTG power curve procedure in complex terrain (Pelletier, 2007)
The IEC-12-2 (International Electrotechnical Commission, 2012) method is very similar to the standard IEC-12-1 with the difference being that instead of taking the wind speed data from a met mast, such data are collected using nacelle anemometry. As the nacelle, rotor and surrounding topography can affect the wind speed read by the nacelle anemometry; this standard requires a site calibration prior to turbine installation in order to establish a correlation between the wind speeds at the permanent met mast and the future location of the turbine.
In these PPE techniques, wind speed at hub height and air density are implicitly considered the only relevant input (independent) variables; power is the output (dependent) variable. Frandsen (Frandsen et al., 2000) and Albers (Albers et al., 2007), amongst others, mention that other parameters could significantly affect the power curve evaluation if not taken into account. According to the said authors, the secondary variables which affect the power curve evaluation are:
I. Turbulence intensity, II. Vertical wind shear, III. Atmospheric stability, IV. Inclined wind speed.
Furthermore, IEC is aware of the limitations of its proposed methodology as mentioned in its introduction: “Meanwhile, a user of the standard should be aware of differences that arise
from large variations in wind shear and turbulence, and from the chosen criteria for data selection. Therefore, a user should consider the influence of these differences and the data selection criteria in relation to the purpose of the test before contracting the power performance measurements.”
Since Frandsen’s report, several investigations have been completed related to the shortcomings of the IEC-12-1 (referred to as IEC61400-12 before 2005) standard. The following sections summarize the limitations of the IEC-12-1 standard as found in the literature.
1.1.2.1.1 Turbulence Intensity
Turbulence intensity ( ) depends on a number of site-specific conditions and has a wide range of variation. It is related to the standard deviation of the wind speed and can be expressed as follows:
= (1.3)
where is the standard deviation of the 10-min wind speed of a data sample is mean wind speed in the 10-min data sample
According to theoretical studies and experiments (Albers et al., 2007; Frandsen et al., 2000), it can be concluded that i) a clear increase in power output with increasing turbulence intensity (approximately 1-2% increase in around the maximum ) in the transition from zone I and zone II and, ii) a decrease in power output with increasing turbulence intensity in the transition region to rated power (transition between zone II and III) were apparent. Similar results have been reported in previous studies conducted by (Honhoff, 2007; Kaiser et al., 2003; Radecke, 2004). Figure 1-5 shows the impact of turbulence intensity on the power curve.
Figure 1-5 Typical effect of turbulence on power curve (Kaiser et al., 2003)
With the objective of producing power curves that are both repeatable and independent of the turbulence intensity characteristic, several authors (Kaiser, Albers, etc.) have proposed different adjustment methodologies.
For example, Kaiser (Kaiser et al., 2003) used the Taylor series expansion in order to linearize the relationship between the power output of a turbine and the incident turbulence intensity at hub height. Albers (Albers et al., 2007) proposes a normal distribution model in order to correct for the 10-minute averaging impact on the power curves. More recently,
Albers (Albers, 2010) improved his method and has been able to obtain a complete turbulence normalization procedure. This procedure will probably be incorporated in the next issue of the IEC-12-1 standard. The method proposed by Albers mainly assumed the existence of a “zero turbulence” power curve. This zero turbulence power curve represents the power output of a given WTG type assuming no turbulence at all (i.e. no variation of wind speed with time). Once this equivalent power curve is obtained, all 10-minute data points can be recalculated for normalized turbulence intensity.
1.1.2.1.2 Vertical Wind Shear (vertical wind speed distribution)
Vertical wind shear can be defined as the distribution of the wind speed as a function of height above ground level. In general, wind shear is influenced by a combination of three main factors:
I. Surrounding topography and obstacles, II. Surrounding surface roughness,
III. Atmospheric stability.
Figure 1-6 through Figure 1-8 present simplified examples of each of these three causes of wind speed gradient with height.
Figure 1-6 Influence of topography and obstacles on vertical wind speed distribution (Obtained from Bailey, 1997)
Figure 1-7 Influence of surface roughness on vertical wind speed distribution (Obtained from Berlin, 2007)
Figure 1-8 Influence of atmospheric stability on vertical wind speed distribution (Alinot et al., 2002)
In the IEC-12-1 standard, it is assumed that the hub height wind speed is representative of the wind over the entire rotor. While this assumption was adequate for wind turbines with small rotor diameters, in the case of newer turbines with large rotor diameters (up to 100 m), it is now assumed that wind speed variation within the rotor swept area will influence power production.
Theoretical models (Sumner et al., 2006) have been used to evaluate the impact of wind shear on the power performance of wind turbines. These models have systematically demonstrated that for similar hub height wind speeds, wind shear does influence the power output of wind turbines.
Experimental results (Albers et al., 2007; Antoniou et al., 2007; Bunse et al., 2008; Honhoff, 2007; Hunter et al., 2001) have also demonstrated the impact of wind shear on the power performance of wind turbines. Antoniou (Antoniou et al., 2007), using a 160 m tower, shows that using an increased number of wind speed measurement points significantly improves the correlation between wind input and power output. More recently, (Wagner et al., 2010a) has demonstrated the same, by using a LIDAR (Light Detection And Ranging) that is able to read the wind speed profiles higher than hub height.
1.1.2.1.3 Inclined Wind Speed
Inclined wind speed angle is evaluated by comparing the angle between the wind flow and the wind turbine shaft axis. Because there is a clear linear relationship between the angle of terrain slope and the flow inclination angle (Hannah, 1997), it is evident that wind turbines located in complex terrain will be exposed to inclined wind speed.
Pedersen (Pedersen, 2004; Pedersen et al., 2002) has demonstrated that vertical flow angle to the wind turbine rotor axis seems to influence power by a cos2 relationship.
1.1.2.1.4 Cup Anemometer Characteristics
Risø National Laboratory (Pedersen et al., 2002) has clearly demonstrated that different cup anemometers show different angular responses to inclined wind speed. Risø National Laboratory has also shown that dynamic over-speeding also varies with different anemometer brands under identical turbulence levels. This report concludes with suggestions for anemometer classification according to their turbulence response and angular characteristics.
Furthermore, ECN (Curvers et al., 2001) has found that average wind speeds measured with different types of cup anemometers may deviate by >7% relative to each other. This would have significant repercussions on the results when estimating the power curve of a wind turbine.
It is generally suggested that power curve comparison should be completed with the same type of anemometers in order to avoid any of these issues. The IEC standard clearly cautions users in this regard:
“A key element of power performance testing is the measurement of wind speed. This
standard prescribes the use of cup anemometers to measure the wind speed. This instrument is robust and has long been regarded as suitable for this kind of test. Even though suitable wind tunnel calibration procedures are adhered to, the field flow conditions associated with the fluctuating wind vector, both in magnitude and direction will cause different instruments to potentially perform differently. Tools and procedures to classify cup anemometers are given in Annexes I and J. However, there will always be a possibility that the result of the test can be influenced by the selection of the wind speed instrument. Special care should therefore be taken in the selection of the instruments chosen to measure the wind speed.”
1.1.2.1.5 Yaw Error
According to Beattie (Beattie, 2001), the general trend is for power curves to decrease in magnitude as wind direction variability increases. This is expected since it is generally
accepted that the power of a turbine changes with the cos2 of the angle between the wind direction and the turbine’s orientation. Further details about yaw error will be provided in section 2.2.2.
1.1.2.1.6 Icing / Insects / Dust
Icing, insects and dust are all known to reduce the power performance of a wind turbine (Honhoff, 2007). Some studies have been conducted in order to evaluate the loss associated with each of these. Unfortunately, no clear relationship between these events and the impact on the power output has been properly established to date. For this reason, it is general practice to not take these events into consideration when analyzing the performance of wind turbines or WPP.
1.1.2.2 Parametric Methods
Parametric models are built from a set of mathematical equations that include parameters that must be adapted through a set of continuous data. Parametric methods generally use linear, non-linear, polynomial or differential equations, amongst others. The parameters present in these equations are generally determined through standard regression methods such as error minimization and maximum-likelihood, to name a few. Numerical methods can also be used to establish the parameter’s value. The shape of the wind turbine power curve has inspired some authors in their choice of parametric models.
Table 1-3 provides a summary of techniques or functions that have been tested by several authors to evaluate the power curve of a WTG.
1.1.2.3 Non-parametric Methods
With the recent arrival of powerful database tools that can be used to archive tremendous amounts of data, new modelling methods have emerged. Instead of assuming a physical or analytical relationship between the input and output data, non-parametric methods establish a
correlation based only on the data provided. This is why these methods are referred to as “learning methods”.
Table 1-4 presents the different types of non-parametric methods used in the past for elaborating the power output of a WTG.
Table 1-3 Parametric methods Function
type
Description of proposed parametric method Author and date Polynomial Linear model with binned speed partition
( ) = + ∙
Adjustment of a “q” order polynomial function
( ) = + + ⋯ +
Partitioning the power curve by wind speed
Partitioning by both wind speed and direction
(Sainz et al., 2009) (Lydia et al., 2013)
(Sainz et al., 2009)
(Llombart et al., 2005a)
(Llombart et al., 2005a) Exponential Double exponential
( ) = exp( exp( ∙ ))
Improved exponential model
( ) = exp(−exp( − ∙ − ∙ − ∙ )
(Pinson et al., 2007)
(Sainz et al., 2009)
Logistic 4-parameter logistic function ( ) = 1 +
1 +
5-parameter logistic function ( ) = + ( − )
1 +
(Kusiak et al., 2009a)
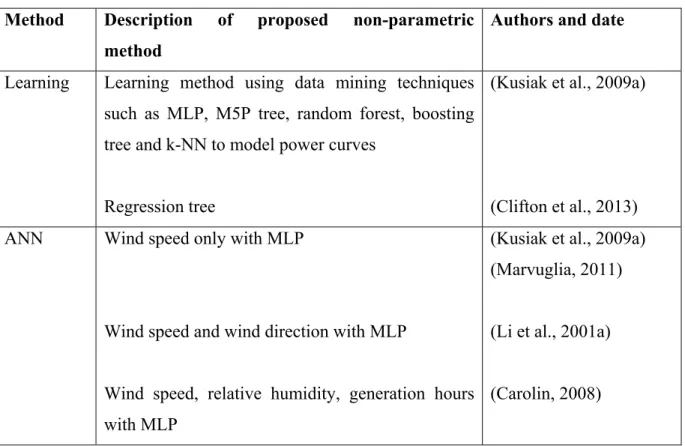
Table 1-4 Non-parametric methods Method Description of proposed non-parametric
method
Authors and date Learning Learning method using data mining techniques
such as MLP, M5P tree, random forest, boosting tree and k-NN to model power curves
Regression tree
(Kusiak et al., 2009a)
(Clifton et al., 2013) ANN Wind speed only with MLP
Wind speed and wind direction with MLP
Wind speed, relative humidity, generation hours with MLP
(Kusiak et al., 2009a) (Marvuglia, 2011)
(Li et al., 2001a)
(Carolin, 2008)
As can been seen in Table 1-4, investigation has been limited in the area of non-parametric modelling where the inputs having the greatest impact such as air density, turbulence intensity and wind shear have not been considered, especially investigation where these parameters are considered simultaneously.
1.1.2.4 Stochastic Methods
Anahua (Anahua, 2007), Boettcher (Boettcher et al., 2007) and Gottschal (Gottschal et al., 2008) presented several papers related to the stochastic analysis of wind turbine power output and wind speed. They use the Markov chain theory to elaborate the power curve of wind turbines. The Markov chain analyzes the dynamic behaviour of a system (wind turbine) with respect to a stochastic signal or input (turbulent wind speed). This method resulted in power curves that are independent of the turbulence intensity level. While this method has the advantage of enabling a wind turbine power curve to be modelled within a few days, it has the disadvantage that no parameters other than wind speed and are taken into account.
This shortcoming makes these types of models inapplicable in the long-term operation context.
1.1.3 Shortfalls of Current Method
As previously mentioned, several shortfalls related to current PPE methods have been identified, the most relevant of which in the context of this work being:
I. To the author’s knowledge, none of the methods has ever succeeded in modelling a power curve with more than three inputs simultaneously;
II. The level of uncertainty of these methods remains rather high, i.e. in the order of 5%;
III. Several articles contradict one another in identifying the method with the highest accuracy.
CHAPTER 2
POWER PERFORMANCE IMPROVEMENT – RESULTS FROM REVIEW OF LITTERATURE AND CONSULTATION
This section presents a synthesis of different techniques that could be used to improve the power output of existing WPP and that have been obtained by means of a review of literature and consultation through a steering committee and several other wind industry professionals with relevant experience.
2.1 Definition and Objectives of Power Performance Improvement (PPI)
The preceding section presented the review of literature with respect to the various techniques presently used to evaluate the power performance of operational WTGs. This chapter will focus on the current methods or techniques used to improve the power performance of operational WTGs or wind power plants.
PPI refers to any method, practice, or tool that can be used or implemented on a WTG in order to increase its annual energy output (AEP). It has been demonstrated by many authors that increasing the energy production of operational WTGs is possible. For example, GE with its WindBOOST application, Iberdrola with its WindCORE application, ECN with its changes in operational control and numerous other companies offering specific WTG performance optimization products and services are all claiming that they can improve the power performance of WTGs. Their biggest shortfall however is that few of them have ever properly demonstrated the true gain they argue they can achieve.
In this context, a review of literature has been conducted on this topic and several individuals and groups have been consulted to help identify possible avenues of power performance improvement. Parties involved in this context included the wind farm owner’s technicians and management, consultants from renowned consulting firms, professionals from a major
this regard. During these consultations, the only limitations imposed to the aforementioned participants were the following:
I. The proposed changes had to be technically and financially feasible in the context and timeframe of a PhD;
II. Due to financial constraints, no physical components of any turbines (e.g. changing of a blade) could be considered;
III. Due to the high level of complexity involved, the control algorithm of the WTGs could not be changed; only the set points used by these control algorithms could be an area of investigation.
The results from this review and these consultations can be synthesized in two major types of improvement: i) improvement in availability and ii) improvement in performance while the turbines are operational.
Table 2-1 and Table 2-2 provide a summary of the proposed methods obtained through the review of literature or suggestions from consulted individuals.
Table 2-1 presents methodologies proposed to increase power performance by improving WTG availability while Table 2-2 presents recommendations for improving WTG output while the turbines are operational (available). Each of these tables indicates the source of these recommended methodologies, whether from the Steering Committee or from a referenced article.
Table 2-1 PPI methodologies based on availability improvement
Improvement Description Authors and year
O&M team performance Steering Committee
Maintenance plan (preventive, predictive and condition-based) Steering Committee Parts procurements and spare parts optimization Steering Committee
Condition monitoring (Wilkinson et al., 2013)
Advanced analysis of data and faults (Kusiak et al., 2011)
Meteorology-based maintenance (Pelletier et al., 2008)
Curtailment optimization Steering Committee
Icing management Steering Committee
In-service inspection and end-of-warranty hand-off strategy Steering Committee Preparation of wind farm service life extension Steering Committee
Add wind turbines Steering Committee
Relocate wind turbines Steering Committee
Electrical network improvement (tree cutting, redesign, etc.) Steering Committee Table 2-2 PPI methodologies for WTGs during periods of availability
Improvement Description Authors and year
De-icing system or improved operation during icing events (Cattin, 2012) Blade cleaning and repair (surface roughness) (Dalili et al., 2007)
Wake management (Mikkelsen et al., 2007)
Advanced control (LIDAR or changes in control algorithm) (Angelou et al., 2010) Improve forecasting accuracy (for better energy trading) (Parkes et al., 2006)
Roughness adjustment (e.g. tree cutting) Steering Committee
Underperformance detection tools (power curves,
troubleshooting, etc.) (Lindahl et al., 2012)
Yaw offset measurement – correction and optimization see Section 2.2 Pitch and RPM optimization (stall and variable pitch turbines) (Khalfallah, 2007)
(Kusiak et al., 2009b)
Cut-in & cut-out optimization Steering Committee
Parameter (set points) optimization Steering Committee
While all these propositions represented plausible improvement techniques and most of them were theoretically achievable in the context of this project, it was not realistically possible to elaborate a test for all of these methods given temporal and financial limitations. Choices had to be made in order to achieve concrete results in the timeframe of a PhD. The following section will present the selected method for testing in the context of this project: the yaw offset optimization.
2.2 Yaw Offset Optimization
After multiple investigations, discussions and negotiations, it was decided by the wind farm owner, the turbine manufacturer and the author that a power performance optimization could be tested on two operating wind turbines. Specifically, it was agreed that testing related to yaw offset optimization could prove valuable in light of the technical and commercial interest of this aspect and also due to the fact that such an undertaking respected the three previously-mentioned constraints. This section of the document will present the context and the key findings from a review of literature specifically related to yaw error and yaw offset optimization.
2.2.1 Context and Definitions
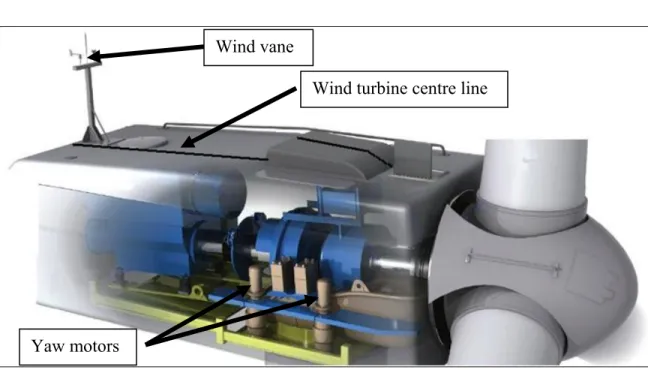
The yaw system of a wind turbine is the component responsible for orienting the rotor into the wind. Multi-megawatt turbines are mainly equipped with active yaw systems which primarily comprise two components: i) a wind vane (to detect wind direction) and ii) a yaw system (to orient the nacelle into the wind), as illustrated in Figure 2.1.
As wind direction is stochastic by nature, and due to the inertia of a multi-megawatt turbine, the rotor plane cannot always be perfectly perpendicular to the wind direction (i.e. misalignment of the rotor axis (wind turbine centre line) and the wind direction in the horizontal plane of the nacelle); this is known as yaw error. Two main types of misalignments are possible: static and dynamic. Figure 2-2 through Figure 2-4 briefly present the difference between these types of misalignment.
(Ref.:http://farm4.static.flickr.com/3555/3376591869_2b664406a6_o.png)
Figure 2-1 Wind Turbine nacelle and yawing system
Figure 2.2 presents a wind turbine with no yaw error, i.e. the rotor’s axis is perfectly aligned with the wind direction. As can been seen from this figure, the rotor axis (referred to as the centre line of the wind turbine) is parallel to the wind flow and also to the zero reference degree of the wind vane.
In reality, however, the rotational speed of the nacelle is not sufficient to ensure that the nacelle is always perfectly oriented in the axis of the wind direction. Figure 2-3 illustrates the yaw error of a wind turbine. The yaw error therefore corresponds to the angle between the rotor’s axis (the center line of the nacelle) and the wind direction. When the wind vane on the nacelle is perfectly aligned with the center line of the wind turbine, then the wind direction deviation is equivalent to the yaw error. Since yaw error is related to the wind direction, it is also referred as a dynamic error.
Wind vane
Wind turbine centre line
Figure 2-2 Perfect alignment of wind vane with nacelle centre line
Figure 2-3 Yaw error (dynamic)
Figure 2-4 illustrates a yaw offset. Yaw offset arises when the wind vane center line is not properly aligned with the center line of the nacelle. As the yaw offset is not related to the wind direction but rather due to the improper installation (orientation misalignment) of the wind vane, it is sometimes referred to as a static error. In cases where the wind vane is not aligned with the nacelle centre line, the wind deviation is then not equivalent to the yaw error.
Figure 2-4 Yaw offset (static)
Clarifications with regard to yaw error (dynamic) and yaw offset (static) is important since the current project is primarily focused on correcting only the latter.
2.2.2 Literature Review
As previously demonstrated, yaw error can originate from one or a combination of two distinct causes: i) a dynamic error caused by a change in wind direction and ii) a static error due to poor installation of the nacelle wind vane. The following sections will present a review of literature on i) the impact of yaw error on production ii) the estimated value of the yaw offset in modern multi-megawatt and iii) a summary of the attempt to improve energy production through yaw error management.
2.2.2.1 Energy Loss Due to Yaw Error
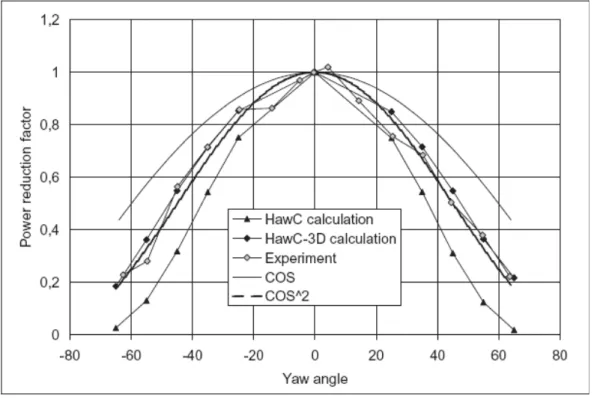
While some authors (Perovic et al., 2010) assume a cos3 relationship between the yaw error and lost production, the vast majority of articles reviewed demonstrated or assumed a cos2 relationship. For example, (Pedersen, 2004) interpreted the results of the study conducted by Madsen (Madsen, 2000) and presented Figure 2-5 where the relative production is provided
according to the yaw error angle. Pedersen also compared the relative production with the cos and cos2 relationship with the yaw error angle. He concluded that the energy lost is proportional to the cos2 of the yaw error, as shown in Figure 2-5.
Figure 2-5 Power vs. yaw error: measured and calculated relative power
2.2.2.2 Experiences with Yaw Offset
Experience suggests that, until recently, little effort has been made to ensure proper alignment of the wind vane with the wind turbine centre line. While some turbine manufacturers have internal protocols to ensure the proper alignment of the wind vane with the rotor axis, many (if not most) align the instrument in an approximate manner (by eye) or lack a standard procedure altogether. Table 2-3 presents the expected yaw offset values obtained by various authors. The angle values presented represent the value at 1σ for a normal distribution.
Moreover, yaw offset measurements have been taken on two wind turbines by the author with a wind vane calibration tool (see Annex I for further details on this tool for which a