HAL Id: halshs-01878865
https://halshs.archives-ouvertes.fr/halshs-01878865
Preprint submitted on 21 Sep 2018HAL is a multi-disciplinary open access archive for the deposit and dissemination of sci-entific research documents, whether they are pub-lished or not. The documents may come from teaching and research institutions in France or abroad, or from public or private research centers.
L’archive ouverte pluridisciplinaire HAL, est destinée au dépôt et à la diffusion de documents scientifiques de niveau recherche, publiés ou non, émanant des établissements d’enseignement et de recherche français ou étrangers, des laboratoires publics ou privés.
Chosen or imposed? The location strategies of
households.
Emilie Arnoult, Florent Sari
To cite this version:
Emilie Arnoult, Florent Sari. Chosen or imposed? The location strategies of households.. 2018. �halshs-01878865�
WORKING PAPER
N° 2017 - 05
CHOSEN OR IMPOSED? THE LOCATION STRATEGIES OF
HOUSEHOLDS
E
MILIE
A
RNOULT
,
F
LORENT
S
ARI
www.tepp.eu
TEPP - Institute for Labor Studies and Public Policies
1
C
HOSEN OR IMPOSED
?
T
HE LOCATION STRATEGIES OF
HOUSEHOLDS
.
Emilie Arnoult, Florent Sari
Université Paris-Est Marne-la-Vallée, ERUDITE and TEPP (FR CNRS n°3435), 5 boulevard Descartes - Champs sur Marne 77454 Marne-la-Vallée Cedex 2.
Université de Nantes, LEMNA and TEPP (FR CNRS n°3435), Chemin de la Censive du Tertre, 44322 Nantes Cedex 3. [email protected]
Abstract
During the last decades, the increase of population had led to urban sprawl and a change in the spatial structure of urban areas. Indeed, the costs in land settlement represent a high post for municipalities, and more broadly for local authorities. It not only implies challenges in terms of environment and sustainable development of urban areas, but also concerning the weakening social tie. The aim of public policies is to insure the social diversity to avoid urban stratification.
In this work, we aim to analyze the location of population regarding on socio-professional characteristics. We suppose that residential locations depend not only on households' preferences but also on land use concurrence. Basing our study on data extracted from the French National Population Census, we study the difficulties that public policies have to face to, in the second largest urban area of France.
We mobilize the tools of urban economics and highlight the disparities in residential locations of households. The urban area of Lyon is characterized by a strong city-center gathering a large part of employment and sociocultural activities. Looking at population as a whole, the city-center is the only place that significantly impacts the distribution of people. However, distinguishing workers and unemployed, and then high-skilled and low-skilled people reveals differences in accessibility to work place, and more generally to social activities.
2
I
NTRODUCTIONDuring the last decades, a large part of French agglomerations have faced to an urban sprawl process. Concretely, suburbanization around cities has taken precedence over agricultural land inducing new issues in terms of urban development and urban structuring. This phenomenon has been accompanied by an increase in daily commutes, made possible by the development of transportation infrastructures. These ones allow improving connections between suburbs and job centers by reducing commute times. The urban sprawl observed in recent decades is also characterized by relocation of jobs in the periphery of large cities. It is the case, for example, for head offices of larges companies, public institutions, higher education institutions etc. that locate in some new tertiary employment centers in development around these large cities. Consequently, urban sprawl is source of different socio-economic and environmental problematics that cities have to take into account in land use planning and policies. Other micro and macro-economic factors are also involved. It may be the case for the land market, residential strategies of households explained by individual location preferences, the development of public policy on land use at different scales, etc.
Works in urban economics show that these interactions are the sources of different urban patterns (see Medam, 1988; Horton, 1971; Bumsoo, 2007 etc.). Traditionally, the literature distinguish the monocentric form, where the population distribution is based only on the distance to a dynamic center bringing together all the activities (Alonso, 1964; Muth, 1969), and the multicentric form where the location of individuals not only depends on the distance to the city center but also to other sub-centers that appear outside the historical job sub-centers (Fujita, 1997; McMillen, 2004). However, some of these works have shown that the behavior of individuals can defer according to their occupational status or their income level, and would influence their location choices. In particular, Alonso (1964) and Mills (1967) argue that the socio-economic profile of households influence location choices. Because of high land prices in the city center, middle class and poor households cannot afford living near the job market and locate in the suburb. For these reasons, works that analyze the total population distribution without considering the heterogeneity of this population may hide some disparities between sub-population, in terms of location choices.
The objective of this work is to study the population distribution in the Urban Community of Lyon and to reveal whether the spatial organization follows a monocentric or a multicentric scheme. The originality of this work is twofold. Firstly, we mobilize a recent French population census (2009), allowing us to confirm or not some previous results on this agglomeration obtained by Buisson et al. (2001), showing the population increased by more than one hundred thousand inhabitants between periods considered in their work (1999) and ours, it seems interesting to verify the impact of this population growth on the spatial organization of the Grand Lyon. Secondly, we replicate the analysis for different subpopulation. In particular, we want to highlight the distribution of employed/unemployed people and the distribution of different socio-professional categories (employees-laborers and executives). By doing this, we can check if the spatial organization is homogeneous among the different populations.
Concretely, we first determine whether there is one or more centroids around which are distributed jobs and populations by exploratory spatial data analysis (ESDA). We then test various spatial econometric models in order to verify the robustness of the
3 configurations obtained in the previous step, to determine which spatial economic model best describes the spatial organization of the Grand Lyon and also to check if there are strong differences between different population categories. These analyzes permit us to study the residential strategies of households according to their distance to job centers.
In the first section, we briefly synthesize the existing literature that highlights the different urban forms through the theoretical models of individual residential location choices and empirical studies analyzing the population distribution. In the second section, we determine the appropriate tools for our analysis based on the results of the ESDA. In the third section, we present the results of our work, identifying the monocentric or multicentric form of the Urban Community of Lyon and highlighting the differences between subpopulations. Finally, the last section concludes.
1-
U
RBAN SPRAWL AND HOUSEHOLD LOCATION STRATEGIES1.1.
URBAN PATTERNS IN THE LITERATURE
Urban patterns have been largely studied in economic literature. Traditionally, two approaches are distinguished. The first one, carried by the New Urban Economy and based on Alonso (1964) works, explains population distributions by activities location. The second one rejects the homogeneity hypothesis in residential areas and aims to test the discontinuity of population densities between urban, peripheral and isolated areas (Bussiere, 1972).
1.1.1. The original monocentric model
Standard model in Urban Economics has been designed by Alonso (1964) and Muth (1969) as monocentric pattern. Metropolitan areas are defined by a Central Business District (CBD) which gathers all activities, and residential locations depend on the distance to the CBD. In each metropolitan area exists a unique CBD and population density decreases with the distance to the CBD.
In the original model (Alonso, 1964), different hypothesis are realized on the urban pattern, on economic agents behavior, their daily mobility and on the real estate market. They suggest that the districts composing the urban area are exactly the same except for the distance to the CBD, and so location decision is equivalent to a proximity choice. The city is designed as a closed space, monocentric and circular. Urban ground prices decrease with the distance to the center, due to concurrence on land occupation. Households are supposed to be homogenous, having the same income and identic preferences. Daily travels are only realized by workers and from residential location to the CBD. The only mean of transport is the car, and the road system is concentric. Finally, real estate market is based on pure and perfect competition where are organized auctions. Based on the neoclassical consumer theory, the objective of households is to maximize their usefulness under resource and price constraints. Housing is considered as a form of consumption defined by its surface, the transports to the city center and other unspatialized characteristics.
Residential location, a priori, does not matter for households. However, they prefer living near job market, but the land use concurrence increases prices in the city
4 center, decreasing with the distance (Fujita, 1989). The tightness on the real estate market impacts urban sprawl and the pattern of the metropolitan area. Households search the optimal location depending on their access to an amount of land, good and services regarding on housing prices and transportation costs. The most the transportation infrastructure is developed, the most a city is spread. The model shows population density is reduced when getting away, and a convex relationship between population density and distance to the CBD (Hamilton, 1982).
However, empirical observations show there are as many urban patterns as cities, the transportation structure differing from an agglomeration to another (Peguy, 2000). So this formalization has been largely declined coming back on the original hypothesis made, considered as too restrictive.
1.1.2. From monocentric to multicentric patterns
As a result of the monocentric pattern, location choices depend on the arbitration between land prices and transportation costs (Alonso, 1964; Anas, 1998), impacting population distribution. The same arbitration is realized by companies and so can appear
subcenters in metropolitan areas (Fujita, 1997). McMillen (2004) explains “an employment subcenter is a concentration of firms large enough to have significant effects on the overall spatial distribution of population, employment and land prices”.
To reduce transportation costs, induced by the distance and traffic jams, households favor residential location near their job. The concurrence in city center increases prices in the CBD, and land prices reduces with the distance. So companies decide to locate outside the city center, around the main highways, to reduce their infrastructure costs. In this way, appear secondary employment centers where companies propose reduced wages. Cost of living is lower in the suburb than city-center, and transportation costs reduced for workers that cannot afford living in the CBD. Workers accept the job offers if expected benefits are higher than the wage loss induced by the change of employment. Over time, subcenters appearance alters the population distribution and so the urban pattern of metropolitan areas.
1.1.3. Evidences from empirical studies
Many empirical studies deal with spatial forms, on French or foreign data. They lead to think that exist as many urban patterns as metropolitan areas, as a result of interaction between economic activities, social and political decisions (Medam, 1988; Horton, 1971; Bumsoo, 2007).
Some empirical studies on foreign data show the relevance of the multicentric model, finding a negative and significant gradient of distance to the CBD on population density. What means population density reduces with the distance to the central business district. These results are obtained for cities of developed and developing countries. Clark (1968) realized pioneering works on density function estimations. He shows that, in those years, eleven cities of developing countries are monocentric (Paris, London, New-York, Sidney, Frankfurt etc.): metropolitan areas have known an urban sprawl characterized by waves of population decentralization. Lambert (1998) found similar results for Netherlands cities, Mills (1980) for many cities of developing countries or Myrtho (2010) for Haiti. Peguy (2000) and Pouyanne (2004) obtain the same results analyzing French cities.
5 However, gradient significance and magnitude differs depending on the monocentric hypothesis has been rejected by several works (Baumont, 1999; McMillen, 1998ab; Fujita, 1997) explaining that polycentrism is more realistic to analyze metropolitan areas. In polycentric analysis, they do not take into account the distance to the CBD as only explanatory variable, but also the distance to the subcenters1. The main benefit is that method does not rejected the monocentric hypotheses; if the subcenters distance gradients are not significant, and the distance to CBD is, so the metropolitan area is a monocentric form.
Since the nineties, many studies have been realized using these methods, in developed countries2 and developing countries3.Some studies also have tested the polycentric hypothesis looking at French areas; Baumont et al. (2004) have studied intra-urban distribution of employment and population in Dijon, Gaschet (2000) and Pouyanne (2004) for Bordeaux, Boiteux (2003), Baccaini (2009) and Guillain (2007) for Paris region, Blanc (2007) for French living areas.
To our knowledge, two empirical studies deals with the agglomeration of Lyon: Buisson et al. (2001) and Mignot (2013). Our work stands out from their studies and is also complementary. In the first one, the authors propose a spatial analysis of the distribution of establishments by sectors within the municipalities of the metropolitan area. They show the emergence of peripheral employment centers, suggesting the appearance of a multi-functional polycentric urban organization. In the second one, the authors realize a comparative analyze of three large French metropolitan areas. They explain that residential mobility and location choices not only depend on socio-demographic characteristics but also on the urban patterns of metropolitan areas. They impact daily shuttles and can lead to segregation phenomenon. Using data from 1975-1999 French Population Censuses (INSEE), they conclude that both Lille and Marseille are multicentric patterns (with respectively four and two employment centers) whereas Lyon is still monocentric form despite several subcenters. Using more recent data, we want to analyze the population distribution in 2009 and also to verify if there are disparities between subcategories of population (we distinguish employment status and occupational status).
1.2.
LOCATION STRATEGIES AND DECISIVE FACTORS
1.2.1. Households heterogeneity and location strategies
The hypothesis of households’ homogeneity has been rejected in several works. The behavior of economic agents can defer according to their occupational status or their income level, and would influence their location strategies. Alonso (1964) and Mills (1967) explained the socioeconomic profile of households influence location choices. The tightness on real estate market leads to segregation between wealthy and poorest households. Because of high land prices in the city center, middle class and poor households cannot afford living near the job market and locate in the suburb.
1 The distance to the subcenters is introduced in different ways that we will explain and test later.
2 McMillen (1998ab) in Chicago, Waddell (1993) for Dallas, Small (1994), Heikkila (1989) and Gordon (1986) for Los
Angeles, Cervero (1997) for San Francisco, Coffey (1996) for Montreal.
3 Alperovich (1996) for Jerusalem, Chen (1997) for Taipei, Wu (1998) for Guanghzou, Amara (2010) and Ben Said
6 Going further, Tiebout (1956) explains the attraction-repulsion phenomena between households according to their living standards. Communities try to achieve an optimal size, and so moves are realized to balance community size. Households’ moves are based on achieving the best match of socioeconomic characteristics.
Flight-from-blight theory, based on observations in the USA, confirms this analyze. The cohabitation
in city-center pushes high class to leave negative externalities to peripheral cities which afford best way of life. So the urban pattern is modified because of urban sprawl, and the attractiveness of city-center reduced. Local amenities level decreases, and so low class situation is strengthened by their residential locations (Homocianu, 2009).
A “natural” stratification can also appear in land use: when the property income-elasticity is lower than transports income-income-elasticity, wealthier households live near the employment centroid, and vice versa (Brueckner, 1999). So when land use price decreases with the distance to the CBD, wealthier households live close and poorer ones live away. But when expected way of life is improved with the distance and a large transportation infrastructures make possible daily travels, high class prefer living away. So population distribution regarding on socioeconomic profile depends on the spatial planning of the metropolitan area and so territorial characteristics may influence urban patterns.
1.2.2. The impact of occupational status
In the traditional models of Urban Economics, the distance to workplace can explain density functions. At a microeconomic level, and due to land-use concurrence, the relationship between the access to job market and individual occupational status has been largely discussed in the literature. The idea of spatial mismatch leads to think that jobseekers are physically away from the job market. Gobillon and Selod (2000) mentioned two mechanisms. The first one is that physical distance reduces the available information about vacancies and their characteristics, which lead to residential segregation. Secondly, the increase of transportation costs induced by the distance to the jobs can lead to accept under-skilled jobs located near the residential location or to voluntary unemployment.
Job seeking efficiency reducing with the distance to job market, unemployed people would be wise to leave near the central business district. But the competition on land use leads them to live away (Wasmer, Zenou; 1999), which can explain higher unemployment rates in areas where structural characteristics are unfavorable (Ortega, 2000).
1.2.3. Districts characteristics and local amenities
Location choices might be influenced by the characteristics of neighborhoods. The districts composing urban areas are heterogeneous, not only by the distance to the central business district, but also by the local supply of amenities.
First of all, the development of transportation infrastructure impacts the urban sprawl. Considering the metropolitan area as a concentric road network is too restrictive. Because of urban sprawl, recent studies explain urban forms as the result of daily travels increase (Bertaud, 2001). Transportation policies applied in the last decades lead to a significant improvement of transport infrastructures, roads and railways, connecting suburban areas to the city-center. Implementing an efficient public transportation
7 network allows a spread of the metropolitan areas (Wiel, 2010). The districts become closer through a reduction of travel time. Workers do not think about distance to work but about transportation duration. And daily travels might be longer into the city-center than from suburban areas.
Location choices outside the city-center are made possible and allow households to enjoy local amenities reached by property with the same transportation durations, what involves urban sprawl and peripheral densification (Crozet, 2007). Housing prices reducing when getting away from city center, transportation infrastructures provide households access to better housing regarding on their size, number of rooms, but also occupational status: it is easier to own a house in the suburb, where prices are lower. Andan et al. (1999) explains location choice depends further on housing characteristics than distance to workplace; housing demand is developing where estate market conditions are more favorable and ownership made easier. Going away the city-center allows households to get larger housing economically; there is a positive correlation between households’ size and distance to the CBD (Hochman, Ofek; 1977).
Finally, it has been shown that the access to amenities leads to spatial segregation. Wealthier households have greater regard to amenities presence in their residential area (Zenou, 2002). This effect is reinforced by the impact of local amenities on land and housing prices. Wealthy households can afford getting out into the countryside, increasing socio-spatial fracture (Thierault et al., 2002).
2-
M
ETHODSTo understand the impact of activities location on population distribution, we estimate population density functions taking in account distance to local job markets. Firstly, is designed employment distribution to highlight the central business district and possible subcenters. Then are estimated density functions taking as explanatory variables the distance to the CBD and to the subcenters. If only the gradient of the distance to the CBD is statistically negative and significant, the area follows a monocentric pattern. It is a multicentric form if distance to one or more subcenters is also significant.
2.1. THE LOCATION OF ACTIVITIES: AN
EXPLORATORY
SPATIAL
DATA
ANALYSIS
In a first step, we look at the spatial distribution of employment in the Urban Community of Lyon at the neighborhood scale (called “IRIS”4). Based on the works of Anselin (1995, 1996), we realize an Exploratory Spatial Data Analysis (ESDA). It allows us to observe population and employment spatial distribution and, in a second time, to determine which are the activities center and potential subcenters. We mobilize two spatial analysis concepts: the global spatial autocorrelation and the local spatial autocorrelation. The first one is obtained by the Moran’s I statistic, the second one by the Local Indicators of Spatial Associations (LISA).
8
2.1.1. The weighting matrix choice
Before underlying autocorrelation presence, we have to identify the neighborhood scale considered in the study. Actually, the modeling of spatial connectivity between the observations is necessary (Cliff, 1973). We note the neighborhood matrix , and , are the components of each neighbors pair ( , ). The weighting matrixes are standardized not to overestimate the impact of each neighbor because they are unequally distributed between the observations5.
The simple binary contiguity matrix
Each component , equals 1 if both areas and are neighbors (if they have a common border), 0 if they do not. It is commonly admitted that , = 0 because an area cannot be its own neighbor. This one can be generalized; the contiguity matrix at the -th rank defines -the number of borders crossed to keep being considered as neighbors. For instance, two areas separated by one other and who do not have common border are considered has contiguous at the second rank, because we have to cross two geographical borders to go from one to the other.
The distance-based approach
Two locations are defined as neighbors ( , = 1) if their geographic distance is within a defined distance interval. We consider the intensity of relations between two areas depends on the distance of their centers; the most they are distant, the least intensive are their relation. On the contrary, the closest are areas, the most they are influencing each other.
In our study, we test these two different matrices and determine which one is the most appropriate to analyze the Urban Community of Lyon.
2.1.2. The Global Moran’s I
The Moran’s I statistic is computed to determine if there is spatial autocorrelation between the observations of a given area. Spatial autocorrelation can be defined as “the
lack of independence between geographical observations” (Le Gallo, 2002). The
underlying idea is that, in a restrictive area, can exists neighborhood effects; the performance of a district or a municipality can impact those of neighbors. The value of a random variable in a specific area are not randomly distributed, but closely bound; they often are equal between two close or adjacent observations (Jayet, 1993). The Moran’s I statistic is:
= ∑ ∑ ∑ ( − ̅)²( − ̅)( − ̅)
5 For each line i of the matrix, the neighboring localizations j are weighted by the total number of neighbors, and so the
9 with the value of variable for an area , ̅ the average value of for all areas and the interdependence degree between areas and . is the sum of weighting matrix components. If the weighting matrix is standardized, then = .
There is a positive spatial autocorrelation if > ( ) , a negative spatial autocorrelation if < ( ), and a lack of global spatial autocorrelation if = 0, with
( ) = −1/( − 1). The statistic obtained is tested to know if the result is statistically significant, that is to say if it is significantly different from zero. We realize the test for each weighting matrix.
2.1.3. The Local Indicators of Spatial Associations (LISA)
The Local Indicators of Spatial Associations (LISA) is computed for each area and measures the similarity degree of the area with its neighbors. Developed by Anselin (1995), they satisfy two standards. The first one is that they inform about the significant spatial gathering of similar values around each area . The second one is the sum of the LISA and is proportional to the Moran’s statistic.
The LISA is:
=( − ̅) ( − ̅) avec =∑ ( ̅)²
! .
It is a decomposition of the global spatial autocorrelation statistic giving the contribution for each area . These local contributions are mapped to underlight local spatial structures. We can use the LISA to observe local gathering effects (Anselin, 1995). We look at the link between the distribution of a normalized variable " and the spatial lag of this one ". Four kind of local associations are possible:
- HH (high-high): a high local value and neighbors’ value are high. - LL (low-low): a low local value and neighbors’ value are also low. - HL (high-low): a high local value and neighbors’ value are low. - LH (low-high): a low local value and neighbors’ value are high.
The HH and HL configurations express a positive spatial autocorrelation, and the LL and LH configurations show a negative spatial autocorrelation. Those results allow us to identify the CBD and the potential subcenters: the HH and HL configurations which have a statistically significant LISA are respectively considered as employment centers and isolated employment poles (Baumont et al., 2004).
2.2.
EMPIRICAL MODELS
Many studies used OLS to constitute density functions, but more appropriate econometric methods using spatial properties were introduced (Lesage, 1999; Anselin, 2001). In the literature, different methods allow to analyze urban forms. In our study, we estimate density functions and compare two kind of urban patterns: the monocentric one, where both activities and employment distribution depends on the distance to a central
business district; the multicentric one, where exists several employment centers, and
10
2.2.1. The monocentric model
In the monocentric pattern, both employment and population densities reduce with the distance to a central business district, previously identified by the Exploratory
Spatial Data Analysis. By going away from the CBD, the employment and population
concentration is reduced, and the distance from the CBD is used as the only explanatory factor of residential choices. However, the empirical model draft by Clark (1951), McDonald and McMillen (1998a) explains that the population density function is not linear with the distance. For this reason, we mobilize the following negative exponential function:
#( ) = # $ % → ln #( ) = ln # − )
with #( ) the employment or population density of an area located at a distance of the CBD, # the intercept density, and ) the density gradient (it measures the proportional rate at which population or employment density falls with distance. So, empirical results are based on the following model:
* = + + ) #-.# + / with:
- * = ln #( ) the employment or population density estimated, - + = ln # the intercept density,
- #-.# = the distance from to the central business district.
2.2.2. The spline exponential function
This specification is an extension of the negative exponential function and is adapted when the population density does not decrease monotonously with distance from the CBD (Baumont et al., 2004). Different knots are specified and define distance intervals. This function is exponential between these knots and the gradient of the function is allowed to vary along different distance intervals. In our case, we define only one knot located at 8 km of the CBD because it is the distance at which the different subcenters are located. This distance is more important than the Boundaries of Lyon. The population and employment densities are globally important until this radius of 8 kilometers and are often low or very low beyond this radius.
Finally, the spline-exponential function is defined by: * = + + )#-.# + 0 1 + /
where *, a, ) and #-.# are defined as before. is defined as follows: 20 3 ≤ 5 − 5 3 > 5 6ℎ 5 = 8 9: $6$5;
In this model, 0 is the parameter describing the change of the gradient of the function occurring within the distance interval defined by the 8 kilometers knot.
11
2.2.3. The multicentric model
This model is extended from the monocentric one. We consider not only the distance to the central business district as an explanatory factor, but also the distance to subcenters identified with the ESDA. This specification highlights the local influence of subcenters, compared to the monocentric model that supposes a global influence of the CBD. The distance to the CBD is the main explanatory factor, so distance to the subcenters is enter in inverse form, assuming the impact of the distance to secondary employment centers decreases more quickly than the impact of the distance to the CBD (McMillen, 2004). The empirical model is assumed in the following form:
* = + + )#-.# + <#=>. ? @
AB?
+ /
where *, a, ) and #-.# are defined as before. #=>. is the distance from the area to the subcenters, and < a vector of gradients associated to these distances.
2.2.4. Estimation strategies
The different specifications are firstly estimated by OLS. They must permit to identify which model is relevant to explain the urban configuration of the urban community of Lyon. However, because of spatial dependence, we cannot implement the standard OLS as the covariance between observations is no longer zero (Anselin, 1988). One form of dependence arises when unemployment rate of an area is affected by unemployment rates of neighbouring areas. In order to account for this, a spatially lagged dependent variable is included among the explanatory variables. The model estimated in this particular case is a SAR model (Spatial autoregressive model) and is estimated by maximum likelihood method. Another form of interdependence arises from a spatially correlated disturbance term among the observations. In that case, the spatial dependence is considered as a statistical nuisance statistics, which can be explained by problems of misspecifications (omitted variables, bad geographical scale etc.). Unless the previous equations are perfectly specified, the estimated parameters are inefficient and potentially biased.
In our case, we believe to the presence of spatially correlated disturbances. Indeed, the different models proposed do not mobilize many variables, so the risk of omitted variables bias might be important. In addition, spatial autocorrelation tests (LM-error and LM-lag and their robust versions) indicate the presence of spatially correlated disturbances. Consequently, the previous models must be modified to integrate spatial correlation explicitly in the form of a spatial error model in order to avoid inconsistent and biased estimators. The following error structure is added to the previous models:
C = D C + E FGH C~ (0, JK )
where W is the
n
×
n
weighting matrix mentioned above.The different models are then estimated by using a SEM model (Spatial Error Model). We use Maximum likelihood method and iterated GMM (Generalized Method of
12 Moments) for the estimations. Mobilizing these methods allows us to prove the robustness of our results.
To implement our results, we also estimate the specifications using a Spatial Durbin Model. This one is a generalized form of spatial model (Anselin, 1988) supposing that the spatial autocorrelation is bound to the distribution of observations (a spatially lagged endogenous variable) and that the values taken by exploratory variables are spatially correlated. The SEM and SAR estimations being particular forms of the Durbin model, likelihood tests are realized to confirm which results are the best to describe the data. The method is presented in Appendix 1.
3-
R
ESULTSWe base our study on data extracted from the National Population Census of 2009 to analyze the urban pattern of the Community of Lyon. Our analyzes are realized at the neighborhood scale, so 497 districts among the Urban Community. The Rhône-Alpes region is the second place for the surface, and for the size of the population, among the 22 French metropolitan areas. Within the region, the Urban Community of Lyon takes a huge place for both population and employment. With more than 1,2 millions of residents, it represents 20% of the regional population, and a growth rate of 7,2% between 1999 and 20096. The employment rate growth is significantly higher than the regional average, involving questions about urban planning.
In our study, we are looking at the impact of employment distribution on the location of population. We first want to determine which are the potential employment centers impacting the distribution of population in the area, by using the Exploratory Spatial Data Analysis. Then, we determine if the distribution of the population is following a monocentric or a multicentric pattern. Finally, we want to determine if location strategies differs regarding on employment situation.
3.1.
ANALYSIS OF THE SPATIAL STRUCTURE OF LYON
3.1.1. Central business district and subcenters identification
Using the tools of the Exploratory Spatial Data Analysis, we look at employment distribution to determine in which district are gathered activities. Firstly, we test the presence of global spatial autocorrelation and then we are interested in local spatial associations to highlight the central business district and the secondary employment centers.
The global spatial autocorrelation
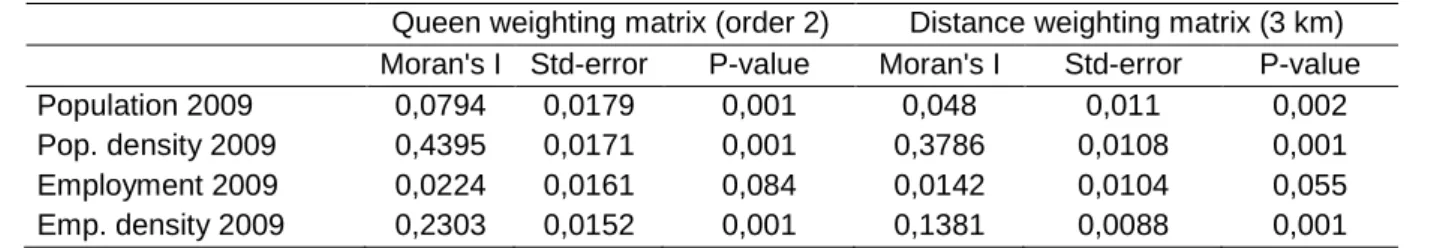
The results of the Moran’s test are presented in Table 1, for employment and population in the Urban Community of Lyon in 2009. Computed with the contiguity weighting matrix and the distance based weighting matrix, the tests reveal the presence of global spatial autocorrelation. It means that population and employment are not randomly distributed in the area, but districts with high number and density of employment or population are closely located. In the rest of our study, we are using the
13 contiguity weighting matrix, giving higher indicators for population, employment and their densities.
Table 1: The Moran’s indicator
Queen weighting matrix (order 2) Distance weighting matrix (3 km)
Moran's I Std-error P-value Moran's I Std-error P-value
Population 2009 0,0794 0,0179 0,001 0,048 0,011 0,002
Pop. density 2009 0,4395 0,0171 0,001 0,3786 0,0108 0,001
Employment 2009 0,0224 0,0161 0,084 0,0142 0,0104 0,055
Emp. density 2009 0,2303 0,0152 0,001 0,1381 0,0088 0,001
Reading: The Moran’s I statistic of the population distribution in 2009 shows a positive spatial autocorrelation significant at the 1% level ( 0,0794 > ( ) = −0,0020 ).
Source: National Population Census 2009 – INSEE.
The local spatial autocorrelation
The results of the Moran’s tests lead us to analyze the local spatial associations. Our results are summarized in Map 1 for the distribution of employment and in Appendix 2 concerning population density. Population and employment densities of each district are compared to its neighbors to highlight spatial association patterns. Concerning employment distribution, the results of Table 2 show 22% of the districts are characterized by a positive spatial autocorrelation (19.8% in HH, 2.3% in LL).
Table 2: The Local spatial associations – population and employment densities
Local associations Population (2009) Employment (2009)
High-High 92 31,19% 52 19,85%
Low-Low 29 9,83% 6 2,29%
High-Low 158 53,56% 200 76,34%
Low-High 16 5,42% 4 1,53%
Non significant 211 - 244 -
Reading: In the Urban Community of Lyon, 31,19% of districts are in High-High local configurations, with a high population density in 2009 surrounded by high population density district.
Source: French Population Census 1999 and 2009.
The Map 1 reveals the presence of a Central Business District in the city center, where districts are characterized by high density of employment surrounded by areas with a high density of employment too (High-High configurations in the previous table). Five potential subcenters have been identified: Rillieux-la-Pape, Vaulx-en-Vellin, Venissieux, Saint-Priest and Oullins. They are composed with high employment density whereas their neighbors are characterized by low density of employment (High-Low and Low-High local associations).
14 Map 1: Moran significance map for employment density (Queen weighting matrix)
We use the same methods to look at the distribution of population in the Urban Community of Lyon. The results presented in Appendix 2 show a similar distribution as the employment pattern: a concentration of densely populated districts in the city center (High-High spatial associations) and several areas where population concentration is higher than its neighbors (High-Low and Low-High spatial associations). After describing the distribution of both employment and population, the hypothesis of monocentrism and polycentrism are tested in the next section.
3.1.2. The residential distribution
In this section, we estimate density functions of population to test the monocentric form with a negative exponential function, monocentric with a spline exponential function and the multicentric pattern. From these results we determine which model describes the best our data.
The first part of table 3 gives the results of the monocentric pattern with a negative-exponential density function. Results by the OLS method are presented in the first column, and show a negative and significant gradient of the distance to the CBD, at the 1% level. So, getting away from the city-center reduces the population density. The Moran’s test reveals the presence of global spatial autocorrelation. The Lagrange Multiplier tests and their robust versions signal that the spatial autocorrelation is more linked to the error term than to a spatial lag, and so the SEM is more appropriated. In the second and third column are presented the results of the same model, using the spatial econometrics tools (by the maximum likelihood and iterated generalized moments estimations). They confirm the decline of population density with the distance to the city-center, the coefficient associated being negative and significant at the 1% level, whatever the method used. To implement our results, we realize likelihood tests between the Spatial Durbin model (column 4) and the SEM. They confirm the SEM method is the best one to describe our data. So population density decreases about 21.9% by kilometer away from the central business district.
15 Table 3: Estimation of population densities
Notes: ***, **, * denote significance at the 1%, 5% and 10% level respectively. Standards-error are in parentheses. P-values are in italics. The results of the OLS are corrected with the White method (1980). Source: French National Population Census of 2009, INSEE.
The second part of table 3 presents the results of the spline-exponential function. We suppose a discontinuity of the impact of the distance to the city-center on the distribution of population. Firstly, the OLS shows the decrease of population density with the distance to the CBD, but does not confirm a change at eight kilometers. So the impact of the distance to the city-center of Lyon would be the same in all the Urban Community. The Moran’s ratio confirms the presence of global spatial autocorrelation, and the Lagrange Multiplier tests show the SEM is more appropriated. Using the spatial econometric tools confirms the results of the OLS: there is no discontinuity in the population distribution that significantly depends on the distance to the center of Lyon. These results are the most appropriated, the likelihood tests showing the SEM method describe better the data that the Durbin one.
The Exploratory Spatial Data Analysis has described five potential subcenters, where population density is higher than its neighbors. In the last column of table 3 we test the impact of the distance to these subcenters on population location. The analyze by the OLS reveals not only a significant impact of the distance to CBD but also three
Multicentric
Variables OLS-White SEM-ML SEM-GMM Durbin-ML OLS-White SEM-ML SEM-GMM Durbin-ML OLS-White Ln D0 9,662*** 9,757*** 9,782*** 6,678*** 9,761*** 9,805*** 9,822*** 7,647*** 9,220*** (0,119) (0,168) (0,218) (0,841) (0,171) (0,209) (0,237) (0,966) (0,179) DCBD -0,220*** -0,219*** -0,219*** -0,442*** -0,253*** -0,250*** -0,250*** -0,773*** -0,245*** (0,017) (0,023) (0,030) (0,079) (0,034) (0,040) (0,045) (0,158) (0,021) x 0,106 0,099 0,098 0,463** (0,075) (0,085) (0,092) (0,182) w.DCBD 0,329*** 0,637*** (0,091) (0,182) w.x -0,428* (0,247) 1/(dist to Rillieux la P.) 0,513 (0,313) 1/(dist to Vaulx en V.) 0,829*** (0,319) 1/(dist to Ven.) 0,738** (0,295) 1/(dist to Saint-P.) 1,251*** (0,273) 1/(dist to Oul.) 0,159 (0,320) λ 0,314*** 0,514*** 0,203** 0,323*** (0,087) (0,059) (0,096) (0,069) ρ 0,293*** 0,185* (0,088) (0,097) R2 0,243 0,243 0,243 0,186 0,190 0,190 0,231 Moran’s I (error) 4,787 2,834 1,259 p-value 0,000 0,005 0,208 LM-Lag 11,869 2,885 0,420 p-value 0,001 0,084 0,517 Robust LM-Lag 10,094 12,876 0,000 p-value 0,001 0,000 0,986 LM-error 19,824 6,028 0,461 p-value 0,000 0,014 0,497 Robust LM-error 18,049 16,019 0,041 p-value 0,000 0,000 0,839 Observations 497 497 497
16 subcenters, and the gradients have expected signs. Population densities significantly decrease with the distance to Vaulx-en-Vellin in the Northeast and to Venissieux and Saint-Priest in the Southwest of Lyon. Unlike the monocentric pattern, the use of the spatial tools does not seem to be necessary, the Moran’s and Lagrange tests being non-significant. Introducing the inverse distance to the subcenters might correct the spatial autocorrelation bias. Indeed, looking at population and employment distribution (Map 1 and Appendix 2) allow us to think population gatherings are located near employment subcenters. So including the distance to these ones improves the model’s quality and its availability to describe the reality.
Leaning on existing literature lead us to think location behaviors can differs among people, and the access to city-center difficult for households that cannot afford living next to. Indeed, the concurrence on land use can change the urban pattern, and so population distribution on the area differs regarding on their individual characteristics. In the rest of our study, we want to compare population distribution regarding on two points. Firstly, we look at the employment status and in a second time the socio-professional category.
3.2.
HETEROGENEITY OF LOCATION STRATEGIES
To look at the heterogeneity of the location strategies, we are using the same models as previously. We want to look at the distribution of each sub-set of population according to the distance to employment centers. To make easier the results presentation, the estimations of the monocentric hypothesis are presented in appendix 4-5 and we just focus on the multicentric one, being an extension of the first one.
3.2.1. The access to job market for unemployed people
The access to employment has been largely treated in the literature, and the distance to employment reduces the probability to find a new job (Kain, 1968). The results in table 4 are presenting the distribution of workers (column 1) and of unemployed people (column 2). The multicentric pattern is confirmed by the model, the distance to the CBD and to at least one subcenter being significant. The use of spatial econometric tools is not justified, the global Moran test being non-significant. It might mean studying separately subsets of the population allows correcting the spatial autocorrelation bias.
The impact of the distance to the CBD is closely the same for both sub-sets of population: getting away from one kilometer reduces workers density of 24% and unemployed density of 25.3%. The main difference concerns the impact of the inverse-distance to the subcenters; just one has a significant effect for workers against four concerning unemployed. So the distance to subcenters is more likely to influence the location strategies of unemployed than workers.
17 Table 4: The multicentric pattern - worker and unemployed densities
(1) Density of workers, (2) density of unemployed in 2009.
Notes: ***, **, * denote significance at the 1%, 5% and 10% level respectively. Standards-error are in parentheses. P-values are in italics. Estimations are realized with the OLS method and are corrected with the White procedure (1980).
Source: French National Population Census of 2009, INSEE.
The residential locations of workers and unemployed are represented in Map 2. It seems confirming workers are more likely to locate near the city center; their location strategies are more influenced by the distance to Lyon. On the contrary, unemployed people distribution is more spread among the area.
Basing on existing literature, these differences in location strategies could be explained by the differences in access to real estate market. Constraints in access to housing ensure the competition between households. So the situation on labour market of individuals impacts their locations and appears significant differences between workers and unemployed people. It can however induce difficulties in access to employment, a large part of job propositions getting from the city-center. The emergence of subcenters might improve the possibilities of finding a new job.
(1) (2)
Ln D0 8,302*** 5,864***
(0,240) (0,276)
DCBD -0,240*** -0,253***
(0,028) (0,032)
1/(dist to Rillieux la Papa) 0,395 0,850*
(0,419) (0,482)
1/(dist to Vaulx en Velin) 0,603 1,193**
(0,428) (0,492) 1/(dist to Vennissieux) 0,555 1,288*** (0,395) (0,454) 1/(dist to Saint-Priest) 1,228*** 1,494*** (0,365) (0,420) 1/(dist to Oullins) 0,243 0,162 (0,429) (0,493) R2 0,131 0,127 Moran's I (error) 1,267 1,036 p-value 0,205 0,300 LM Lag 0,434 0,131 p-value 0,510 0,717 LM Lag (robust) 0,001 0,122 p-value 0,971 0,727 LM error 0,471 0,220 p-value 0,493 0,639 LM error (robust) 0,039 0,210 p-value 0,844 0,647 Observations 497 497
18 Map 2: Workers and unemployed residential locations
Source: French Population Census, 2009.
3.2.2. The distribution of population regarding on their socio-professional category
Basing on previous literature, we think that the standard of living can influence the location strategy of households (Alonso, 1964; Mills, 1964). So in this section, we compare the repartition of executives with the residential location of employees and laborers (table 5). Both estimations are realized with the OLS, and confirm the multicentric pattern. The global Moran’s test being non-significant, we do not use the tools of spatial econometrics, the estimation allowing correcting the bias of spatial autocorrelation.
Comparing the distribution of high-skilled (first column) and low-skilled (second column) workers shows that the first ones are more impacted by the distance to the CBD than the second ones. For each kilometer, the density of executives declines of 33.8% against 19.6% for employees-laborers. Moreover, the location of low-skilled people is more influenced by the distance to the subcenters, the associated coefficients being higher in magnitude and significance. Furthermore, the distance to two of the subcenters has a significantly negative impact on the density of executives; the proximity to Vaulx-en-Vellin and Vennissieux reduces the density of high-skilled people.
19 Table 5: The multicentric pattern – executives vs. employees and laborers
(1) Density of executives, (2) density of employees and laborers in 2009.
Notes: ***, **, * denote significance at the 1%, 5% and 10% level respectively. Standards-error are in parentheses. P-values are in italics. Estimations are realized with the OLS method and are corrected with the White procedure (1980).
Source: French National Population Census of 2009, INSEE.
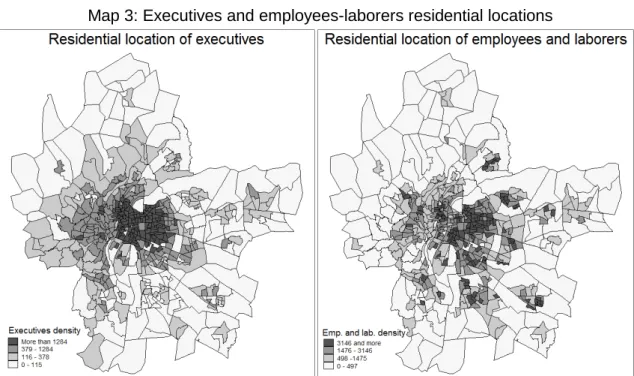
Even if the density functions of high-skilled and low-skilled both correspond to multicentric patterns, the impact of the distance to subcenters is highest for the second subset. This assessment is confirmed by the representation of the distributions in Map 3; executives are largely centered in Lyon whereas laborers and employees are more spread all over the area.
We previously realized two hypothesis on the spatial localization of individuals regarding on their socio-economic profiles. The first one, here rejected, supposed high-skilled people left the city-center to flee the negative externalities (flight from blight theory). On the contrary, executives are more likely to live in the city-center to enjoy the socio-cultural amenities. The tightness on housing prices lead poorer households to live in peripheral areas (natural evolution theory).
(1) (2)
Variables OLS-White OLS-White
Ln D0 7,793*** 7,047***
(0,271) (0,255)
DCBD -0,338*** -0,196***
(0,031) (0,029)
1/(distance to Rillieux la Pape) -0,071 0,703
(0,474) (0,445)
1/(distance to Vaulx en Velin) -0,850* 1,161**
(0,483) (0,454) 1/(distance to Vennissieux) -0,840* 1,092*** (0,447) (0,420) 1/(distance to Saint-Priest) 0,852** 1,397*** (0,413) (0,388) 1/(distance to Oullins) -0,088 0,309 (0,485) (0,456) R2 0,200 0,100 Moran's I (error) 0,968 1,244 p-value 0,333 0,214 LM Lag 0,951 0,457 p-value 0,330 0,499 LM Lag (robust) 5,162 0,017 p-value 0,023 0,897 LM error 0,164 0,442 p-value 0,686 0,506 LM erro (robust) 4,375 0,001 p-value 0,036 0,970 Observations 497 497
20 Map 3: Executives and employees-laborers residential locations
Source: French Population Census, 2009.
We could also explain the differences in location strategies by the location of employment. In the Urban Community of Lyon, the largest part of employment is gathered in Lyon; 90,31% of high-skilled jobs and 62.88% of low-skilled ones (cf. Table 6). The share of executives in the city-center is higher than the share of laborers and employee jobs. People preferring living near job locations, it partly can explain executives are more gathered in the CBD.
Table 6: Local job markets
Notes: Column 1 gives the share of total executive jobs in each municipality, column 2 the share of employee and laborer jobs.
Source: French National Population Census, 2009, INSEE.
Municipality Executives (%) Employees and
laborers (%) Lyon 90,31 62,88 Oullins 2,35 4,58 Rillieux-la-Pape 2,03 5,37 Saint-Priest 2,53 8,30 Vaulx-en-Vellin 1,25 7,50 Vennissieux 1,52 11,37
21
C
ONCLUSIONThe aim of this work was to analyze the distribution of population in the Urban Community of Lyon. Papers realized on older databases showed population location was mainly influenced by the distance to the center of Lyon, which gathered a large share of employment. However, they denoted the appearance of local job markets with the creation of secondary employment poles outside the city-center.
To test the impact of employment location on population distribution, we mobilize the methods established by the Urban Economics, and the spatial econometric tools when necessary. Working on recent data allows us to confirm the presence of subcenters that influence significantly the distribution of population, and so the multicentric pattern of the Urban Community of Lyon is confirmed. Even if we detect spatial autocorrelation bias, the using of spatial econometrics does not improve the robustness of our results. So we identified two potential sources of the bias; the first one due to missing explanatory variables, the second one to heterogeneity in observations. So we realized analysis on subsets of the populations to reveal differences in residential strategies.
We estimate the density functions of workers and unemployed people and our results reveal the first one are more sensitive to the distance to the CBD whereas the residential locations of unemployed people are more spread over the area. Secondly, we show high-skilled individuals gather around the city-center whereas the location of low-skilled is also determined by the distance to subcenters, confirming the natural evolution theory. Wealthier households live in the city-center to enjoy local amenities, and the tightness on real estate market lead the middle-class and poor households in the suburbs.
In spite of the appearance of employment subcenters, a large part of jobs still gathered in the CBD. The urban planning lead to improve the access to employment and to control urban sprawl. The “Lyon 2010” project of 1988 and renewed in 2010 aims to support the development and the enhancement of peripheral activity centers. These measures go along with the improvement of transportation infrastructures, not only to improve the access to the city-center but also to the subcenters.
22
B
IBLIOGRAPHYAguilera A., Mignot D., Bloy D., Caubel D. and Madre J.L., 2013, Urban forms, mobility and segregation. a Lille-Lyon-Marseille comparison. Dialogues in Urban Planning. Alonso W., 1964, Location and land use - Towards a general theory of land rent.
Cambridge-Harvard University Press.
Alperovich G., 1996, The effectiveness of spline urban density functions: an empirical investigation. Urban Studies, 32, pp.1537–1548.
Amara M., Kriaa M., and Montacer M., 2010, Centralité des activités dans la région urbaine de Tunis (1994-2004). Revue d’Économie Régionale et Urbaine, pp. 473– 509.
Anas A., Arnott R., and Small K., 1998, Urban spatial structure. Journal of Economic Perspectives, 36.9.
Andan O., Pochet P., Routhier J.-L., Scheou B., 1999, Stratégies résidentielles des ménages et mobilité domicile-travail, note de synthèse du rapport de recherche réalisé pour le compte de la DRAST dans le cadre du PREDIT 1996 – 2000.
Anselin L, 1988, Spatial Econometrics: Methods and Models. MA: Kluwer Academic Publishers, Boston.
Anselin L., 1995, Local indicators of spatial association - LISA. Geographical Analysis, 27, pp. 93–115.
Anselin L., 1996, The Moran scatterplot as an ESDA tool to assess local instability in spatial association. London: Taylor and Francis.
Anselin L., 2001, Spatial Econometrics. Companion to Econometrics.
Baccaïni B. and Sémécurbe F., 2009, La croissance périurbaine depuis 45 ans. Insee Première, 1240.
Baumont C., Ertur C. and Gallo J. L., 2004, Spatial Analysis Of Employment And Population Density: The Case Of The Agglomeration Of Dijon 1999. Geographical Analysis, vol. 36(2), pp. 146-176.
Baumont, C. and Le Gallo J.,1999, Empirical foundations of multicentric urban models. Technical report, Laboratoire d’Economie et de Gestion (LEG), 46th North American Congress of the Regional Science Association International – Montreal (Canada). 11-14-1999.
Ben Said F. and Ayadi M., 2011, Analyse de l’étalement urbain selon le profil de la densité résidentielle dans le district de Tunis: application de la technique des ”spline regression” spatiales. JMA 2014.
Bertaud A., 2001, Metropolis: A measure of the spatial organization of 7 large cities. Technical report, NYU Stern Urbanization Project.
Blanc M., Schmitt B., and Ambiaud E., 2007, Orientation économique et croissance locale de l’emploi dans les bassins de vie des bourgs et petites villes. Economie et Statistique, 402, pp. 57–74.
Boiteux-Orain C. and Guillain R., 2003, Changes in the intra-metropolitan location of producer services in Ile-De-France (1978-1997): do information technologies promote a more dispersed spatial pattern. LEG - Document de travail, Université de Bourgogne.
23 Brueckner JK, Thisse JF, Zenou Y., 1999, Why is central Paris rich and downtown Detroit poor?: An amenity-based theory, European Economic Review, Volume 43, Issue 1, 10 January 1999, Pages 91-107.
Buisson M.-A., Mignot D., and Aguilera, A., 2001, Métropolisation et polarités intra-urbaines. le cas de Lyon. Revue d’Economie Régionale et Urbaine, 2, pp. 271–296. Bumsoo L., 2007, ’Edge’ or ’edgeless’ cities? Urban spatial structure in U.S. metropolitan
areas, 1980 to 2000. Journal of Regional Science, 47(3), pp. 479–515.
Chen, H., 1997, Models of urban population and employment density: the spatial structure of monocentric and polycentric functions in Greater Taipei and a comparison to Los Angeles. Geographical and Environmental Modelling, 1, pp.135–151.
Clark, C., 1968, Population growth and land use. New York, Saint Martin Press. Cliff, A. D. and Ord J., 1973, Spatial Autocorrelation. Pion, London.
Crozet Y. and Joly I., 2007, La loi de Zahavi: quelle pertinence pour comprendre la construction et la dilatation des espaces-temps de la ville? 163. Recherche, PUCA edition.
Elhorst J-P, 2010, Applied Spatial Econometrics: Raising the Bar, Spatial Economic
Analysis, 5:1,pp. 9-28.
Fujita, M. and Ogawa, H., 1997, Multiple equilibria and structural transition of non-monocentric urban configurations. Regional Science and Urban Economics, 12(2), pp. 161–196.
Fujita, M. and Thisse, J.-F., 1997, Economie géographique, problèmes anciens et nouvelles perspectives. Annales d’Economie et Statistique, (45), pp. 37–87.
Fujita M., 1989, Urban economic theory, Cambridge, Cambridge University Press.
Gaschet, F., 2000, La structure d’un espace urbain polycentrique: la métropole
bordelaise. Structure des villes, entreprises et marchés urbains.
Gobillon L., Selod H., 2000, Ségrégation urbaine et accès à l’emploi.
Gordon, P., Richardson, H., and Wong, H., 1986, The distribution of population and employment in a polycentric city: the case of Los Angeles. Environment and Planning
A, 18, pp.161–173.
Guillain, R. and Le Gallo, J., 2007, Agglomeration and dispersion of economic activities in Paris and its surroundings : An exploratory spatial data analysis, Document de
travail du LEG.
Hamilton, B. W. and Röell, A., 1982, Wasteful commuting. Journal of Political Economy, 90(5), pp. 1035–1053.
Heikkila, E., Gordon, P., Kim, J. I., Peiser, R. B., Richardson, H. W.,and Dale-Johnson, D., 1989, What happened to the CBD-distance gradient?: land values in a policentric city. Environment and Planning A, 21(2), pp. 221–232.
Hochman O., Ofek H., 1977, The value of time in consumption and residential location in urban cities, American Economic Review, December, pp. 996-1004.
Homociano G., 2009, Modélisation de l’interaction transport-urbanisme - choix résidentiels des ménages dans l’aire urbaine de Lyon - Université Lumière - Lyon 2. Horton, F. E. and Reynolds, D. R.,1971, Action space differentials in cities. Perspectives
24 Jayet H., 1996, «L’analyse économique des migrations, une synthèse critique», Revue
Economique, vol 0(2), pp. 193-226.
Kain, J. F., 1968, Housing segregation, negro employment, and metropolitan decentralization. Quarterly Journal of Economics, 82, 32-59.
Kim JH, Pagliara F., Preston J., 2005, The Intention to Move and Residential Location Choice Behaviour, Urban Studies, Vol. 42, No. 9, 1621-1636.
Le Gallo, J., 2002, Économétrie spatiale : l'autocorrélation spatiale dans les modèles de régression linéaire, Economie et prévision, n°155, pp. 139-157.
LeSage, J., 1999, Spatial Econometrics. The Web Book of Regional Science.
LeSage, J. P. et Pace, R. K., 2009, Introduction to Spatial Econometrics, Boca Raton, Taylor & Francis.
McMillen, D. and McDonald, J., 1998a, Population density in Chicago: a bird rent approach. Urban Studies, 7, pp.119–30.
McMillen, D. and McDonald, J., 1998b, Suburban subcenters and employment density in metropolitan chicago. Journal of Urban Economics, 43, pp.157–80.
McMillen, D. P., 2004, Employment densities, spatial autocorrelation, and subcenters in large metropolitan areas. Journal of Regional Science, 44(2), pp.225–244.
Medam, A., 1998, Villes pour un Sociologue. L’Harmattan.
Mills, E. S. and Tan, J., 1980, A comparison of urban population density functions in developed and developing countries. Urban Studies, 17.
Muth, R., 1969, Cities and Housing: The Spatial Pattern of Urban Residential Land-Use.
Chicago and London, The University of Chicago Press.
Myrtho, J. and Wang, F., 2010, Population density patterns in Port-au-Prince, haiti: A model of Latin American city? Cities, 27(3), pp.127 – 136.
Ortega J., 2000, Pareto-Improving Immigration in an Economy with Equilibrium Unemployment, The Economic Journal, Vol. 110, pp. 92-112.
Peguy, P.-Y., 2000, Analyse économique des configurations urbaines et de leur
étalement. PhD thesis, Université Lumière Lyon 2.
Pouyanne, G., 2004, The influence of urban form on travel patterns. An application to the
metropolitan area of Bordeaux. ERSA conference papers 244, European Regional
Science Association.
Small, K. A. and Song, S., 1994, Population and employment densities: Structure and change. Journal of Urban Economics, 36, pp.292–313.
Theriault M., Kestens Y., Des Rosiers F., 2002, The impact of mature trees on house values and on residential location choices in Quebec City, Université Laval.
Tiebout C.M., 1956, « A Pure Theory of Local Expenditures », The Journal of Political
Economy, Vol. 64(5), pp. 416-424.
Waddell, P. and Shukla, V., 1993, Employment dynamics, spatial restructuring, and the business cycle. Geographical Analysis, 25(1), pp.35–52.
Wasmer E., Zenou Y., 1999, Space, Search and Efficiency, IZA Discussion Papers 181, Institute for the Study of Labor (IZA).
25 Wu, F., 1998, Polycentric urban development and land-use change in Transitional
Economy: the case of Guangzhou. Environment and Planning A, 30, pp.1077–1100. Zenou, Y, 2002, How do firms redline workers? , Journal of Urban Economics, n°52, pp.
26
A
PPENDICESAppendix 1: Comparison of spatial models
Elhorst (2010), based on the works of Lesage and Pace (2009) explains likelihood tests permit to choose what spatial model describe the best the data. When both Lagrange Multiplier tests and their robust versions are significant, a likelihood ratio test has to be realized.
The likelihood ratio statistic follows a Chi-2 law, and is:
PQ = −2 RP:SPT)U∗W − P:SPT)UWX or PQ = RP:ST$∗Y$∗W − P:S($Y$ )X.
where the number of observations and $Y$ the residual sum of squares.
Appendix 2: Moran significance map for population density in 2009 (Queen weighting matrix)
27 Appendix 3: Tests of the likelihood ratio
A) Residual sum of squares of the regressions
Note: (1) Monocentric pattern with negative-exponential density function, (2) monocentric pattern with a spline-exponential function, (3) multicentric pattern.
Source: French National Population Census, 1999 and 2009, INSEE.
B) Likelyhood ratios of the regressions
Note: (1) Monocentric pattern with negative-exponential density function, (2) monocentric pattern with a spline-exponential function, (3) multicentric pattern.
ZK. \(500) = 553.128 , so for each model the Durbin Spatial regression is not the best one.
Source: French National Population Census, 1999 and 2009, INSEE.
(1) (2) (3) SEM 1006,37 1002,26 909,76 SAR 1011,62 1007,34 909,46 Durbin 938,52 958,69 888,80 (1) (2) (3) SEM 1360,11 1353,49 1250,91 SAR 1358,10 1350,39 1251,29 Durbin 1337,71 1312,95 1229,49 Population density - 1999 Population density - 2009 (1) (2) (3) SEM / Durbin 34,69 22,09 11,58 SAR / Durbin 37,28 24,60 11,42 (1) (2) (3) SEM / Durbin 8,25 15,11 8,58 SAR / Durbin 7,52 13,97 8,74 Population density - 1999 Population density - 2009