47 )/
Université de IViontréal
Étude des propriétés vibrationnelles à basse fréquence des matériaux nanocristallins à l’aide de la dynamique moléculaire
par
Catherine Hudon
Département de physique Faculté des arts et des sciences
Mémoire présenté à la Faculté des études supérieures en vue de l’obtention du grade de Maître ès sciences (M.$c.)
en physique
Avril, 2007
‘— td?c /‘5• GraGe conar
©
Catherine Hudon, 2007. icrdu(ù
.c•
“o
LTn
D
Q
Université
de Montréal
Direction des bibIothèques
AVIS
L’auteur a autorisé l’Université de Montréal à reproduire et diffuser, en totalité ou en partie, par quelque moyen que ce soit et sur quelque support que ce soit, et exclusivement à des fins non lucratives d’enseignement et de recherche, des copies de ce mémoire ou de cette thèse.
L’auteur et les coauteurs le cas échéant conservent la propriété du droit d’auteur et des droits moraux qui protègent ce document. Ni la thèse ou le mémoire, ni des extraits substantiels de ce document, ne doivent être imprimés ou autrement reproduits sans l’autorisation de l’auteur.
Afin de se conformer à la Loi canadienne sur la protection des
renseignements personnels, quelques formulaires secondaires, coordonnées ou signatures intégrées au texte ont pu être enlevés de ce document. Bien que cela ait pu affecter la pagïnatïon, il n’y a aucun contenu manquant.
NOTICE
The authot of this thesis or dissertation has granted a nonexciusive license allowing Université de Montréat to reproduce and publish the document, in part or in whole, and in any format, solely for noncommercial educational and research purposes.
The author and co-authors if applicable retain copyright ownership and moral rights in this document. Neither the whole thesis or dissertation, nor substantial extracts from it, may be printed or otherwise reproduced without the author’s permission.
In compliance with the Canadian Privacy Act some supporting forms, contact
information or signatures may have been removed from the document. While this may affect the document page count. it does flot represent any loss of
Université de Montréal Faculté des études supérieures
Ce mémoire intitulé:
Étude des propriétés vibrationnelles à basse fréquence des matériaux nanocristallins à l’aide de la dynamique moléculaire
présenté par:
Catherine Hudon
a été évalué par un jury composé des personnes suivantes: Yves Lépine, président-rapporteur
Laurent J. Lewis, directeur de recherche François Schiettekatte, membre du jury
RÉSUMÉ
Une étude numérique des propriétés vibrationnelles des matériaux nanocristal lins est présentée. Plus particulièrement, la densité d’états vibrationnels (VDOS)
à basse fréquence a été étudiée au moyen de simulations de dynamique molécu laire, les atomes du système interagissant via un potentiel de Lennard-Jones dans un espace bidimensionnel. Les contributions partielles à la VDOS de différentes catégories d’atomes (déterminées selon l’environllement atomique) ont été calcu
lées, ainsi que la VDO$ locale (on-site). Les résultats montrent l’existence de trois régimes successifs distincts dans la VDO$ à basse fréquence sous une densité cri
tique p, une conséquence directe des différentes longueurs caractéristiques dans le
matériau : un premier régime qui apparaît aux plus basses fréquences et qui cor respond à la limite élastique; un second régime (intermédiaire) qui est associé à la faible connectivité du matériau sous p et qui ne varie pas nécessairement avec la fréquence comme un système bidimensionnel (soit linéairement) ; un troisième ré gime associé à des modes de grain et caractéristique d’un solide de Debye usuel. Le régime intermédiaire disparaît pour des systèmes de densité supérieure à p. Il est
aussi démontré que les modes excédentaires à basse fréquence (comparativement à un cristal parfait) dans le régime supérieur proviennent principalement des atomes formant les joints de grain, tandis que ceux dans les deux atitres régimes sont reliés à la présence de pores dans ces matériaux.
Mots—clés : matériaux nanocristallins, densité d’états vibrationnels, simula tions numériques
ABSTRACT
A nurnerical study of the vibrational properties of nanocrystalline materials is presented. In particular, the low-frequency vibrational density of states (VDOS) lias been investigated within the framework of molecular-dynamics simulations. The atoms of the system interact via the Lennard-Jones potential in a two-dimensional space. The partial VDO$ for clifferent categories of atoms (as determined from their atomic environment), as well as the local (on-site) VDO$, are calculated. It is shown that the low-frequency spectrum exhibits a sequence of three distinct regimes below a critical density p, a direct consequence of the scale separation in the material a first regime, at the lowest frequencies, corresponding to the elastic limit; a second (intermediate) regime, associated to the weak collnectivity of the material under and which does not necessarily scale as a two-dimensional system (i.e. liiearly) a third regime, associated with grain modes and characteristic of a usual Debye souci. The intermediate regime is found to disappear above p. It is further demonstrateci that the excess vibrational modes (compared to the perfect crystal) in the upper low-frequency regime arises mainly from grain-boundary atoms, while the other two regimes are related to the presence of pores in the materials.
Keywords : nanocrystalline materials, vibrational density of states, numerical simulations
vi TABLE DES MATIÈRES
RÉSUMÉ iv
ABSTRACT y
TABLE DES MATIÈRES vi
LISTE DES FIGURES viii
LISTE DES TABLEAUX x
LISTE DES ANNEXES xi
NOTATION xii
REMERCIEMENTS xiii
INTRODUCTION 1
CHAPITRE 1 :ARTICLE LOW-FREQUENCY VIBRATIONAL PRO PERTIES 0F NANOCRYSTALLINE MATERIALS:
A TWO-DIMENSIONAL STUDY 9
ABSTRACT 10
1.1 Introductioll 10
1.2 Computational details 12
1.2.1 IViodel 12
1.2.2 Calculation of the VDOS 14
1.3 Resuits 17
1.3.1 Low-frequency VDOS 17
1.3.2 Local (on-site) VDOS 30
CONCLUSION . 39
viii LISTE DES FIGURES
1 Exemples tirés de la littérature de spectres vibrationnels obtenus
expérimentalement et numériquement 4
1.1 Part of the NC-B4 sample (relative density of 0.89) showing the different atom types green = perfect; black = good; blue = GB;
red surface 15
1.2 (a) Normalized VDO$ for model NC-A5 and the corresponding per fect crystal; (b) contributions of the different types of atoms 18 1.3 Low-frequency VDOS (a) for models NC-A2, NC-A5, and NC-A9,
with deilsities p 0.80, 0.89, and 0.95, respectively; (b) partial VDO$ for the different categories of atoms in sample NC-A5 19 1.4 Low-frequency VDO$ for model NC-A5 (p 0.89) w1 and w2 are
the crossover frequencies between regimes I and II, and II auJ III, respectively. The unes are linear fits to the VDO$ in regimes I auJ
III 20
1.5 The coefficient k1 as a function of density for the total VDO$ of the
two NC models 24
1.6 The coefficiellt k3 as a function of density for the total auJ the partial VDOS of the two NC models. Inset : k3 vs. deiisity for the total VDOS 25 1.7 The frequency w1 as a function of density for the total VDOS of the
two NC models 2$
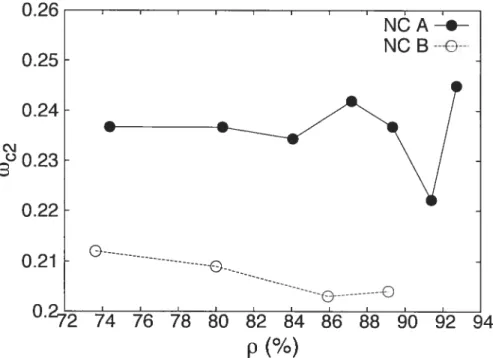
1.8 The frequency w2 as a function of density for the total VDO$ of the
two NC models 29
1.9 U as a function of demisity for the total auJ the GB VDO$ of model NC A, con;pared with the acoustic fractal dimension Dac (sec text
1.10 Relative mimber of excess modes compared to the perfect crystal for two NC models with different densities : 0.84 (NC-A3) and 0.96
(NC-A10). The value ofw1 is for model NC-A3 31 1.11 Norrnalized VDOS of sample NC-B3 obtained by the Green’s func
tion method. The partial VDO$ for GB atoms is separated into
fully-coordinated (Z 6) and undercoordinated (Z < 6) atoms. . 32
1.12 011-site VDOS for a selected part of sample NC-B3 in regime II (top,
w = 0.15) and regime III (bottom, w = 0.55). The atoms are shaded according to the value (ou a logarithmic scale) of the local VDOS. The scale goes from blue (low on-site VDOS) to red (high on-site
VDO$) 33
1.13 Contribution ratio for a randomly-selected region of models NC-B3 and NC-B6 as a function of frequency. We is defined as in section
1.3.1.2 for model NC-B6. The upper two curves are for atoms located at, or near the surface of pores, while the bottom two curves are for atoms at grain boundaries which are lot associated with free area.
The une is a guide to the eye 35
1.14 Normalized contribution ratio for part of model NC-B3 as a function of the frequency. The lines are natural spline approximations to the
data 36
IV.1 Exemple des paires atomiques possibles (pour l’atome central) sur un réseau triangulaire. Paires 1201 : atomes A, B, C, D, E, F; paires 2101 : atomes 1, 3, 6, 7, 10, 12; paires 2211 atomes 2, 4, 5, 8, 9,
LISTE DES TABLEAUX
1.1 Initial configurations for the aggregation of nanoparticles into nano
crystalliiie materials; r is the radius of the clusters, N1 the number
of chisters, and Nat the number of atoms in the clusters. On average,
‘ 8.4 and
N
223 for NC-A, ancl 9.4 and Nat 278 for NC-B 131.2 IViaxirnum applied pressure Pmax and relative density p of the samples
LISTE DES ANNEXES
Annexe I : Dynamique moléculaire 51
1.1 Formalisme 51
1.2 Simulations dans l’ensemble (T,P,N) 52
1.3 Détails de calcul 54
Annexe II : Méthode de confection des matériaux nanocristal
lins 56
11.1 Approche expérimentale 56
11.2 Implémentation numérique 5$
Annexe III Méthodes de calcul de la densité d’états vibration
nels 60
111.1 Transformée de Fourier de la fonction d’autocorrélation des vitesses 60
111.2 Méthode des fonctions de Green 62
NOTATION
CNA : Gommon Neighbor AnaÏysis DM Dynamique Moléculaire
xiii REMERCIEMENTS
J’aimerais tout d’abord remercier mmi directeur de recherche, Prof. Laureit J. Lewis, potir la proposition du projet, puis pour son aide et son soutien.
Merci aussi à Dr. Raif Meyer pour ses commentaires constructifs tout au long du projet et à Dr. Danny Perez pour les discussions intéressantes et ses grandes coniiaissances informatiques.
Enfin, je suis aussi reconnaissante à ma famille et mes amis tout simplement pour être là.
INTRODUCTION
La physique à l’échelle du nanornètre revêt un caractère particulier. Par conven tion, on définit un nanomatériancomme étant un matériau possédant une longueur d’échelle caractéristique de moins de 100 nanomètres environ. Ce domaine a été le
sujet d’intenses recherches ces dernières années de par son intérêt technologique.[1]
Par exemple, un des premiers usages des nanomatériaux a été comme catalyseur,t2] puisque le pius grand ratio d’aire de surface versus le volume fait en sorte d’aug menter l’activité chimique.
Parmi cette classe de matériaux, on retrouve les matériaux nanocristallins, c’est-à-dire des matériaux polycristallins avec des grosseurs de grains en-deçà de 100 nm, qui font aussi l’objet de maintes recherches, dans le but notamment d’exploiter leurs propriétés mécaniques et vibrationnelles uniques. Leur intérêt vient du fait que la réduction de la grosseur des grains à l’ordre du nanomètre leur confère des propriétés physiques différentes, une des raisons étant que le volume des régions interfaciales entre les grains (i.e. les joints de grain) devient une fraction importante du volume total. Une caractéristique intéressante réside dans le fait que leur ordre cristallin est intermédiaire entre celui des matériaux amorphes (ordre aux premiers voisins) et des matériaux cristallins (ordre à longue portée) ; il est de l’ordre de la taille du grain.
En particulier, il a été trouvé que ces matériaux ont des propriétés différentes d’un matériau polycristallin ordinaire, i.e. les métaux ont une plus grande dureté et sont plus cassa.nts, et les céramiques sont plus ductiles.[1] Ils possèdent par ailleurs
des propriétés thermiques exceptionnelles, dont un excès dans la chaleur spéci fique à basses températures,t35] une température de Debye plus basset61 ou bien un paramètre de dilatation thermique plus grand. [71 Des mesures du facteur de Debye Waller ont aussi indiqué que les atomes dans les matériaux nanocristallins avaient de plus grands déplacements thermiques en moyenne.18’91 D’ailleurs, ces propriétés ou quantités dépendent de la taille des grains. L’exemple le plus parlant de ceci est l’observation que la dureté des matériaux nanocristallins varie comme l’inverse de
2 la racine de la taille des grains, ce qui est dû à l’immobilisation des dislocations
aux joints de grains, un phénomène connu sous le nom d’effet Hall-Petch, observé aussi pour les matériaux polycristallins. Or, en réduisant la taille des grains sous
une valeur critique dans le régime nanométrique, des processus de glissement entre les grains diminuellt cette dureté ce qui donne lieu à l’effet Hall-Petch inverse, i.e. la dureté diminue en réduisant la taille des grains.
Ainsi, une des raisons expliquant ces propriétés non-conventionnelles repose stir la plus grande densité d’atomes aux joints de grain, ce nombre augmentant en dimi nuant la taille des grains. En effet, pour des matériaux avec des tailles de grain entre 5 et 10 nm, le pourcentage d’atomes situés aux joints de grain varie entre 15 97o et 50 [21 Cependant, il a été montré que les matériaux nanocristallins ne peuvent pas être caractérisés seulement pas la taille des grains, car d’autres paramètres struc turels jouent un rôle important dans le comportement mécanique et vibrationnel. En particulier, il a été mis en évidence que leurs propriétés thermodynamiques dépendent aussi de la micro-tension (qui dépend des procédures de confection du matériau), suggérant ainsi l’importance de la structure des joints de grain.[7] Bref, pour expliquer leur comportement différent de celui des matériaux avec des tailles de grain conventionnelles, il est important de comprendre les propriétés des atonies situés aux joints de grain.
Conséquemment, modéliser à l’échelle atomique constitue un choix intéressant puisque cela permet de déduire et de comprendre à partir du niveau microscopique les propriétés observées au niveau macroscopique. D’ailleurs, la dynamique molécu laire à grande échelle s’est avérée un outil très utile pour l’étude à l’échelle atomique de la structure et des propriétés mécaniques dans les matériaux nanocristallins.[b012[
En effet, puisque les grains sont de l’ordre du nanomètre, il est maintenant possible de simuler atomiquement des systèmes contenant plusieurs grains.
D’autre part, la dynamique et les propriétés thermodynamiques à température finie d’un solide dépendent des vibrations du réseau, qui sont reliées aux phonons. Donc, une étude de la dynamique vibrationnelle, et plus précisément de la densité d’états vibrationnels (VDOS), est de première importance pour la compréhension
3 de propriétés telles la dilatation thermique, la capacité calorifique, la conductivité thermique ou bien l’entropie vibrationnelle.
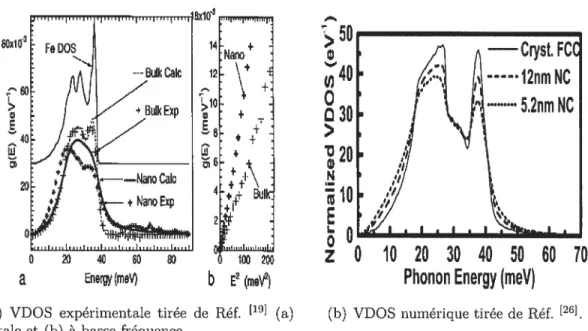
C’est pourquoi, dans ce travail, on s’intéressera aux propriétés vibrationnelles des matériaux nanocristallins en calculant numériquement, à l’aide de simulations de dynamique moléculaire, leur densité d’états vibrationnels, dont un comporte ment anormal a été montré dans la littérature ces dernières années. En effet, il a été établi que la VDOS montre une augmentation des modes de basse et de haute fréquences comparativement à ce qu’on observe pour le même matériau cristallin. Ceci a été établi expérimentalement via des mesures de diffusion inélastique de neu trons ou de rayons
x,’3—20
puis numériquement.2126] La figure 1 montre ce qui y était obtenu. Il a été suggéré que les modes excédentaires à haute fréquence étaient imputables à un temps de vie plus court des phonons, causé par l’interaction de ceux-ci avec les joints de grain.]’4’15,19]11 a aussi été montré que ces modes excé dentaires de haute fréquence étaient spatialement confinés dans les joints de grain à des sites atomiques ayant une coordination réduite.27 Le comportement à haute fréquence est donc plutôt bien compris, tandis que le comportement du spectre à basse fréquence n’est pas encore bien expliqué.
En effet, il a été proposé que les modes excédentaires provenaient des atomes avec des coordinations réduites, c’est-à-dire qui sont situés aux surfaces et/ou dans les joints de grain. Des études expérimentales comparant l’augmentation des modes avec la diminution de la taille des grains suggèraient notamment que, selon le de gré de porosité restante dans le matériau, ces modes provenaient soit des atomes formant les joints de grain,’6] soit des atomes formant les interfaces, c’est-à-dire situés atix surfaces et aux joints de grain.’4’15]
Ttampenau et al., en comparant plutôt la VDOS de modèles nanocristallins de Ni compactés et non compactés, concluaient que les modes excédentaires provenaient des atomes situés aux joints de grain et non aux surfaces, le modèle non-compacté montrant moins de ces modes.’31 Stuhr et al., en parvenant à différencier expérimentalement les contri butions à la VDOS selon l’environnement atomique pour des matériaux nanocris tallins de Pd, ont aussi trouvé que ces modes provenaient des atomes de surface
4
(a) VDOS expérimentale tirée de Réf. [19] (a) (b) VDOS numérique tirée de Réf. [26]•
totale et (b) à basse fréquence.
Figure 1 — Exemples tirés de la littérature de spectres vibrationnels obtenus expé
riment alement et numériquement.
et/ou des joints de grain.[20] De surcroît, une étude par dynamique moléculaire de systèmes nanocristallins Lennard-Jones211 a montré, par analyse des modes à basse fréquence, que ces derniers étaient localisés aux interfaces, mais qu’ils pro venaient aussi de vibrations collectives des grains, comme il a été suggéré et mis en évidence expérimentalement.[1428[ D’autres travaux sont parvenus à séparer la densité d’états provenant des grains et des atomes de surface de nanoparticules métalliques et ont montré que les modes excédentaires étaient localisés spatiale-ment aux surfacesJ22’24] Cependant, les systèmes utilisés dans les éttides numé
riques précédentes[2122[ étaient trop petits pour étudier correctement le spectre à basse fréquence et ne permettaient pas de comparer les résultats avec l’expé rience. D’autres études numériques ont alors considéré de grands systèmes et ont décomposé la VDOS selon les contributions provenant des grains, des joints de grain et des atonies de surface.25’26 Il y était montré que la VDO$ à basse fré quence des atonies dans les joints de grain et des atomes de surface montrait une augmentation de modes importante. La comparaison du spectre entre un modèle complètement dense et un modèle poreux,25l ou bien l’observation que le nombre
20 4 60 lOO2
a
EnergymeV)b
E2(moV2)10 20 30 40 50 60 70
Phonon Energy (meV)
5 de modes eu excès ne variait pas pour deux modèles de densité différente,261 per mettait de conclure que l’augmentation des modes de basse fréquence provenait du grand nombre d’atomes situés aux joints de grain. Plus récemment, des résultats
montrant que la dépendance en pression des modes de basse énergie est la même que celle des modes de phonon dans un cristal permettaient de conclure que c’est la fraction d’atomes aux joints de grain et non leur structure particulière qui est une source générale de l’augmentation des modes.[18] Yue et al. ont aussi regardé le spectre à basse fréquence à deux fenêtres différentes en énergie t une à l’ordre du
meV, comme les expériences précédentes, puis une autre à l’ordre du jteV qui mon trait une augmentation moindre de modes, ceux-ci étant alors associés à des modes coopératifs de grande longeur d’onde.’71 En résumé, il ll’y a pas consensus sur la provenance des modes excédentaires à basse fréquence, c’est-à-dire s’ils sont plutôt reliés au plus grand nombre d’atomes formant les joints de grain et/ou d’atomes situés aux surfaces, ou bien s’ils doivent être principalement associés à des modes collectifs entre les grains.
D’autre part, pour tin matériau cristallin, on s’attend à ce que la densité d’états obéisse à une loi de puissance à basse fréquence d’exposant n=d — 1, où cl est la
dimension euclidienne du système; c’est la loi de Debye.[29[ La majorité des études expérimentales retrouvent cette loi.[14,16,18,19] Or, des études de dynamique molé
culaire pour des modèles nanocristallins de Ni et de Cu ont calculé un exposant n 1.5 pour la densité d’états des joints de grain, suggérant ainsi un effet de dimensionnalité rédtute pour la région entre les grains.[25, 261 Ces résultats étaient
renforcés par ne étude suggérant un exposant n 1.22 pour les atomes formant les joints de grain afin d’expliquer la dépendance en température d’expériences Môssbauer pour des matériaux nanocristallins de Fe,t30 puis par une autre qui
calculait une dimension spatiale fractale de 2.4 pour les joints de grain dans des matériaux nanocristalÏins de Pd.[31]
De plus, d’autres travaux ont trouvé que les modes excédentaires avaient une VDOS à basse fréquence d’exposant n = 1, im pliquant citie les matériaux nanocristallins pourraient avoir de nouveaux modes bidimensionnels dus à la nature bidimensionnelle de la surface des grains qui est
6
[20 99 94] . [92 24]
plus importante. Cependant, dans certaines de ces etudes, les resul tats étaient pour un modèle idéal de naioparticules métalliques isolées. Ceci n’est pas vraiment représentatif d’un matériau nanocristallin, les effets dominants dans ces deux matériaux étant dlifférents,[26] puisqu’on peut notamment s’attendre à des couplages inter-grains dans ce dernier matériau.
Bref, il y a divergence sur la provenance des modes excédentaires ainsi ciue sur l’exposant de la loi de puissance de la VDOS à basse fréquence. C’est donc dans ce contexte que nos travaux ont débuté. On entreprend ainsi de décrire complètement la VDOS de matériaux nanocristallins bidimensionnels dans la région des basses fréquences, et ce, en caractérisant le spectre selon les contributions provenant des différents environnements atomiques présents clans ces matériaux. Pour ce faire, une approche numérique ba.sée sur la dynamique moléculaire était de mise (cf. Annexe I), permettant la compréhension de quantités dvllamiques à l’échelle atomique. De plus, puisqu’on ne s’intéresse pas aux propriétés d’un matériau en particulier, mais plutôt à un comportement général, le potentiel de Lennard-Jones a été utilisé pour décrire les interactions atomiques. Ce potentiel, bien qu’il ne permette pas de décrire avec précision les interactions de systèmes réels, a été choisi pour sa simplicité. Il contient néanmoins les caractéristiques essentielles de potentiels interatomiques réalistes et il est correct et utile pour obtenir une comportement qualitatif. On discute d’ailleurs dans la conclusion d’un autre choix possible de potentiel qui serait plus réaliste. D’autre part, le problème majeur des études numériques précédentes résidait dans le manque de qualité statistique pour étudier clairement le spectre à très basse fréquence. Numériquement, une façon de remédier à ce problème consiste en l’augmentation de la taille du système. Or, ily a une limite d’ordre informatique à la taille des systèmes étudiés. Une approche utilisant des systèmes bidimensionnels permet de s’affranchir en bonne partie de ces limites et de considérer des systèmes beaucoup plus gros. tout en conservant des systèmes nanocristallins réalistes. Ce choix a permis de considérer des systèmes de plus d’un million d’atomes avec un t.rès grand nombre de grains, permettant ainsi de voir les effets collectifs et d’avoir une bonne statistiqtie sur la VDOS des atomes qui ne se trouvent pas dans un
7 environnement parfait (i.e. à l’intérieur des grains). De plus, malgré le fait que le spectre vibrationnel à basse fréquence dépende de la dimension spatiale d (i.e. g(w) w’), les résultats devraient aussi être valables eu trois dimensions (en tenant bien sûr compte de la différence). En effet, puisque la VDO$ à basse fréquence suit une loi de puissance ayant la même forme en deux et en trois dimensions et ne différant que dans la valeur de cl, le passage d’une dimension à l’autre devrait être directe. De plus, on s’intéresse au comportement général de la VDO$ à basse fréquence pour différents matériaux nanocristallins (i.e. selon la densité et la taille des grains), ce qui ne dépend pas de la dimension. Bref, les conclusions de ce travail devraient aussi être valides pour des systèmes tridimensionnels.
On présente dans ce mémoire les résultats ainsi obtenus, soit une caractérisation complète et détaillée de la VDOS à basse fréquence de matériaux nanocristallins bidimensionnels. Pour ce faire, une des étapes importautes est de “confectionner” des modèles de matériaux nanocristallins réalistes. L’Annexe II de ce mémoire est vouée à la description et la justification complète de la méthode utilisée. On a ainsi simulé deux modèles nanocristallins différents (avec une taille moyenne de grains différente), chacun d’eux ayant plusieurs échantillons de densités différentes (dans ce travail, la densité est définie comme étant la densité relative, soit la densité du système divisé par la densité d’un système parfait du même nombre d’atonies). D’autre part, la contribution à la VDOS selon l’environnement atomique a été étu diée de façon globale via la transformée de Fourier de la fonction d’autocorrélation des vitesses, puis localement à l’aide du calcul de la fonction de Green à partir d’une méthode récursive (cf. Annexe III).
En particulier, on montre l’existence de trois régimes successifs et distincts dans le spectre à basse fréquence pour des matériaux nanocristallins de densité p infé rieure à une certaine densité critique pt qui sont directement reliés aux différentes longueurs caractéristiques dans ces matériaux. On les caractérise en détails : un premier régime aux plus basses fréquences associé à la limite élastique, où le sys tème peut être vu comme étant purement homogène pour de grandes longueurs d’onde, avec une vitesse du son réduite par rapport au cristal parfait; un régime
intermédiaire associé à des modes inhornogènes de l’ordre de grandeur de quelques grains et, conséquemment, ne variant pas nécessairement avec la fréquence comme
un matériau bidirnensionnel (soit linéairement) un dernier régime, ayant un com portement de Debye, dû à l’homogénéité du système sous des longueurs caractéris tiques de la taille des grains. Le régime intermédiaire disparaît à une densité pour
laquelle le système est suffisamment connecté (soit pour p > p*). On montre aussi
que les modes excédentaires observés dans les deux premiers régimes sont dus à la présence de pores dans ces matériaux tandis que, dans le dernier régime, ils sont plutôt reliés au grand nombre d’atomes situés aux joints de grain. En somme, les propriétés vibrationnelles des matériaux nanocristallins dépendent non seulement de la taille des grains (qui fait varier le nombre d’atomes situés aux joints de grain), mais aussi de la densité du matériau et de sa structure poreuse.
Le mémoire est divisé comme suit. On présente d’abord l’article Low-frequency vibrational properties of nanocrystaltine ‘materials : a two-dimensionaÏ st’udy, sou mis pour publication à la revue Physical Review B. On y décrit de façon succincte le modèle, puis y présentons les résultats et l’analyse qui en a été faite. L’Annexe I présente une revue de la dynamique moléculaire, l’Annexe II l’approche utili sée pour construire les matériaux nanocristallins, l’Annexe III une description des méthodes numériques employées pour le calcul de la VDOS et l’Annexe IV une explication de la technique utilisée pour différencier les environnements atomiques
9 CHAPITRE 1
ARTICLE LOW-FREQUENCY VIBRATIONAL PROFERTIES 0F NANOCRYSTALLINE MA TERIALS : A TWO-DIMENSIONAL
STUDY
Le corps de ce mémoire est coustitué de l’article Lo’w-freq’uency vibratioriatpro
perties of nariocrystattine materiats : a two-dimensionat st’udy soumis pour publi cation dans la revue Physical Review B. A titre de première auteure de cet article, j’ai mis au point la majorité des programmes de simulation et d’analyse utilisés, effectué l’analyse des résultats en découlant, rédigé la première version de l’article et participé au processus d’amélioration de l’article avec les coauteurs, soit mon di recteur de recherche, Laurent J. Lewis, ainsi que Ralf Meyer, anciennement attaché de recherche dans le groupe et collaborant toujours au projet.
ABSTRACT
The low-freqllency vibrational dellslty of states (VDO$) of two-dirnensional naiiocrystalline materials is studied within the framework of rnolecular-dynarnics simulations. The partial VDOS for different categories of atoms (as determined from their local ellviromrlents), as well as the local (on-site) VDO$, are calculated. It is shown that the low-frequency spectrum exhibits a seqence of three distinct regirnes below a critical density a direct consequence of the length scale separation in the material: a flrst regirne, at the lowest frequencies, correspondillg to the elastic lirnit; a second (intermediate) regime, associated to the weak connectivity of the material under p, and which does not necessarily show a two-dirnensional behavior; a third regirne, associated with grain modes and characteristic of a usual Debye solid. The intermediate regime is found to disappear above p. It is further demonstrated that the excess vibrational modes in the upper low-frequency regime arise rnainly from grain-boundary atoms, whule the other two regirnes are related to the presence of pores in the materials.
1.1 Introduction
It is well known that nanostructured materiaÏs possess unique mechanical and structural properties. For example, the large proportion of grain boundaries in na nocrystalline (NC) materials obtained by assembling a large number of nanometer scale grains influences thermal quantities such as heat capacity, vibrational entropy, and Debye temperature. Knowledge of the vibrational density of states (VDO$) is crucial to understanding these novel properties. It has been establi shed experirnentallyt1320 and numerically21261 that the VDOS of NC materials is enhanced both at high and at low frequencies compared to their bulk coun terparts. The excess modes at high frequencies have been attributed to phonon lifetime broadening’4’15, 19J and shown to originate from strongly localized vibra
II well understood; in particular, there is no agreement on the precise value of the exponent of the observed power law behaviour of the low-frequency VDO$. These modes have been shown to originate from vibrations of atoms at surfaces22’24J
or at grain boulldariesflS,25,261 Also, it lias been proposed that the low-frequency VDOS of the excess modes scales either linearly with frequency,[2O2224] or with an exponent between one and two,23’251 suggesting a reduced dimensionality effect. Other studies have however found the low-frequency VDO$ to obey the “normal” Debye behavior, g(w) w1, where d is the spatial dimension.’4’’6’18’’9l
In the present work we investigate the origiil of the 1ow-frecuency excess modes as well as the specifics of the power-law behavior. To this effect, we constnicted and studied, using molecular-dynamics (IVID) calculations, several two-diniensional NC models containing ‘ a million atoms or more. The models were obtained by simu lating the aggregation of nanoparticles, thus mimicking preparation by pressure assisted nanoparticle sintering. Our calculations reveal unexpected features. An ticipating our results, we find the low-frequency VDOS to exhibit a sequece of three distinct regirnes. At very low frequencies (“lower low-frequency regime”, lie reafter referred to as “I”), the elastic limit, whereby the system can be regarded as a purely elastic, homogeneous medium, is recovered. In the “intermediate low frequency regime” (“II”), inhomogeneous modes that are not Debye-like are foulld; the extent of this regime decreases with increasing density and its upper liniit is directly related to the grain size. The “upper low-frequency regime” (“III”) is asso
ciated with grain-boundary modes, and scales as a normal two-dimensional system, viz. linearly. The existence of these regimes is a direct consequence of the length scale separation in nanocrystalline materials. At sufficiently long wavelength, the nanocrystalline system acts as a homogeneous medium with reduced sound velocity compared to the ideal crystal. As the wavelength approaches the size of the grains, and for systems not too dense, the phonons are strongly affected by the porous structure of the material, giving rise to the intermediate regime. Modes with even smaller wavelength — less than the size of the grains are unaffected by the grain
12 side the grains. The intermediate regime is found to vanish at a density at which the material is sufficiently connecteci. This impiies that not only the grain size, but also the density influences the thermal properties of nanocrystaliine materials.
1.2 Computational details 1.2.1 Model
The VDOS are calculated as described in Section 1.2.2. To generate the tra jectories (in time) required for this, we use IVID simulations. As mentioned above, our NC models are two-dimensional, thus allowing very large systems to be deait with and, as a consequence, much better statistics to be obtained, which turns ont to be crucial for the range of frequencies we are illterested in. While such models are of course not truly representative of real materiais, we expect the physics to be comparable to that of three-dirnensional systems, duly taking into account the dimensionality. Our approach should thus be viewed as “generic”, providing the essential physics underlying the problem, not the details for a particular material. In this same spirit, the atoms are chosen to interact via a Lennard-Jones potential adjusted so as to vanish at the cutoif distance r
4e[()12 — (J)6 — (J)12
+ (-)6j if r < r
ULJ(r) (1.1)
O if r>r,
where e is the weil depth and o- is the atomic diameter; here we set rz=2.5o. In this work, ail resuits are reported in reduced uiits, i.e., e for energy and o- for iength, so
that temperature is expressed in units of e/kB, e/u3 for pressure and (rno-2/e)’/2 for
time. For a typical metal, e 1 eV and o- ‘- 2 — 3 A. Ail simulations were carried out with a timestep of 0.01
(
2 fs) and at T 0.025 300K). The Parrinello Rahman321 and Nosé-Hoover331 algorithms were used to simulate constant pressure and constant temperature conditions.13
NC-A : 1,413,988 atoms NC-B : 999,720 atoms
T Nci r Ni 1at
5 1270 73 6 720 105
8 3810 182 9 2160 236
12 952 414 13 540 490
16 318 735 17 180 832
Tableau 1.1 — Initial configurations for the aggregation of nanoparticles into na
nocrystalline materials; r is the radius of the clusters, N1 the number of clusters,
and Nat the number of atoms in the clusters. 011 average, 8.4 and Nat 223 for NC-A, and 9.4 arid ‘at 278 for NC-B.
pressure-assisted nanoparticle sintering, is similar to that described in Ref. [261 First, we generated a number of isolated cirdular nanoparticles of various sizes (see below) on a perfect triangular latice and equilibrated them at T = 0.025 during 75000 steps. The nanoparticles were then distributed (with random orientations) in a square box having twice the area of the correspoilding crystalline lattice, making sure that they do not overlap. Compaction then proceeded as described below. Two different samples (“NC-A” aid “NC-B”) were constructed, as summarizeci in Table 1.1; these contain 1,413,988 and 999,720 atoms, respectively. The initial
distributions were chosen to be sirnilar to the experimental situation (adapted to 2D systems). We note that, on average, the grain size in sample NC-A is smaller than
in NC-B; the difference will be used below to characterize the varions frequency regimes.
The NC models have been compacted to realistic densities. In both cases (NC-A and NC-B), we first carried out a 50,000 simulation-step run followed by a “preden sification” run at pressure P = 0.07
(
70 IVIPa) for a further 50,000 steps. A series of intermediate configurations, at varying densities, was then generated as follows first, the systems were run at increasingly large pressures Pmax (cf. Table 1.2) during100,000 simulation steps, in each case restarting from the previons configuration. Next, for each intermediate configuration (i.e., each value of Pmax), the pressure was gradually reduced to zero in steps of 0.05, running over 2500 timesteps in each
14
NCA NCB
sample p sample Pmax P
Ai 0.2 0.74 Bi 0.2 0.74 Al.l 0.33 0.77 B2 0.4 0.80 A2 0.4 0.80 B3 0.6 0.86 A2.l 0.5 0.82 B4 0.9 0.89 A3 0.6 0.84 B5 1.2 0.92 A4 0.8 0.87 B6 1.5 0.94 A5 1.0 0.89 B7 1.8 0.96 A6 1.2 0.91 B8 2.2 0.97 A7 1.4 0.93 - - -A8 1.6 0.94 - - -A9 1.8 0.95 - - -AlO 2.0 0.96 - - -A13 2.5 0.97 - -
-Tableau 1.2 — Maximum applied pressure Pmax aiid relative density p of the samples
collsidered iII the present stuclv.
case. Firially, the moclels were relaxed at zero pressure during another 100,000 si mulatioii steps. The coufiguratioiis so obtained are listed iii Table 1.2 where we also give the relative density p, that is the actual deiisity of the system divided by the density of the corresponding crystalliiie material. The resulting nanocrystalline systems are “realistic” in the seiise that they exhibit a porous structure qtute similar to that observed experimentally; in particular, the porosity is found in real samples
(consoliclated from clusters at room temperature) to vary hetween less than 5% to about 25/o.
1.2.2 Calculatiori of the VDOS
The VDOS were calculated in two different ways. First, we used the Fourier
transforrn of the velocity auto-correlation function (VACF) : [31
15
The VACF was extracted directly from the MD simulation; in practice, we avera ged over 2048 configurations (NC-A) or 4096 configurations (NC-B), and over 15 different runs (consecutive MD simulations) in order to obtain reliable statistics. The contributions to the VDO$ may be sorted according to the local environments of the atoms. Here, each atom was given an “environment label” determined using the common neighbor analysis (CNA) method “perfect” for atoms with a perfect triangular environment at least up to second nearest-neighbors; “good” for atoms which are perfect up to first nearest-neighbors only; “surface” for atoms with a coordination number Z < 5; atoms that do not fit in any of these categories are labelled “GB” (grain boundary). Figure 1.1 shows the results of these assignments for a typical configuration (part of the NC-B4 sample).
The VACF method however does not easily allow investigating the local (on site) VDOS associated to particular atoms. In order to do this, we used the on-site Green’s function method and a recursion technique, as was done previously for the high-frequency spectra of nanocrystalline materials.[27] We briefiy recall the Figure 1.1 — Part of the NC-B4 sample (relative density of 0.89) showing the dif
16 rnethod361 here. The Green’s operator for frequency
w
is given by[Ô](w) =
[(w2Î
-b)-’],
(1.3)where
Î
is the identity matrix andb
the dynarnical matrix of rank 2N, N being the number of atoms in the system. The indices,u
and t” represent the phononpolarization directions, and i and
j
vary from 1 to N. This operator is relateci to the local density of states gj(w) as followsgj(w) = — lim Im[G(w2 + ic)]. (1.4)
It can be shown that the on-site Green’s function of a particular atom i, G, can be written approximately as an n-level continued fraction
G(w) 1 (1.5)
b22
w2_a_1_bt(w2)
where
t(w2)
is the square-root terrninator371 given byt(w2) =
[(w2_aœ) - - (w2_aœ)2]
(1.6)
The coefficients a and b are, respectively, the diagonal and off-diagonal elements of the tridiagonal symmetrical forrn of the dynamical matrix, obtained using the Lanczos algorithrn,[381 while a and bœ are the valiles of a and b after n iterations, with n < 2N. The initial state (of norm ullity) for starting the Lanczos’s algorithrn is set to
= (0, ..., 0, 1,0,
..., )T
(1.7)
17 which the on-site VDOS is sought. The use of the square-root terminator is moti vated by the convergence (in less than n iterations) to finite values of the a and b, So that the coefficients a auJ b forp > n can be replaced by a and bœ. In prac tice, we set n = 5000; such a high value is necessary to recover the low-frequency elastic limit acdurately. The coefficients a and bœ are taken by averaging over the last hundred values. In order to eliminate as much as possible the “contamination”
from finite-temperature contributions, the atomic positions are first relaxed to their
local minima using molecular statics.
1.3 Resuits
1.3.1 Low-frequency VDO$
1.3.1.1 General features
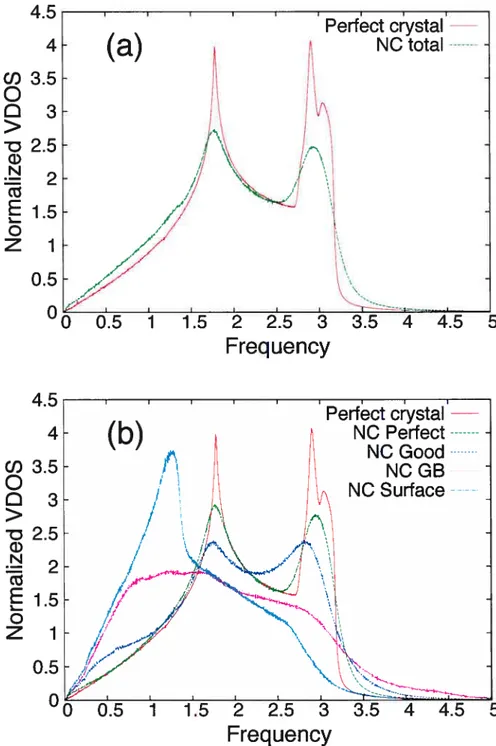
We discuss first the overail features ofthe VDOS obtained by the Fourier trans form method. Figure 1.2shows the total VDQS as well as the contributions from the different types of atoms in model NC-A5. which is typical of our set of samples. For comparison, the VDO$ of a perfect crystal (triangular lattice) containing approxi mately the same niimber of atoms is also shown. The resuits are consistent with other studies.251 As expectecl, the partial VDOS for “good” atoms is intermecliate between that for “perfect” auJ “GB” atoms; within the interior of the grains, the VDO$ is similar to that for the bulk crystal. [In this and other figures, “frecuency” is definecl as w/(2-ïr).]
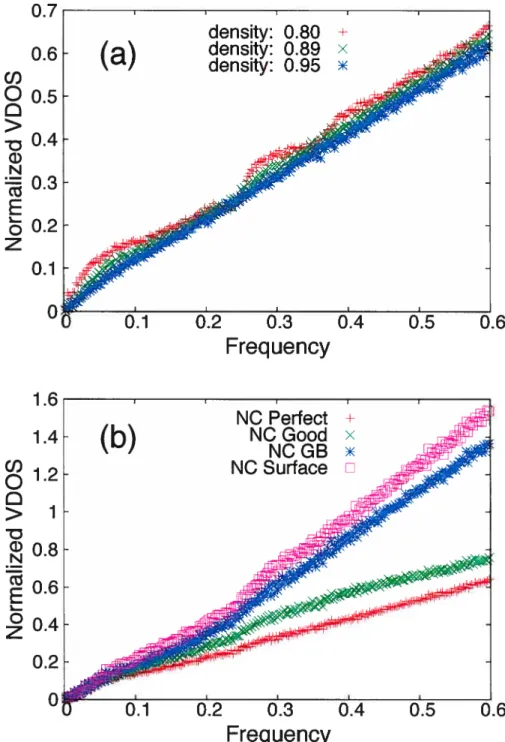
We focus now on the low-frecuency part of the vibrational spectrum, displayecÏ in Fig. 1.3(a) for three different samples (NC-A2, NC-A5, auJ NC-A9, with densities p = 0.80, 0.89, and 0.95, respectively), auJ in fig. 1.3(b) for sample NC-A5 for the different categories of atoms. We find that below some “critical” density p, the low
frequency VDO$ exhibits three distinct regimes which we will refer to as “lower”, “interrnediate”, and “upper” (or as “I”, “II”, and “III”), respectively; this is shown more clearly in fig. 1.4 for sample NC-A5. For oui two nanocrystalline mortels, we estimate that p is about 0.93. Above p, the intermediate regime vanishes.
18 4.5 4 2 1.5 1 0.5
o
0) 3.5o
03 > t 2.5 Q) N ceo
z
Frequency
4.5 C/) 3.5o
O > t 2.5 Q) Nce
o
z
0.5 2 2.5 3Frequency
Figure 1.2 — (a) Normalized VDOS for model NC-A5 aud the corresponding perfect
0.7 0.6 1.6 1.4 0.6 0.4 0.2 0 19 U) 0.5 > D 0.4 G) N 0.3
o
z
0.2 0.1Frequency
o.
Û >1 -c3 0.8 c oz
0.3Frequency
Figure 1.3—Low-freqiiency VDO$ (a) for inodels NC-A2, NC-A5, and NC-A9, with
deilsities p = 0.80, 0.89, and 0.95, respectively; (b) partial VDO$ for the different categories of atoms in sample NC-A5.
20 U)
o
0.5 > - 0. G) N 0.3o
z
.6 0.7 0.6 0.2 0.1Frequency
Figure 1.4 Low-frequeiicy VDOS for model NC-A5 (p = 0.89); w1 and w2 are the crossover frequencies between regimes I and II, and II and III, respectively. The unes are linear fits to the VDO$ in regimes I and III.
21 This behavior is observed for the total VDO$ as well as for the different categories of atoms, as cari be seen in Fig. 1.3(b). The VDOS in regimes I and III scales lirieariy with frequency for ail the NC models, as illustrated in Fig. 1.4 ; the behavior of the intermediate regime will be disdllssed in the next section. For regime I, the linear dependence is related to the fact that, at low frequency, vibrations are expected to be long-wavelength, acoustic waves, auJ thus to scale as w1, U being the spatial dimension of the system. As for regime III, it will be shown beïow that the low-frequency bound (wC2) is deterrnined by a characteristic length of the
size of the grains. We thus expect the system to behave like a continuons elastic body below this length scale, and the VDOS in regime III to exhibit a Debye behavior, as we indeed observe. In presence of structural disorder, this description in terrns of continuum elasticity must break down at sonie scale associated with the characteristic length below which there are inhomogeneities in the displacement field.t39’401 Actually, the translational invariance necessary for continuum theory to apply is lost due to the strong anisotropy of the system at some length scale, which gives rise to the intermediate regirne (II) ; there is consequently no reason to believe that the observed intermediate regime in the VDOS of ouï nanocrystallirie models should also scale linearly.
This pattern the scale separation in the low-frequency VDOS—shows simila
rities with the dynamics of some disordered solids (e.g., aerogels,[4142] powders,[43451 janimed packings of particles,[46] fractal aggregates,47l auJ amorphous materials[39’401). In some of these cases,41’42’45’471 the results are well accounted for by the fracton theory,[481 which shows that there is a crossover in the VDO$ from propagating pho nons to more localized modes called fractons. For powders, which possess unusual thermal properties at low temperature, Rutherford et aL43 have proposed that the elastic regime exists only for characteristic lengths larger than 20D, D being the diameter of the particles. These authors further assume that there exists inhomoge neous modes on the length scale of a few powder grains that have a constant VDO$, while for length scales smaller than D the modes are again Debye phonons (and the VDO$ scaies quadratically with frequency) ; the nature of the inhomogeneous
22 modes however remains unclear. In contrast, Maliepaard et aL441 proposed that sin
tered metal powders could be clescribed as percolating systems, thus establishing ail analogy between the transition from the elastic regime to the inhomogeneous modes and the fracton edge.
For jammed packing of particles approaching the unjamming transition,[46,49_5h1 it has been showil that there exists a correlation length separating two regimes in the low-frequency VDO$; is found to decrease with density and to diverge at sorne valuePcbelow which the system loses its mechanical stability (jamrning/unjamming transition). At Pc, the low-frequency VDO$ is a non-zero constant (“plateau”) for ail frequencies clown to zero. For p > Pc, the system behaves as a Debye solid at lower frequencies, crossing over to a p-like solid at the frequency associated with . No evidence for a fractal behaviour was found. The plateau of excess low
frequency modes in the VDO$ above Pc lias been related to a particular set of soft modes; it lias been demonstrated that these are a necessary consequence of the weak connectivity[50’511 (related to the number of contacts) of the system. The similarity of these resuits with the pattern observed in otir systems suggests that nanocrystalliute materials could perhaps be regarded as weakly-connected media nical systems, at some length scale greater tian tic grain size and at sufficiently low deuisity. We expand on titis idea in tie next section and dernonstrate tiat titis is indeed tie case.
1.3.1.2 Quantitative analysis
Following the above discussion, we write tie low-frequency VDO$ as
O <w <w;
gLF(w) = k2(w — wi)’ + u; w1 <w <w2 (1.8)
23 where the constants o et 2 are given by
u1 k1wj’, (1.9)
I,. t VI—1
= °l — Wcl)
and and Wc2 are the crossover frequencies defined in Fig. 1.4; Wmax is the
maxi-muni frequency for the low-frequency regime, which we set to 0.6. We denote by d the exponent that describes the power law behavior in regime II, which need not be equal to U. Silice regime II vanishes for systems with densities above p*, U and k2 = k3 in this case. As will be discussed below, the vibrational regimes are associated with different length scales t as follows. For t > , with a characteristic
(or correlation) Ïength of the order of the size of a few grains (a is the size of a single grain), the system behaves as an elastic continuum; this is regime I. For t < o, the
vibrational properties are dominated by single grains; regime III is a “grain-mode” regime. Regime II corresponds to > t > a, and is thus “intermediate”. 0f course,
the crossovers between the various regimes are not abrupt because the grains are distributed in size.
As explained above, regime I is associated with the continuum limit. For a two-dimensional Debye solid we have, for g(w) normalizecl :[29]
k1 (1.11)
where A0 and y8 are the area per atom and the sound velocity, respectively. The
dependence of k1 on dellsity, k1 p_V
(which defines the exponent y), is shown in
Fig. 1.5. The decrease of k1 with density is well accouiited for by the concomitant increase of the sound velocity, u8 p, and the decrease of the area, A0 p’. The same scaling exponent is obtained for our two models, viz. y ‘- 5.4. This is within the range of values for metallic powders (y 3)[44] or liquid argon in the
metallic phase (y Z) (see Ref. [52j and references therein). We note that k1 is the
24
p(%)
2570II I 75I 80I I 85r r 90 95 100 NO • 2 Correlation: v=5.425 NCB O Correlation: v=5.416 1.5k.
- 1•u..
— O Pertect crystal--0.54254.3
4•13544
4•45 45 4.55 4.6 4.65In(p) (¾)
Figure 1.5 — The coefficient k1 as a function of density for the total VDOS of the
two NC models.
the parameter A0 for undercoordinated atoms (data not shown) ky for GB anci surface atoms is slightly larger than for perfect and good atoms. We note also that the value of k1 does not approach that for the perfect crystal in the limit p — 1;
this is due to die fact that it is very clifficult to reach the perfectly-ordered state by compactioii.
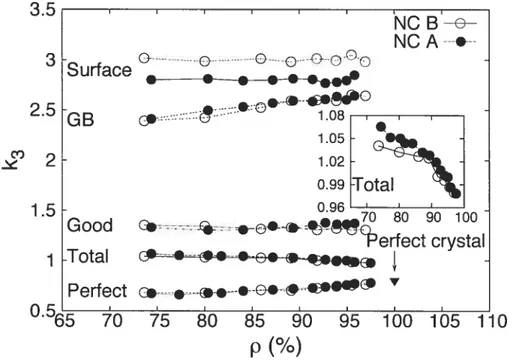
We now turn to the upper low-frequency regirne (III) which spans the largest frequency window. We have seen above that the VDO$ scales linearly with w (for cl 2) in this regime. Figure 1.6 presents the variation of k3 with density. This parameter is essentially the sanie for the two models, i.e., is not affecteci significantly by the size of the grains, except in the case of surface atoms, which is likelv related tothe fact, that the curvature of the grains for model NC-A is on average larger than that in NC-B : it is hideed well known that the morphology of nanoparticles have an effect on their VDOS.531 Also, a smafl enhancement of the modes for the total VDOS in this regime with decreasing grain size is evident from the inset in Figure
25 3.5 3 2.5 GB co -1.5 1 0.56_-_7O 75 80 85 90 95 100 1Ô5 110 p(%)
Figure 1.6 The coefficient k3 a.s a ftmction of density for the total and the partial VDO$ of the two NC models. Inset k3 vs. density for the total VDOS.
1.6; this is directly related to the increased presence of grain boundary atoms in
the model with smaller grains (NC-A), as we discuss below.
The overail value of k3 depends only weakly on density, decreasing slightly; our calculations show that this resuits from the small decrease of the number of GB atoms with compaction, not of the larger variation of the number of surface atoms. For “perfect” atoms, we observe a weak increase, k3 approaching the value for the perfect crystal. By analogy with the Debye theory [cf. eq. (1.11)], this could indicate that the interatomic distances for perfect atoms increases with compaction, suggesting a reduced stress inside the grains due to the increase of the grain size and the transformation of free surfaces into grain boundaries at higher densities. The value of k3 for GB atoms exhibits a larger variation with p. As we will see in
section 1.3.2, the low-frequency VDO$ for properly-coordinated GB atoms (Z = 6) is substantially larger than that for under-coordinated GB atoms. The number of these respectively increase and decrease with density, thus accounting for the
NO B-e— e-NO A ---. Surface ________________ .—... 1.05 1.02 0.99 [Total Good 80 90 100
Total 9erfect crystal
26 ohserved variation of k3. This is consistent with the observation that the thermal properties of NC materials not only clepend on the graill size, but also on the inicrostructure (or the clensity) of the grain bomidaries.7
The lower frequency lirnit of regime II, w, corresponds to a correlation length
of the order of the size of a few grains, as can be decÏuced from the value of the sound velocity in regime I. (In contrast, as we will see helow, Wc2 corresponds to a
correlation length the size of a single grain.) The system is quite inhomogeneous On this scale and there is conseqiiently no reason to believe that regime II may be described by a linear power-law scaling as is the case of regime I. The frequency w is thus associated to the length scale at which continuum theory ceases to apply; as in the case of jammed packings of particles,[4650[ it should therefore scale with p. This is verified iII Fig. 1.7 where wi is shown to be well described by a
power-law dependence on p, wi pX, with depending only slightly on grain size (XNc—A = 4.28 and XNc—B = 4.55). From the dispersion relation for phonons[54[ Ive can write , with y5 the sound velocity. shonld therefore he a littie
smaller for NC-B than for NC-A since the latter lias smaller grains alld a few grains ; tins is indeed what Ive filld. From the above relations we have
_(2X+1)
(1.12)
For our two NC niodels, we obtain p, with r 2.2, consistent with the fact that the correlation length decreases with density.[40] As a consequence, we would
expect to diverge as clensity is lowered, as also suggested for jammed packings of partic1es.46 In practice, we do not have a clensity at which diverges [i.e., for which
g(w) O at w = O1[5h] because the density of our systems is still well above the value for mechanical stability to break down. Que may conjecture that wi could possibly be associated with the theoretically predicted11 “transition” from phonoiis to fractons; we will see below that this is not the case here.
We 110W turn to the crossover from regime II to regime III. w2 corresponds
27 associated with grain modes. The dependence ofWc2 on density for our two farnilies
of samples is displayedlii Fig. 1.8. We find, indeed, that Wc2 is smaller for the sample
with larger grains (NC-B). We observe, further, that w2 is essentially constant with
density, except perhaps for a small drop at larger values of p which likely resuits from the coalescence of grains upon compaction.
As a final point coilcerning the w’s, we note in Fig. 1.3 the presence of “humps”
upon going from one regirne to another; these are related to the coexistence of two regimes about the crossover frequencies. In particular, the hurnp at Wc2 is due to
the fact that the distribution of graill sizes lias a fuite width. These humps become less important with increasing density because the intermediate regirne becomes less important. We define We as the frequency at which the coexistence ceases for
the crossover between regimes II and III; at sufficiently high density, We= Wc2.
We consider now the variation of
J,
with density; this is shown in Fig. 1.9 for model NC-A (for which statistics are better), for both the total VDOS and the GB VDOS.J
does not differ appreciably from d (=2), but there is nevertheless a non-trivial increase with density, indicating a small dependence on the micro-structure. We can relateJ
to the spectral dimensionJ,
that is the generalization of cl (Euclidean dimension, here 2) to non-crystalline structures; this is equivalent[48] —
to the fracton dimension for fractal systems. The fracton theory provides d= (with
J
< cl), where Df is the fractal dimension and is a constant related tothe nature of the fractal, or more precisely to the scaling exponent for diffusion. Chadwick301 proposed that the VDOS of nanocrystaffine iron could be described in terms of fractous, implying of course that the atomic structure is itself fractal. Our resuits for cl are no evidence for a fractal structure. However, as far as vibrational properties are concerned, the relevant length is the acoustic correlation length and the relevant fractal dimension is the acoustic fractal dimension, which is associated with the connectivity of the structure rather than the mass distribution.[42] J is
thus reasonable to relate the connectivity to the porous structure of our NC mate riais. We therefore calculated this quantity in order to obtain the acoustic fractal dimension Dac (see Appendix A for cletails). From Fig. 1.9 it appears that Dac
28
p(%)
-2 4 70 75 80 85 90 95 100 -2.6 NCA • 2 8 Correlation:x=4.28
-NOS O ci Correlation:x=4.55
.. •-- .0 Q ---3-3.4 rn___--. -- O -38 -4 .... .. -4.2 4•.3 4.•35 44 45 4.55In(p) (¾)
Figure 1.7 — The frequency wy as a fullctioll of density for the total VDO$ of the
two NC models.
scales the sarne way as with p, i.e.,
J
=with d approxirnately the sarne for ail densities as in Ref. [41] However, the variations in d are too small to conclude unambiguously that this relation is valid, i.e., that fracton theory applies in the present case.
As for the coefficient k2, we lirnit our discussion to the qualitative observation that it clearly increases with density (cf. Fig. 1.3). In short, the intermediate regime is “abnormal” and related to illhomoge;eities in the structure. It is difficult to assess how it changes exactly with density and what happens when regirne II vanishes becatise there are many parameters that change sirnultaneously with p [in particular
J,
and the widths of the crossovers (or humps) between the three regimes]. To summarize this section, we have shown that regimes I and II depend strongly on density, while regime III does not. This can also be seen in Fig. 1.10 where we plot the relative number of excess modes (compared to the crystal) for two NC-A samples. This figure also clearly demonstrates that the number of excess modes is29 0.26 -0.25 0.24 0.23 0.22 0.21 0.27
p(%)
frequellcy Wc2 as a ftmctioll of density for the total VDO$ of the
2.15 — 2.1 2 1.95 1.9
NÔA-.-NC B
---e--c.J Qs
figure 1. $ The two NC models.e
-c
74 76 78 80 82 84 8688
90
9294
NTotI—é— NO GB --e--c2.05 o q) C G)E
74 76 78 80 82 84p(%)
I I 86 88 90 92 94Figure 1.9 —
J
as a fuuction of density for the total and the GB VDO$ of model30 larger for lighter materials in regimes I and II, whule the differences are very smalÏ in regime III (and have been attributed above to the small decrease in the number of grain botmdary atoms upon compaction). We sec, further, that g(wc2) is the
same for both densities {see also Fig. 1.3(a)]. The variation of g(w) with density in regime I is well explained by the increase of the sound velocity with increasing density. In regirne III, the number of excess modes does not depend strongly on density, in agreement with earlier results[l$261 that show that the enhancement of low-frequency modes in nanocrystalline materials is due to the larger proportion of grain boundaries in comparison with polycrystalline materials the nature of the grain boundaries in nanocrystalline materials is not fundamentally different in terms of the degree of disorder from that of polycrystalsti°] and not to some surface effects. However, we have demonstrated that, at very low frequencies, such surface effects do exist (if only because of variations in the velocity of sound). Actually, the weak connectivity of nanocrystalline materials (proportional to the degree of compaction) under p, on the scale of a few grains, strongly influences the behavior and the number of excess modes in the intermediate regime (II), as demonstrated by Wyart et aÏi50] for jammed packing of particles (or amorphous
solids). Thus, we may speculate that regime II vanishes at the density at which the nanocrystalline material is sufficiently connected (i.e., the porous structure becomes negligibly small) that it behaves as a two-dimensional solid.
1.3.2 Local (on-site) VDOS
From the above discussion, we are led to conclude that the vibrational modes in the intermediate regime are strongly influenced by the porosity of the material. In order to assess this, we computed the local (on-site) VDOS, which provide a de tailed, atomic-level picture of the distribution of excess modes. Figure 1.11 shows the VDO$ obtained using the Green’s function method for different types of atoms (averaged in each case over 1000 atoms chosen at random). The resnlts are nearly identical to those obtained using the VACf method (cf. Fig. 1.2), except for the high-frequency tail which results from anharmonic terms in the finite-temperature
31 U) G)2.5
o
E
U) U) G) Q X G) G) > .4-G) I. 3 2 1.5 1o
.5Frequency
Figure 1.10 — Relative iiurnber of excess modes compared to the perfect crystal for
two NC models with differeut deiisities 0.84 (NC-A3) and 0.96 (NC-A10). The value of is for model NC-A3.
32 3.5
o
2.5 > G) N 1.5 01z
0.5 0Figure 1.11 —Normalized VDOS of sample NC-B3 obtained by the Green’s function
method. The partial VDOS for GB atoms is separated into fully-coordinated (Z = 6) aiid undercoordinated (Z < 6) atoms.
MD calculations as noted earlier. We also note that the low-frequency VDO$ for the GB atoms with perfect coordination (Z = 6) is larger than that for undercoor dinated atoms.
We present in Figure 1.12 the on-site VDOS for a selected part of the NC-B3 model, and for phonon energies in regime II (top) and far in regime III (bottom). The atoms are colored according to the logarithm of the value of the VDO$ (see caption). These plots provide a summary of our earlier qualitative observations. In the intermediate regime (II), the modes tend to be more intense near the surface of the pores; in the upper regime (III), while stiil intense at the surface, they are also strongly present in grain boundaries not associated with the pores (i.e., free area). Thus, the intensity of the modes near the pores in regime III decreases with increasing frequency.
In order to quantify these observations we may calculate the relative contribu tion of selected atoms to the VDO$ for ftxed w; for this purpose, we introduce the
33
Figure 1.12 — 011-site VDOS for a selected part of sample NC-B3 in regime II (top,
w = 0.15) and regime III (bottom, w = 0.55). The atoms are shaded according to the value (on a logarithmic scale) of the local VDO$. The scale goes from blue (low on-site VDO$) to red (high on-site VDO$).
34 “contribution ratio”, which we defiuie as
- Zgk(w)
N
t)
g(w)
where gj(w) is the on-site VDO$ at site i for frequency w, N is the total number of
atoms, auJ k represents the atoms for which the relative contribution to the total VDO$ is sought. The resuits are presented in Fig. 1.13 for two NC-B models, below auJ above the critical density. The upper two curves give the relative contribution
of the atoms located at, or near tfirst and second neighbours) the surface of pores, while the bottom two curves are for atoms at grain boundaries which are not associated with free area. The calculations were clone for exactly the same region of the two samples; the results are robust with respect to the definition of near-surface atoms ti.e., whether we iiiclude first, second or third neighbours from the surface) and are reproducible for other (randornly-selected) regions of the models. It is clear from this figure that the contribution ratio of the modes at grain boundaries which are notassociated with free area increases with frequeiicy. In contrast, the intensity
of the modes near pores begins to decrease at some frequency close to the onset of regirne III, after reaching a maximum value near the end of the interniediate regime, w2 or We, the latter being defined as the frequency at which the crossover
(“hump”) ends; We is lower for the denser sample (NC-B6) because the VDO$ does
not exhibit the hump resulting from the coexistence of regirnes II and III.
In order to compare the relative contributions of atoms near a pore with those of atoms not associated with free area, we consider the normalized relative parti cipation ratio, viz. 17/N,, with 1V,-, defined as the number of atoms for which ‘îj is
computed (N 3000 typically) ; the resuits are presented in Fig. 1.14 for model NC-B3. It is quite interesting that the two curves cross at Wc2. This means again
that, in the intermediate regime (II), those atoms (or regions) that have the lar gest influence on the VDOS are those lying near a pore; in contrast, in regime III, the dominant modes are more localized in the grains and in grain boundaries not associated with free area. The fact that the number of such atoms remains
35
o
C” Co
.4--D I- 4-Co
o
1 6Figure 1.13 — Contribution ratio for a randomly-selected region of models NC-B3
and NC-B6 as a function of frequency. We is defined as in section 1.3.1.2 for model
NC-36. The upper two curves are for atoms located at, or near the surface of pores, whiÏe the bottom two curves are for atoms at grain boundaries which are not associated with free area. The une is a guide to the eye.
essentialÏy constant upon increasing the density demonstrates again why k3 does not vary much with density. Actually, there is a sÏight increase with density which is compensated by a more important decrease of the number of atoms neighbo ring pores. Since the number of atoms located near pores decreases with density, it then becomes clear why the weight of excess modes in the intermediate regime also
decreases. $umming up, the porous structure evidently influences the behavior of the low-frequency modes; its impact on the intermediate regime is clearly of great importance.
1.4 Summary
We have studied the low-frequency vibrational properties of model nanocrystal une materials within the framework of molecular-dynamics simulations. We have
36 0.00035 o 0.0003 C 0.00025 -Q 4-C o 0.00015 G) 0.0001 5e-05 o
z
OFrequency
.6Figure 1.14 Normalized contribution ratio for part of model NC-B3 as a function of the frequency. The unes are natllral spiine approximations to the data.
foimd the low-frequency spectrum of these materials to exhibit a sequence of two or three different regimes, depending on density : there exists a critical density p*,
depending onïy slightly on the average grain size, above which the intermediate regime vanishes. This regime, below p, crosses over from the usual elastic solid (regime I) at the frequency at which continuum theory ceases to apply; we have shown that it is intimately related to the weak connectivity of the material on the Ïength scale of a few grains and that it does not show the normal two-dimensional behavior. The third regime is associated with grain modes and corresponds to the usual Debye solid. We have also shown that the excess modes in the last regime are due to the high number of grain-boundary atoms; in contrast, the excess modes in
Acknowledgements
This work lias been supported by grants from the Natural Sciences and En gineering Research Council of Canada (NSERC) and the Fonds Québécois de ta Recherche sur ta Nature et tes Technologies (FQRNT). R.1VI. thanks the Deutsche Forschungsgemeinschaft for support through $FB 445. We are indebted to the Ré seau Québécois de Calent de Haute Performance (RQCHP) for generous allocations of computer resources.
Appendix A: Corrnectivity
We describe here how the connectivity of the NC models is computed. From algebraic topology, it is known that, hi two dimensions, the connectivity number (or Euler characteristic) of a given structure is given by
C=nC—nh, (1.14)
where n and nh, are the number of connected components and the number of holes
(i.e., pores), respectively. If the structure is regarded as a compact object with holes in it, and assuming it is continuous on the atomic scale, then
(
= 1 — n.The acoustic fractal dimension Dac is obtained from the relation In order to calculate n1, (which depends on R), we need to determille the positions of the pores. To do this, we first subdivide the system into small cells (of length 0.28) to each we associate the atom which is closest. These are then used to identify surface atoms and free area. An atom is defined to be at the surface (of a pore) if there exists at least one ceil associated to it at a distance larger than r = 1.075.
A subcell is listed as free area if there are no atom doser than rc. Once surfaces atoms have been identffied, the pores are delimited using the Hoshen-Kopelman algorithm.(561 In order to locate the positions of the pores we identify, for each, that atom that is closest to the center O of the system. The radial distribution nh(R) can then be calculated by counting the number of pores that lie within a circle of
radius R from O.