! " # $ % % & ' & ($ & ! % ) * * * + * * % , * & ! $ # - . * # $ * * / % ) * # * # * & ! % 0 1 $ 23$ 4 $ 05-% 6 1 & ! $ $ $ * " % * " 7 # * " 1 " 7 & 8 9 : ; % ) " # 9 4 ** % % < & '0 < 4 : ($ * * < : % # % = * * %
1
Introduction
The European Union Emissions Trading Scheme (EU ETS) has been functioning since the 1st of January 2005 and has covered around two billion tons of CO
2 emitted by almost 12 000 installations throughout Europe. Among the sectors covered by the EU ETS, the electricity sector is the most important both in terms of European Union allowances (EUA) received and short net positions (i.e. the gap between the sum of allowances allocated to the electricity sector and its emissions). Since CO2 allowances can be valued on the markets, power producers add this new cost to their marginal production cost, whether CO2 allowances are distributed for free or not. The pass-through of CO2 costs increases the electricity equilibrium price in wholesale power markets and creates substantial rents for less carbon-intensive and carbon-free infra-marginal units, i.e. those which generate electricity at a marginal production cost lower than the marginal producer, as far as the marginal unit is a carbon-emitting power plant. When marginal producers pass through the cost of carbon to their prices they also transmit the carbon price signals to the economy, according to the aims of the scheme. Thus, the efficiency of the EU ETS to provide incentives both to power producers and final consumers depends on whether CO2 costs may be passed through to electricity prices or not.
Since the launch of the EU ETS, many concerns have been raised about the behavior of power producers, who have passed through the cost of carbon to electricity prices while they received CO2 allowances for free, and subsequently earned windfalls profits. The economic literature has largely addressed the latter issue in the last years (See Keppler and Cruciani, 2010; Sijm et al., 2006b). Regarding emission costs pass-through issues, some theoretical and empirical studies have sought to estimate the extent to which CO2 prices have impacted electricity prices.
The theoretical basis of the CO2 cost pass-through to electricity prices have been established in the literature particularly by Sijm et al. (2006) and Bocacina and Gulli (2007). Sijm et al. (2006) remind us that under perfect competition, the pass-through rate of carbon cost, i.e. the “add-on rate” should be equal to 100%. However, the effective pass-through rate on electricity markets, called the “work-on rate”, depends
on the demand elasticity and the change in merit order due to the CO2 cost. Thus, the “work-on rate” may be lower than the “add-on rate”. Bocacina and Gulli (2007), develop a theoretical model of carbon cost pass-though under imperfect competition. They show that in case of perfect competition, the marginal producer fully integrates the cost of carbon to power prices while under market power, the increase in electricity prices due to carbon pricing is lower than 100%, unless there is excess capacity and the market share of the greatest polluter is low.
Given these theoretical analysis, there are numerous empirical studies which have evaluated the impact of carbon pricing on power markets during the first phase of the EU ETS. Overall, three different approaches have been used in the literature. First, the CO2 and electricity prices drivers approach (Hintermann, 2010; Alberola et al., 2008; Keppler and Mansanet-bataller, 2010; Levy, 2005) shows that the CO2 price plays a positive and statistically significant role in explaining the observed variations of the wholesale electricity prices during the EU ETS first phase. Second, the error-correction modelization (Zachman and von Hirschhausen, 2008; Fell, 2008; Bunn and Fezzi, 2007, 2009; Fezzi, 2006; Honkatukia et al., 2006) allows the determination of the direction of the correlation and the description of the long-run equilibrium system as well as the short-run dynamics. However, these models do not fit very well to the modelization of the relationship between electricity spot prices and the prices of EUA in levels since the former are often stationary while the latter are not. A last kind of analysis consist in estimating the pass-through rate of carbon costs to electricity prices. This path has been historically explored by Sijm et al. (2006a, 2006a, 2008). In, Sijm et al. (2006a, 2006b) three econometrics models (Ordinary Least Squares, Prais-Winston, and Boostrap) have been estimated to quantify the percentage of the CO2 cost which has been passed-through to forward electricity prices in 2005 both in Germany and The Netherlands. Sijm et al. (2008) extends the analysis of the CO2 costs pass-through to forward and spot markets in nine Europeans countries.
To our knowledge, there are no empirical studies examining the pass-through of the CO2 cost over the second phase of the EU ETS (2008-2012) based on a significant sample of countries. Considering the third approach, we propose a short
theoreti-cal model which induces the possibility of negative pass-through rates in particular. We then develop an econometric model of CO2 cost pass-through to electricity spot prices based on Sijm et al. (2008). Our sample period covers both the first phase of the EU ETS and the first three years of the second phase, i.e. February 2008 to April 2011. We regress electricity spot prices over ten European countries account-ing for almost 80% of the electricity generation from fossil-fuels in Europe in 2007 (European Commission, 2010). We show that while the impact of the CO2 cost on electricity spot prices was relatively strong during the first phase of the EU ETS (2005-2007), the economic crisis, and thus the resulting higher market instability, has perturbed the estimates of the carbon cost pass-through over the second phase (2008-2011). However, regarding the forward electricity market, which is less driven by short terms events than the spot market, it appears that there is clear evidence of carbon cost pass-though to electricity prices over the second phase. Then, taking the compliance periods of the EU ETS instead of the calendar years, this allows us to improve the robustness of the regression and thus enhance the accuracy of esti-mations results. Finally, when we control for exogenous volatility, we demonstrate that in some countries at least, power producers have effectively passed on the cost of carbon to electricity spot prices over the years 2008 and 2010 but not in 2009.
The paper is organized as follows: Section 2 exposes the theoretical framework as well as the empirical model of the CO2 cost pass-through to wholesale electricity prices. Section 3 presents the set of data used in the econometrics estimation and a statistical description of the series. Section 4 discusses the main results of the empirical estimation of the CO2 cots pass-through on spot markets while Section 5 provides alternatives estimates and Section 6 concludes.
2
Models
Here, we introduce the theoretical and empirical basis supporting the pass-through of the CO2 cost to electricity prices under perfect competition.
2.1
Theoretical framework: the marginal abatement cost
func-tion
Let us consider a power producer, i, generating an amount of electricity Yi. The elec-tricity price is denoted by pi. Emissions Eiresults from the electricity production and total production can be also defined as a function of emissions, Yi ≡ Yi(Ei). Under perfect competition on all markets the program of the firm consists of maximizing its profit given by πi(Yi(Ei)) = piYi(Ei) − C(Yi(Ei)), where C(Yi(Ei)) is the cost of production. Following McKitrick (1999) and Brechet and Jouvet (2009), we define the marginal abatement cost function (MAC function, hereafter) as the loss of profit when pollution is reduced by one unit,
M AC(E)i ≡ dπi dEi = pi dYi dEi − Cm(Yi(Ei)) dYi dEi (1) where Cm(Yi(Ei)) > 0 is the marginal cost of production Yi.
We can now introduce a permits market covering a representative firm i for a given technology in a given country. Denoting by q the price of permit, the profit function can be now defined by
πi(Yi(Ei)) = piYi(Ei) − C(Yi(Ei)) − (Ei− ¯Ei)q (2)
where ¯Ei represents the allowance endowment of the representative firm i. Thus, for each firm i, we can deduce the demand of permits, i.e. Ei ≡ Ei(q). Then, it is easy to determine which firm is a net supplier and which one is a net demander of permits by comparing Ei(q) to ¯Ei. Therefore, the equilibrium price of permits is a function of emissions, q ≡ q(Ei, E−i), subsequently, the profit function can be written as follows:
πi(Yi(Ei)) = piYi(Ei) − C(Yi(Ei)) − (Ei− ¯Ei)q(Ei, E−i) (3) where E−irepresents the emissions of other firms, then (1) can be rewritten as follows,
dπi dEi = pi dYi dEi − Cm(Yi(Ei)) dYi dEi − q(Ei, E−i) − (Ei− ¯Ei) ∂q ∂Ei (4)
where ∂q/∂Ei is the marginal effect of permits used on the carbon markets. 1
The classical marginal spread is given by the difference between the price and the marginal cost for a variation of production. We obtain,
Spreadi = (pi− Cm(Yi(Ei)) dYi dEi
(5)
Following Sijm et al. (2008) and using relation (4), the pass-through analysis is given by
Spreadi = (1 +
Ei− ¯Ei Ei
σ)q(Ei, E−i) = βq(Ei, E−i) (6) where σ = (∂q/∂Ei)/(q/Ei) is the elasticity of price permits to emissions. Thus, all values of pass through are possible and depends on the elasticity and the gap between the initial allocation and permits used. With a positive price elasticity, if the power sector emissions exceed the allowances endowments, Ei > ¯Ei, the pass through rate will be greater than one. On the contrary, if the allowances endowments exceed the power sector emissions, ¯Ei > Ei, the pass through will be less than one. Moreover, it may be possible to experiment a negative pass through rate if positive elasticity is high and if we observe a huge gap between the initial allocation ¯Ei and emissions Ei, i.e β < 0.
2.2
Empirical model: CO
2costs pass-through
We develop here an econometric model with the aim to empirically estimate the CO2 cost pass-through rate to wholesale electricity spot prices. The basic equation representing the relation between the price of electricity in spot market and the cost of fuel and EUA can be expressed as follows:
Elecl,t= α + γF uell,to,g,c+ βCO2 o,g,c
t + ǫt (7)
1
Perfect competition means non strategic behaviour. Studying CO2 costs pass-through would imply taking into account the effect of permits use on the carbon prices even if there is no strategic behaviour.
Where Elec represents the price of electricity, α is a constant term catching stable influences on the electricity spreads, F uel is the cost of energy, including thermal efficiency, CO2 the emission cost associated to the production of one MWh of elec-tricity and ǫ is an error term. The underscripts l and t represent respectively the load duration period and the observation time, with l=[peak, off-peak]. While the overscripts o, c and g represent the marginal combustible used to produce electricity over the load period considered (respectively for oil, coal and gas).
Following the methodology set up by Sijm et al. (2008), we define a single marginal fuel for each country and load periods (See Appendix B.1). Then, we assume that power producers fully integrate the fuel cost into electricity prices (See Sijm et al., 2006b). Subsequently, we explain the variations of the power spread by the underlying changes in CO2 costs:
Spreado,g,cl,t = Elecl,t− F uelo,g,cl,t = α + βCO2 o,g,c
t + ǫt (8)
Althought in spot markets the equilibrium price results from a complex set of technological interactions, for simplicity sake, we here assume a single marginal tech-nology setting the price all throughout the load period considered. Indeed, this assumption allow us to consider several technologies when estimating pass-through rates. Furthermore, this lead to consider that every other cost and influence are con-stant over the estimation period (including operation and maintenance costs, demand and capacity scarcity).
In order to account for non stationarity in price series, we conduct a series of simple Dickey-Fuller unit root tests. The results show that all spread series are stationary, while CO2 and energy prices are never stationary (See Appendix A for detailed results of stationarity test). In addition, we applied the strategy depicted in H´enin and Jobert (1990) in order to determine the underlying generator process of the spread series. Overall, results of these tests show that most spread series follow an Autoregressive process with one lag. Finally, given these results and using relation (8), we construct an econometric autoregressive model, which can be expressed as
follows:
Spreado,g,cl,t = α + β1CO2 o,g,c
t + β2AR(1) + ǫt (9)
3
Data
Due to the fact that the development of spot markets has been one of the first steps of the electricity liberalization in Europe, overall spot prices present sufficiently long and significant times series. In addition, as many operations take place every day on physical markets, spot prices serve mainly to assure market balance and are likely to integrate the CO2 cost to electricity prices more closely. On the contrary, in some countries, including Spain, Italy and most of the new European member states, electricity forward contracts have been launched only some years ago. Since this article aims at identifying the changes in the patterns of pass through the cost of carbon to power prices between phase 1 and phase 2 of the EU ETS, in a first approach we decided to base our estimations on spots markets. Subsequently, an estimation of the CO2 cost pass-through on forward or futures markets over phase 2 will complete the spot market analysis.
3.1
Data description
A wide range of data has been gathered regarding the trading of electricity, energy and CO2 allowances on the main markets place in Europe. Regarding electricity spot prices, hourly settlement data of day-ahead exchanges have been taken from European power exchanges websites. The range of data collected goes from June 2005 to April 2011 and covers ten countries: Germany (DE), France (FR), The Netherlands (NL), United Kingdom (UK)2
, Italia (IT), Spain (ES), The Nord Pool System Price (NP)3 ,
2
We particularly thank APX-Endex for provided us these data. 3
The Nord Pool system price refers to the price of electricity traded in the Nord Pool area (Norway, Sweden, Finland, and Denmark). The equilibrium price calculated so far is the price which balances the aggregated demand and supply curves for each hour of the day, without taking into account any transmission capacity constraint within the area.
Poland (PL), The Czech Republic (CZ) and Austria (AT). For each country, peak and off-peak prices have been obtained by taking the average of the settlement price over the country specific hours. Overall, peak load hours correspond to the day period from 8 a.m. to 8 p.m. while off-peak periods represent the trading hours from 9 p.m. to 7 a.m.4
(See Appendix B.1 for detailed description of data origins and countries’ specific split between peak and off-peak load hours).
Energy prices for oil, gas and coal result from daily spot trades on European market places. In particular, oil prices refer to the spot exchanges of Brent crude barrels on the IntercontinentalExchange (ICE), while coal prices refer to the standard API 2 for the delivered area ARA (Antwerp, Rotterdam, and Amsterdam). Regarding gas trading in Europe, three different reference prices have been taken, corresponding to different geographical areas. These reference prices include the National Balancing Point of the United Kingdom, the zeebrugge hub of Belgium and the Tile Transfer Facility hub of the Netherlands. All fuel prices have been converted into Euros per MWh by taking the daily current exchange rate published by the European Central Bank (ECB), the standard factors conversion of the International Energy Agency (IEA), and fuel efficiency factors used by Sijm et al. (2008). Regarding the latter, we assume a net thermal efficiency of 35% for coal and oil, 40% for gas-fired steam cycle plants and 55% for combined cycle gas turbine (ccgt) power plants.
Finally, we take the daily settlement prices for CO2allowances traded on Bluenext, which is the most important spot exchange market in terms of volume traded. CO2 prices have been converted into Euros per MWh using standard emission factors of the Intergovernmental Panel on Climate Change (IPCC) and fuel efficiency factors as described above.
3.2
Data trend analysis
As a preliminary to the estimates of carbon costs pass-through rates, we provide a graphical overview of trends in power prices and in costs of fuel and carbon in order to detect eventual break-ups in the series (See Appendix B.2). First, we see
4
that CO2 costs fluctuations seem to be better correlated with power prices during off-peak hours than during peak ones, which suggests that the CO2 cost should be much more important in explaining power prices fluctuations during off-peak periods. When focusing on trends in electricity and EUA prices, we sometimes observe that the series fluctuate in independent or even opposite ways. This is notably the case for the first months of the EU ETS in 2005, the year 2007 as a whole, when the EUA price was close to zero, and since mid-2009. In 2009 indeed, after a few months of stable fluctuation, the electricity price has risen on spot markets while the EUA price remained stable. Thus, electricity prices seem to have been driven by the energy cost instead of the EUA prices. This is due to a particular path of the EU ETS over this period in which the EUA price has fluctuated in a price tunnel of 15-20 Euros per ton. Overall, energy price volatility appears to be higher in phase 2 compared to phase 1. Thus, these trends should lead to a deteriorated correlation between the price of EUA and the price of electricity over the second phase of the EU ETS.
The graphical relation between EUA and power prices can heavily differ among countries, depending on the fuel mix. For example, the relation between power prices and EUA seems to be much more relevant when the price of electricity is set by a coal-fired power plant (Figure 3, Appendix B.2) rather than by an oil-fired or a gas-fired one (Figure 4, Appendix B.2). Of course, given the relative high price level of oil and gas relatively to coal, power prices tend to be less driven by the trend in CO2 prices when the marginal producer is based on a gas-fired or an oil-fired power plant.
3.3
Data correlation analysis
In addition to the graphical analysis, we study the sample correlation between elec-tricity spot prices and the carbon price. Overall, the analysis shows clear evidence of a strong and positive relation between electricity and EUA prices (See Appendix B.3). This relation holds both in phase 1 and phase 2, but tends to be much more important in phase 2 for most countries. Nevertheless, in some countries, the level of statistical correlation between electricity and carbon prices appear to be weak. This is particularly true for the Italian pool, especially over the peak load period, the Nord
Pool area and for Eastern Europeans countries, i.e. Poland and the Czech Republic. Annual correlations show that values can hardly change from one year to another. In particular, in two years of the sample, i.e. 2005 and 2009, show high levels of negative correlation, which confirms our theoretical framework and some intuitive results derived from the graphical analysis. Electricity prices over 2009 can be divided in three periods: a decreasing one from January to March, a stable phase from April to July and an increasing period until the end of the year. The negative correlation observed over the whole year can be explained by the fact that CO2 prices decreased less than electricity prices, which had fully borne the effect of both the economic crisis and the lower demand. In addition, the CO2 prices remained stable over the rest of the year while electricity prices rebounded.
The analysis of the differences in statistical correlations among countries and load periods confirms that the correlation levels between CO2 prices and power prices are lower when the electricity price is set by a gas-fired or an oil-fired unit instead of by a coal-fired plant. This is particularly true for the United Kingdom during peak hours, where the electricity price is set by a ccgt plant, as well as for The Netherlands during peak load period (gas-fired) and the peak and off-peak period of the Italian power market (respectively oil-fired and ccgt).
4
The CO
2cost pass-through
We conduct a first set of estimates based on the equation (9), with a sample running from 24 June 2005 to 31 December 2010 (See Appendix C for detailed estimation results). The sample period has been divided into five subsamples following the cal-endar years.5
In addition, estimates have been made over two additional subsamples representing both the first phase (from 24 June 2005 to 31 December 2006) and the second phase (from 1 January 2008 to 31 December 2010) of the EU ETS. However, since these samples are quite long, some parameters, which are not taken into account
5
In a first approach, the year 2007 has been excluded from the sample since over this year the price of the CO2 was close to zero.
but can be considered as stable in the near term, including operation and mainte-nance costs, electricity mix or capacity scarcity, could have changed over the period and therefore biased the estimates of the CO2 cost pass-through. Thus, estimated pass-through rates obtained for each phase of the EU ETS have to be viewed with caution.
4.1
Results overview
Overall, we observe that the percentage of CO2 costs which had been passed on to electricity spreads is almost always higher during peak load periods than off-peak ones. This first result is consistent with the economic literature and suggests that the higher the electricity demand and the utilization rate of generation capacity, the greater the CO2 cost pass-through. However, given the associated R
2
values, which indicate the part of the variance of the dependent variable explained by the fits, it seems that CO2 cost significantly explains off-peak periods better than peak ones. This result holds for the two phases of the EU ETS. The principal reason for this unexpected result is that during peak load periods, electricity prices could reach high levels that may be only partially explained by a CO2 price equals to 20 Euros per ton. This result is also consistent with the literature and suggests that during peak load periods these price spikes are mainly due to an increase in generation capacity scarcity.
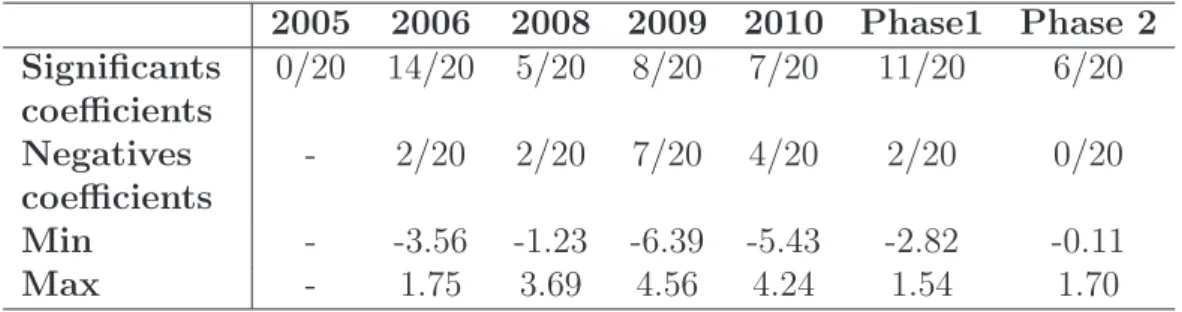
Regarding estimation results for the three subsamples of the first phase (Table 15, Appendix C), about 42% of estimated pass-through coefficients appear to be statis-tically significant, while only 33% of them are statisstatis-tically different from zero in the second phase (Table 16, Appendix C). Over the first phase, significant coefficients vary between -3.56 for the peak load hours of Italy and 1.75 in France over the peak load periods of the year 2006. In the second phase, the range of significant pass-through is greater and fluctuates between -6.39 in Italy and 4.56 in the Netherlands in 2009.
Within the first phase, we observe that half of estimated pass-through rates are negative in 2005, which tends to corroborate the correlation analysis presented above,
Table 1: Summary of estimation results over phase 1 and phase 2 2005 2006 2008 2009 2010 Phase1 Phase 2 Significants coefficients 0/20 14/20 5/20 8/20 7/20 11/20 6/20 Negatives coefficients - 2/20 2/20 7/20 4/20 2/20 0/20 Min - -3.56 -1.23 -6.39 -5.43 -2.82 -0.11 Max - 1.75 3.69 4.56 4.24 1.54 1.70
but all of them prove to be not significant (Table 1). Here, this result could be first attributed to the fact that our estimation sample starts in mid 2005, when the first EUA exchanges took place on the spot market, while electricity operators were already able to account for the CO2 cost, since bilateral trades have started a few months before. Then, in some countries, these negative pass-through rates may suggest the allowance endowments effect, in addition to the existence of a transition period (Levy, 2005; Sijm et al., 2006b). In 2006, the first complete year of the sample, 12 out of 20 coefficients are statically significant and positive, except for the Italian market where similar to 2005 both peak and off-peak prices seem to be inversely correlated with emission costs.
Results for phase 2 show a high degree of negative but almost never significant pass-through rates, which represent approximately half of the estimated coefficients. The year 2009 is an exception as almost all the significant coefficients are negative. Despite the fact that this result could be attributed to the influence of omitted vari-ables, it appears to be consistent with the correlation analysis presented above. In addition, in some countries, these negatives pass-through rates may reflect some al-lowance effect endowments. Indeed, in 2009, CO2 emissions of the European power sector decreased subsequently to the economic crisis, which has resulted in reducing the short net position of power producers (Ei − ¯Ei). According to our theoretical framework, this could lead to negative pass-through rates.
4.2
Cross-country and marginal fuel comparisons
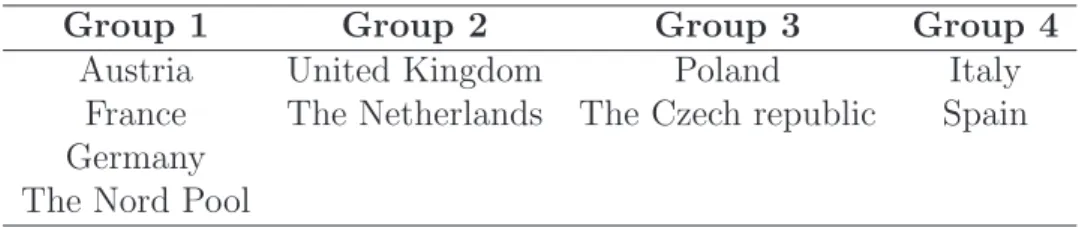
In order to facilitate the interpretation of the results and the cross-country compari-son, we have identified four subgroups of countries depending mainly on the degree of market coupling between countries as well as the marginal fuel considered (Table 2).
Table 2: Subsets of countries grouped by market coupling and marginal fuels
Group 1 Group 2 Group 3 Group 4
Austria United Kingdom Poland Italy
France The Netherlands The Czech republic Spain
Germany The Nord Pool
The first set of countries includes the European continental grid plus the Nord Pool area, and represents the coal countries. Both in Germany and France, the carbon cost has been relatively well passed through on the spot market over the first phase of the EU ETS (Table 3). The pass-through rates for the year 2006 appear to be greater than one, as we assume that coal-fired units set the price over this load period, this is probably due to the fact that gas-fired power plants were marginal during at least one part of the year, leading to an overestimation of the pass-though rates. On the contrary, in Austria and the Nord Pool area, where hydroelectricity represents a large share of the electricity mix, the estimated pass-though rates are lesser than one. While the estimated coefficients are almost never significant in Austria in phase 1, the carbon cost proves to impact significantly the power spread on the Nord Pool Market.
In the second group of countries, electricity traded on the APX market is assumed to be generated by gas-fired power plants during peak load hours. Surprisingly, the pass-through rates both in the United Kingdom and the Netherlands are not significant during peak load hours and significant during off peak ones. Subsequently, as the CO2 emissions are far less important in the case of gas rather than with coal, this result suggests that gas-fired power producers have not passed through the cost
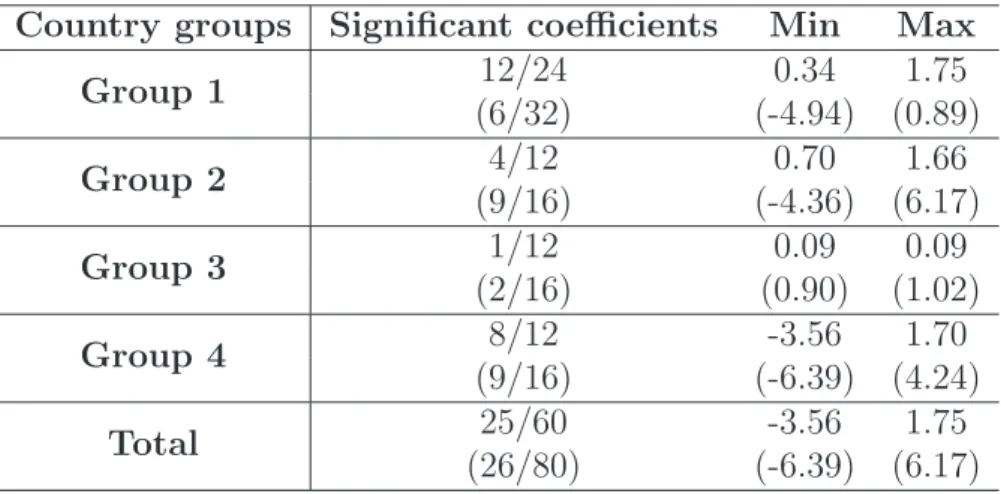
Table 3: Summary of country estimates in phase 1 and phase 2 (in brackets)
Country groups Significant coefficients Min Max
Group 1 12/24 0.34 1.75 (6/32) (-4.94) (0.89) Group 2 4/12 0.70 1.66 (9/16) (-4.36) (6.17) Group 3 1/12 0.09 0.09 (2/16) (0.90) (1.02) Group 4 8/12 -3.56 1.70 (9/16) (-6.39) (4.24) Total 25/60 -3.56 1.75 (26/80) (-6.39) (6.17)
of carbon to electricity prices over the first phase.
Within the third country group, which covers two main Member States from Eastern Europe, it seems that there is no evidence of carbon cost pass-through over the first phase. The reason is probably that over the first period, power producers both in Poland and in The Czech Republic received more allowances than needed to cover their emissions and thus had few opportunities to pass-through the cost of allowances.
In the last set of countries, where the peak load period is assumed to be set by oil-fired power plants, the results of pass-through estimates are contrasted. First, the Spanish market presents a significant rate of pass-through both in 2006 and over the phase 1 as a whole. The coefficient of pass-through appears to be upper during peak load hours, this indicates that during these hours, alternatively oil and gas-fired power plants were marginal. The Italian market presents a significant evidence of negative pass-though rates over the first phase. Given the year 2005, Chernyavs’ka and Gulli (2008) explain this result by the fact that Italian power producers only received their CO2allowances in 2006 and hence didn’t pass-through the cost of carbon to electricity prices before the allocation process was done. However, regarding the year 2006, they
demonstrated that on the Italian North sub-market, the pass-through rate tended to exceed the CO2 cost during most hours of the year and even the pass-through rate was lower on the South sub-market, it wasn’t negative over the whole year. This is related to our approach with a single market and a single price-setting technology.
The extent to which estimated pass-through rates have changed in phase 2 rela-tively to phase 1 greatly differs among countries and load periods. Given the whole phase, the CO2 cost pass-through on the German and the French market remain positive and close to one during peak load hours but is weaker during off-peak ones, when there is excess generation capacity. In Austria and the Nord Pool, there is weak evidence of carbon cost pass-through over the phase 2. In the United Kingdom and in a lesser extent the Netherlands, the pass-through rates during peak load hours seem to be heavily overestimated. Although they prove to be negative, the same levels of pass-through rates have been found for peak load and off-peak load hours in Italy over 2009 and 2010, when respectively oil-fired and ccgt power plants are assumed to be marginal, as well as for the peak load period of Spain. This is due to the fact that the prices of oil and gas were highly volatile and followed a downward trend over this period (See Appendice B.4). Since coal prices are less influenced by the global economic context, because the international coal trade accounts for less than one fifth of the coal production, the estimated pass-through rates for coal countries prove to be more reliable. Finally, in Poland and the Czech Republic, there are no major changes between phase 1 and phase 2, since the estimated pass-through rates remain non significant.
4.3
What happened between phase 1 and phase 2
While the empirical model provides a relative good and stable outcome in phase 1, such a relation between electricity prices and CO2 costs appear to be less evident in the second phase. Particularly, a high frequency of negative pass-through combined with a low level of significance indicates a conjectural break in the correlation between prices of power and EUA as well as in the explanation power of the CO2 cost in phase 2.
There is no doubt about the fact that the financial crisis has greatly impacted energy markets.6
Fuel prices, and subsequently electricity prices in wholesale spot markets, have crashed along with the oil demand of emerging countries. In the mean-time, the economic downturn has depressed the activity of energy-intensive industries and thus their electricity demand. This could lead to a decrease in the scarcity of generation capacity on spot markets and a disturbance of the CO2 cost-pass-through in three ways. First, since estimates of carbon cost pass-through assume that all other costs and influences are stable over the time, a decline in the rate of capacity utilization may result in a misestimation of the pass-through coefficients. Then, in a turmoil period, the opportunities for power producers to passed on the cost of CO2 may have been weaker. This appears to be particularly true since the demand for electricity had follow a downward trend, suggesting that power producers were less likely to increase demand depression by adding the opportunity cost of freely allo-cated allowances. Subsequently, electricity prices over phase 2 seem to have been driven more by the decrease in the scarcity of generation capacity. Finally, in some countries, the fall in the electricity production could lead to a situation where al-lowances exceeded emissions, which suggests that the allowance effect had probably played a significant role in the observed negative pass-through rates.
5
Alternatives estimates of CO
2costs pass-through
In this section, we provide first an estimation of the carbon cost pass-through on electricity forward markets with the aim at emphasizing to what extent they have been impacted by the economics crisis. Then, we propose alternative ways to estimate CO2 costs pass-through rates to electricity spot prices and account for the incidence of both the compliance periods and exogenous volatility on the estimations outputs.6
See Declercq et al. (2011) for a detailed discussion of the impact of the economic downturn on the power sector.
5.1
The carbon cost pass-through to forward electricity prices
The analysis of the link between EUA prices and wholesale electricity spot prices showed that in the second phase, the estimation of the CO2 cost pass-through has been perturbed by the variations in the electricity demand and capacity scarcity, as well as by the volatility of energy prices. In order to test this assumption, we have estimated the CO2 cost pass-through on forward markets given different maturities (See Appendix D.1). As forward price series are mostly non stationary (See Appen-dice A, Table 9)7, we estimate the CO2 cost pass-through on forward markets by taking the first differences of the series:
∆Spreado,c,gl,t = ∆CO2o,g,ct + ǫt (10)
First, taking the front calendar price for each year of the second phase, we observe that all the coefficients are statically significant and positive over the second phase, except for the peak load period of the United Kingdom in 2009. For most countries, the estimated pass-through rates are greater than one. This tends to confirms that the CO2 cost are still passed on to electricity prices in phase 2, at least regarding forward markets. Nonetheless, results for the year 2009 display lower level of pass-through rates, confirming that the economic crisis has lowered the impact of the CO2 cost on power prices. In addition, in order to test whether the effect of the crisis is viewed as a transitional effect or not by power producers, we estimate a second set of pass-through based on a longer-term maturity, i.e. 2011 Calendar, for countries where such contracts are available and sufficiently liquid. Results show that all the estimated pass-through are greater than one in 2008 and 2010, except for the peak load contract of The Netherlands, while there are close to one in 2009.
Since there is clear evidence of carbon cost pass-through on forward markets, one question is whether the non correlation between EUA and spot prices in 2009 is specific to the carbon market or on the contrary lies in the functioning of the electricity
7
Although we found some level of stationarity with zero lag, forward series prove to be no longer stationary as we retain an increasing number of lags.
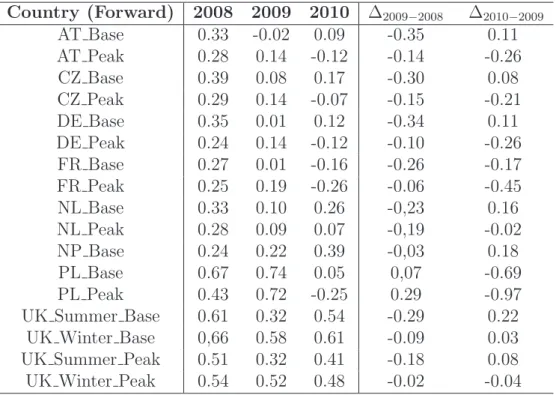
Table 4: Correlation between forward and spot electricity prices over phase 2 Country (Forward) 2008 2009 2010 ∆2009−2008 ∆2010−2009 AT Base 0.33 -0.02 0.09 -0.35 0.11 AT Peak 0.28 0.14 -0.12 -0.14 -0.26 CZ Base 0.39 0.08 0.17 -0.30 0.08 CZ Peak 0.29 0.14 -0.07 -0.15 -0.21 DE Base 0.35 0.01 0.12 -0.34 0.11 DE Peak 0.24 0.14 -0.12 -0.10 -0.26 FR Base 0.27 0.01 -0.16 -0.26 -0.17 FR Peak 0.25 0.19 -0.26 -0.06 -0.45 NL Base 0.33 0.10 0.26 -0,23 0.16 NL Peak 0.28 0.09 0.07 -0,19 -0.02 NP Base 0.24 0.22 0.39 -0,03 0.18 PL Base 0.67 0.74 0.05 0,07 -0.69 PL Peak 0.43 0.72 -0.25 0.29 -0.97 UK Summer Base 0.61 0.32 0.54 -0.29 0.22 UK Winter Base 0,66 0.58 0.61 -0.09 0.03 UK Summer Peak 0.51 0.32 0.41 -0.18 0.08 UK Winter Peak 0.54 0.52 0.48 -0.02 -0.04
spot market. In order to test the latter assumption, we estimate the extent to which electricity spot prices are linked to the corresponding forward prices over the second phase (Table 4). By comparison to the year 2008, the correlation between spot and forward prices prove to be very weak in 2009, except for Poland and the United Kingdom. These correlations continue to decline over the year 2010 in almost all the coal countries belonging to the group 1 and 3. Thus, results of estimates of carbon costs pass-through rates to spot prices in phase 2 seem to be more likely due to the underlying dynamics of the electricity market as well as to the behavior of energy prices on international markets rather than to the CO2 market.
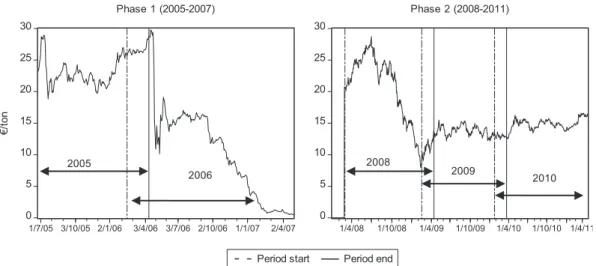
0 5 10 15 20 25 30 1/7/05 3/10/05 2/1/06 3/4/06 3/7/06 2/10/06 1/1/07 2/4/07 Phase 1 (2005-2007) €/ to n 2005 2006 0 5 10 15 20 25 30 1/4/08 1/10/08 1/4/09 1/10/09 1/4/10 1/10/10 1/4/11 Phase 2 (2008-2011) 2008 2009 2010
Period start Period end
Figure 1: Decomposition of the CO2 spot price curve following compliances periods of the EU ETS
5.2
The compliance periods
As far the estimates concern spot markets, there is a priori no reason to consider the calendars years when estimating the pass-through of carbon cost since there is no maturity effect. In addition, calendar years are not well appropriate to the analysis of the carbon market since in the EU ETS, the institutional calendar plays a great role on the market functioning. In particular, allocation and compliance periods, which occur respectively on end-February and end-April of each year, heavily impact the EUA price. Therefore, we resample the estimation data based on “compliance periods” (Figure 1) and provide a second set of pass-through estimates given these new subsamples.
The sample period goes from 22 June 2005 to 30 April 2007 for the first phase and from 28 February 2008 to 30 April 2011 for the second phase8
. Over the first
8
Following the theft of carbon allowances in the EU ETS, the European Commission decided on 19 January 2011 to close all the national registries until 26 January 2011. Since all the carbon transactions had been suspended, there was no carbon prices in spot markets and subsequently, we didn’t take into account this period in our estimations.
phase, about two-thirds of the estimated coefficients are statically significant, which is significantly higher than the results obtained with the calendar samples (Table 5). In phase 2, the number of significant coefficients is still in progress relatively to those obtained with the calendar samples and represents almost half of the pass-through rates. In addition, the R2
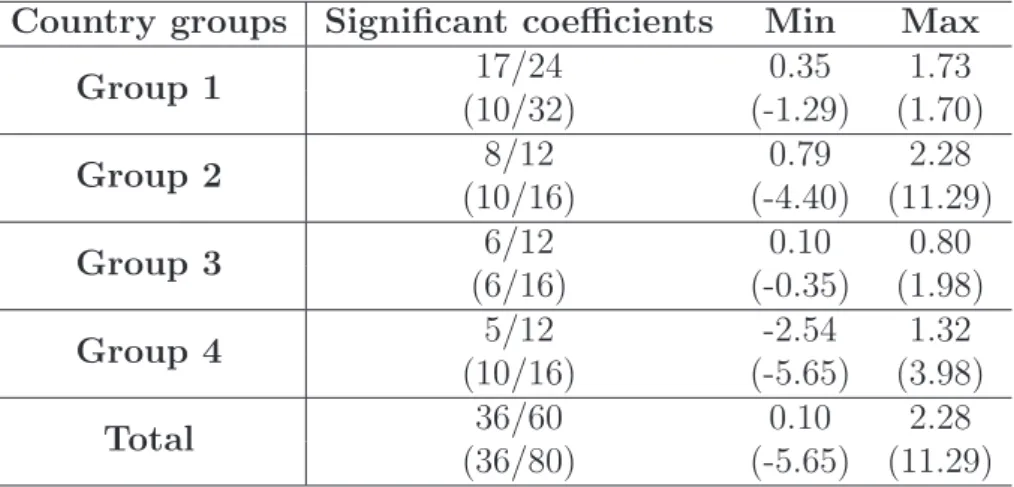
values associated with the compliance samples are higher than those of the calendar samples, which suggests a greater robustness of the estimation. This result holds both for the two phases of the EU ETS. Regarding the presence of negative pass-through coefficients, it appears that there are fewer in the case of the compliance samples, for all the years considered. More specifically, in 2005 the switch from the calendar to the compliance samples induces a significant decrease in the number of negative rates. Estimation of the carbon costs pass-through rates based on the compliance samples also provides less negative pass-through rates in phase 2, especially given the year 2009 where only three of them are significant and negative.
Although the results of pass-through estimates appear to be far more relevant with the compliance samples, the effects of compliance differ across countries. For the first set of countries, the switch to compliance samples leads to an increase in the value of the pass-through rates, both in phase 1 and phase 2, and a decrease in the number of negative pass-through rates, except for the Nord Pool in phase 2, where pass-through coefficients remain negative and mostly not significant. The compliance effect has a positive impact on estimated pass-through rates in the United Kingdom during the peak load hours of the first phase, which become statically significant. However, the main effect of the compliance samples on the United Kingdom and the Netherlands lies in the considerable rise of the estimated pass-through for peak load hours in phase 2. This does not necessarily mean that power producers in both countries have more passed-through the CO2 cost of gas-fired power plants to electricity prices but rather than that the compliance effect has exacerbated these underlying evolutions. Within the eastern coal countries, the compliance samples induce a significant increase in the pass-through rates and the associated R2
values over the first phase both during peak and off-peak hours of The Czech republic and during the off-peak period of Poland.
Table 5: Summary of country estimates in phase 1 and phase 2 (in brackets) based on the compliance samples
Country groups Significant coefficients Min Max
Group 1 17/24 0.35 1.73 (10/32) (-1.29) (1.70) Group 2 8/12 0.79 2.28 (10/16) (-4.40) (11.29) Group 3 6/12 0.10 0.80 (6/16) (-0.35) (1.98) Group 4 5/12 -2.54 1.32 (10/16) (-5.65) (3.98) Total 36/60 0.10 2.28 (36/80) (-5.65) (11.29)
Over the phase 2, results are enhanced in The Czech republic, especially for peak load hours where almost all the coefficients are significant, while in Poland, the net compliance effect is not clear. Finally, the compliance samples have no effect on the Italian market both in phase 1 and phase 2 nor on the Spanish market over phase 2.
5.3
The compliances periods with 90% of the observations
set
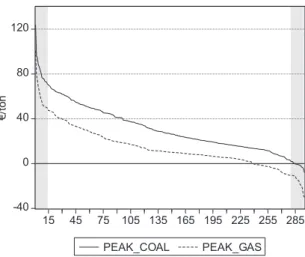
Electricity spot prices in phase 2 prove to be highly volatile (See Appendix B.4). For instance, on the French spot market, on the 19th of October 2009, the electricity price was higher than several thousand Euros during most of the hours. It’s clear that such prices levels can’t be explained only by the costs of fuel and carbon. Thus, these erratic movements disturb the estimates of the carbon cost pass-through on spot markets. As underlined by Sijm et al. (2008), if the variance of the electricity price is fully explained by the underlying changes in fuel and carbon cost, thus, the shape of the clean spread should be a horizontal line. In order to control for extreme values and get the most suitable set of data, we drop 5% of the observations from
-40 0 40 80 120 15 45 75 105 135 165 195 225 255 285 PEAK_COAL PEAK_GAS €/ to n
Figure 2: Clean dark spread and clean spark spread in the Netherlands over peak load hours of the conformity year 2008-2009 (ranked in descending order)
both sides of the clean spread distribution and estimate the pass-through rate of the carbon cost over the remaining 90% (Figure 2).
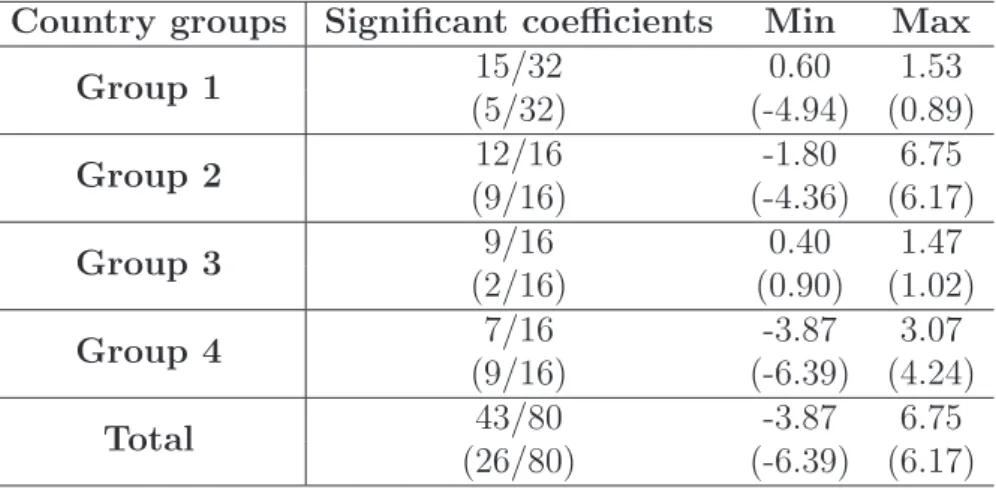
Combining the compliance effect with the sample adjustment allows us to improve the estimates of the carbon cost pass-through over the second phase (Table 6). For all the countries considered, this last set of estimations present a higher degree of statistical significance overall, a lower range of pass-through values and a smaller share of significant negative coefficients. Hence, over the second period as a whole, almost all the estimated coefficients of carbon costs pass-through are positive and statically significant. Major exceptions concern the Nordic area and Italy, both during peak load and off-peak load periods, Spain and Poland respectively during peak load and off-peak load hours. In these countries, we can reasonably conclude so far that carbon costs have not been passed-through yet on spot markets over the second phase of the EU ETS.
Within the second period, estimation results are contrasted. First, we failed to find any evidence of carbon costs pass-through over the year 2009, except for Poland, the Czech Republic, The Netherlands and Italy. This result is consistent with those obtained with the two previous regressions, and thus confirms the hypothesis that
Table 6: Summary of country estimates in phase 2 based on adjusted compliance samples and calendar samples (in brackets)
Country groups Significant coefficients Min Max
Group 1 15/32 0.60 1.53 (5/32) (-4.94) (0.89) Group 2 12/16 -1.80 6.75 (9/16) (-4.36) (6.17) Group 3 9/16 0.40 1.47 (2/16) (0.90) (1.02) Group 4 7/16 -3.87 3.07 (9/16) (-6.39) (4.24) Total 43/80 -3.87 6.75 (26/80) (-6.39) (6.17)
over the year 2009, there is no empirical relation between the price of electricity and the price of carbon allowances. Then, estimated pass-through coefficients for the compliance year 2010 appear to be positive and significant in most of the countries belonging to the groups 1, 2 and 3. This finding is consistent with the intuitive result, derived from the analysis of the forward market, which suggest that a conjectural break occurred on the spot market. It tends also to confirm the effect of the economic crisis on the carbon cost pass-through.
6
Conclusion
While the impacts of allowances prices on wholesale electricity spot prices have been well established for the first phase of the EU ETS, the relationship between CO2 costs and marginal electricity costs seems to be less evident over the second phase. Especially we found no empirical evidence of costs pass-through over the year 2009 and for all the countries we considered.
We shown that this is mainly due to the breakups that occurred on energy and electricity spot markets since the beginning of the second phase. First, the financial
crisis ended the continuous rise of energy prices which had started few years before on international markets. As energy prices are the main drivers of electricity prices, the economic crisis also heavily impacted wholesale electricity markets and increased market instability as well as prices volatility. Then, the economic downturn depre-ciated the activity of energy-intensive industries and thus induced a lower electricity demand. As a consequence, power producers were less able to pass-through the cost of carbon in presence of increasing excess of generation capacity. Finally, as suggested by the theoretical framework, the resulting lower level of carbon emission may had lead power producers to less pass-through the cost of freely allocated allowances.
These evolutions have disrupted the detection of the impact of carbon costs on electricity markets through standard methodologies. The alternative approaches we developed in this paper have permitted to enhance the global level of statistical significance as well as the robustness of the carbon costs pass-through estimates. In particular, the compliance effect of the EU ETS combined with the adjustment of the estimation samples indicate that while power producers didn’t pass on the cost of carbon over the year 2009, in some countries at least there is clear evidence of CO2 costs pass-through over the compliance year 2010-2011.
One open question is why forward markets seem to have been less impacted by the economic crisis than spot markets and therefore continued to incorporate CO2 costs over the second phase. Thus, a dynamic explanation of the way the economic crisis altered the relationship between spot and forward electricity prices represents an interesting field for further research. In addition, a panel approach, which allows a dynamic representation of carbon costs on electricity markets, could constitute a second way of improvement of the estimates of carbon costs pass-through to electricity prices.
References
[1] Alberola, E., Chevallier, J., and Ch`eze, B. (2008). Prices drivers and structural breaks in European carbon prices 2005-07. Energy Policy, 36(2), 787-797. [2] Bocacina, M., and Gulli, F. (2007). Electricity pricing under “carbon emissions
trading”: A dominant firm with competitive fringe model. Energy policy, 35, 4200-4220.
[3] Br´echet, T., and Jouvet, P.A. (2009). Why environmental management may yield no-regret pollution abatement options. Ecological Economics, 68(6), 1770-1777. [4] Bunn, D., and Fezzi, C. (2007). Interaction of European carbon trading and
energy prices. Fondazione Eni Enrico Mattei, Working paper.
[5] Bunn, D., and Fezzi, C. (2009). Structural interactions of European carbon trad-ing energy prices. The journal of energy markets, 2(4), 53-69.
[6] Chernyavs’ka, L., and Gulli, F. (2008). Marginal CO2 cost pass-through under imperfect competition in power markets. Ecological Economics, 68, 408-421. [7] Declercq, B., Delarue, E., and D’haeseleer, W. (2011). Impact of the economic
recession on the European power sector’s CO2 emissions. Energy Policy, 39(3), 1677-1686.
[8] European Commission. (2010). EU energy and transport figures. Statistical Pocketbook 2010.
[9] Fell, H. (2008). EU-ETS and Nordic Electricity. A CVAR Analysis. Resources for the future, Discussion paper 08-31.
[10] Fezzi, C. (2006). Econometric analysis of the interaction between the European emission trading scheme and energy prices. (Preliminary and incomplete draft). London Business School, Department of Decision Science.
[11] H´enin, P.Y., and Jobert, T. (1990). Persistance du chˆomage et hyst´er`ese: Une ´etude ´econom´etrique comparative. Universit´e de Paris I, Macro´economie et Anal-yse des D´es´equilibres, Document No. 205
[12] Hintermann, B. (2010). Allowance price drivers in the firts phase of the EU ETS. Journal of Environmental Economics and Management, 59, 43-56.
[13] Honkatukia, J., M¨alk¨onen, V., and Perrels, A. (2006). Impacts of the European emission trade system on the Finnish electricity market. VATT Discussion paper 405, Government institute for economic research.
[14] Keppler, J.H., and Cruciani, M. (2010a). Rents in the European power sector due to carbon trading. Energy Policy, 38, 4280-4290.
[15] Keppler, J.H., and Mansanet-Bataller, M. (2010b). Causalities between CO2, electricity, and other energy variables during phase I and phase II of the EU ETS. Energy Policy, 38(7), 3329-3341.
[16] Levy, C. (2005). Impact of emission trading on power prices. A case study from the European Emission trading scheme. University Paris-Dauphine, DEA d’Economie industrielle.
[17] McKitrick, R. (1999). A derivation of the marginal abatement cost curve. Journal of Environmental Economics and Management, 37, 306–314
[18] Reinaud, J. (2007). CO2 allowance and electricity price interaction. Impact on industry’s electricity purchasing strategies in Europe. OECD/IEA, Information paper.
[19] Sijm, J., Donkelaar, M., Hers, J.S., Scheepers, M.J.J., and Chen, Y. (2006a). CO2 price dynamics. A follow-up analysis of the implications of EU emissions trading for the price of electricity, ECN-C-06-015.
[20] Sijm, J., Hers, S.J., Lise, W., and Wetzelaer, B.J.H.W. (2008). The impact of the EU ETS on electricity prices, ECN-E—08-007, Final report to DG Environment of the European Commission.
[21] Sijm, J., Neuhoff, K., and Chen, Y. (2006b). CO2 cost pass-through and windfall profits in the power sector. Earthscan, Climate Policy, 6, 49-72.
[22] Zachmann, G., and von Hirschhausen, C. (2008). First evidence of asymmetric cost pass-through of EU emissions allowances: examining wholesale prices in Germany. Economics Letters, 99, 465-469.
A
Stationarity analysis
We perform Augmented Dickey-Fuller tests in order to account for the eventual pres-ence of unit roots in the sample series. Given the shape of the electricity and energy prices, we estimate an autoregressive model, with constant and trend as follows:
xt= φ1xt−1+ c + bt+ ǫt⇔ (1 − φ1B)(xt− α − β) = ǫt With c = α(1 − φ1B) + φ1β and b = β(1 − φ1)
The underlying hypothesis of the test can be written as follows: (
H0 : φ1 = 1 H1 : |φ1| < 1
Noting tpˆ the student statistic associated to the estimation of the model above, as tpˆ=
ˆ p= ¯φ1−1
ˆ
σpˆ , we reject the null hypothesis of an unit root if the estimated values of
the student statistic is inferior to the critical values tabulated by Dickey and Fuller.9 The results of these tests are displayed in Table 7. We can see that almost all the power spreads are stationary both in phase 1 and phase 2 of the EU ETS. There are only two exceptions which concern the off-peak periods of the Nord Pool in 2006, 2008, and 2009 and Austria in 2005 both during peak and off-peak hours. Regarding fuel series, coal prices appear to be never stationary while the oil price is stationary in 2009 and the gas cost is stationary in 2006, 2008 and 2010. The carbon cost is never stationary over the sample period.
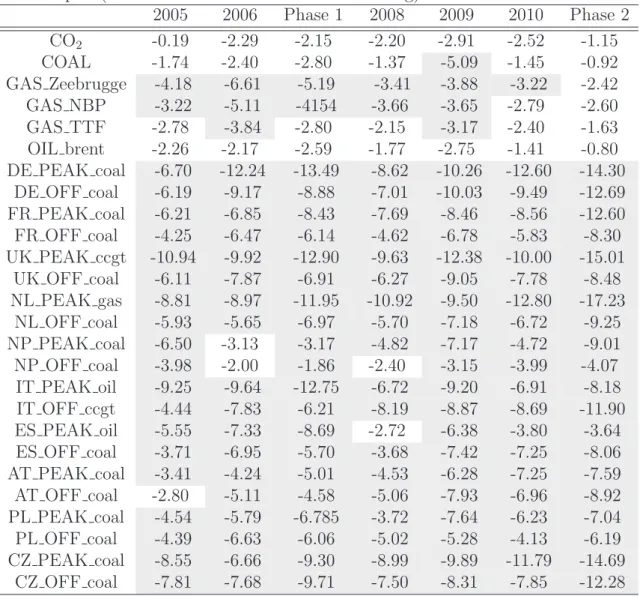
Similar results have been found with the compliance samples (Table 8). The main changes compared to the results of the calendar samples lie in the gas series, which are always stationary under the compliance samples (except for the gas prices in the TTF). Spread series for the Nord Pool area and Austria appear to be no longer stationary while the Spanish is now stationary in 2008 and over the phase 2 as a whole.
9
For a number of observations higher than 250, and a statistical level of significance of 1% (respectively 5% and 10%) the critical value is -4.00 (-3.43, -3.14 respectively).
Subsequently, given the results of stationarity tests, we retain a one lag autore-gressive model for the estimation of carbon costs pass-through rates on spot markets.
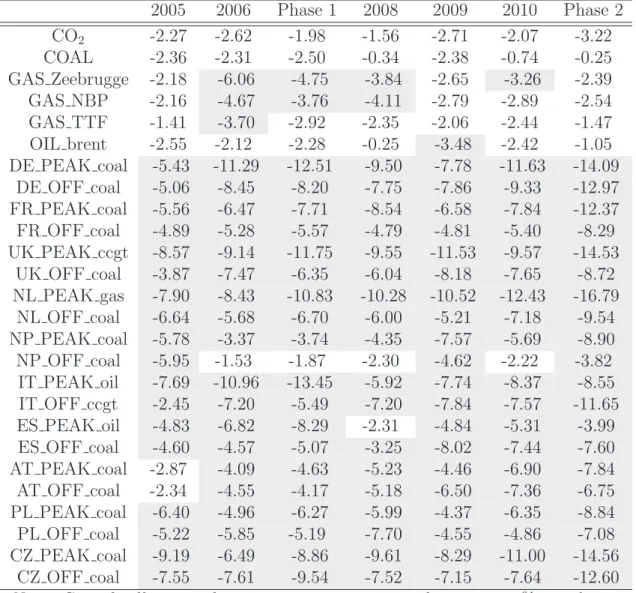
Table 7: Results of Augmented Dickey-Fuller stationarity test (with constant and trend terms. zero lag)
2005 2006 Phase 1 2008 2009 2010 Phase 2 CO2 -2.27 -2.62 -1.98 -1.56 -2.71 -2.07 -3.22 COAL -2.36 -2.31 -2.50 -0.34 -2.38 -0.74 -0.25 GAS Zeebrugge -2.18 -6.06 -4.75 -3.84 -2.65 -3.26 -2.39 GAS NBP -2.16 -4.67 -3.76 -4.11 -2.79 -2.89 -2.54 GAS TTF -1.41 -3.70 -2.92 -2.35 -2.06 -2.44 -1.47 OIL brent -2.55 -2.12 -2.28 -0.25 -3.48 -2.42 -1.05 DE PEAK coal -5.43 -11.29 -12.51 -9.50 -7.78 -11.63 -14.09 DE OFF coal -5.06 -8.45 -8.20 -7.75 -7.86 -9.33 -12.97 FR PEAK coal -5.56 -6.47 -7.71 -8.54 -6.58 -7.84 -12.37 FR OFF coal -4.89 -5.28 -5.57 -4.79 -4.81 -5.40 -8.29 UK PEAK ccgt -8.57 -9.14 -11.75 -9.55 -11.53 -9.57 -14.53 UK OFF coal -3.87 -7.47 -6.35 -6.04 -8.18 -7.65 -8.72 NL PEAK gas -7.90 -8.43 -10.83 -10.28 -10.52 -12.43 -16.79 NL OFF coal -6.64 -5.68 -6.70 -6.00 -5.21 -7.18 -9.54 NP PEAK coal -5.78 -3.37 -3.74 -4.35 -7.57 -5.69 -8.90 NP OFF coal -5.95 -1.53 -1.87 -2.30 -4.62 -2.22 -3.82 IT PEAK oil -7.69 -10.96 -13.45 -5.92 -7.74 -8.37 -8.55 IT OFF ccgt -2.45 -7.20 -5.49 -7.20 -7.84 -7.57 -11.65 ES PEAK oil -4.83 -6.82 -8.29 -2.31 -4.84 -5.31 -3.99 ES OFF coal -4.60 -4.57 -5.07 -3.25 -8.02 -7.44 -7.60 AT PEAK coal -2.87 -4.09 -4.63 -5.23 -4.46 -6.90 -7.84 AT OFF coal -2.34 -4.55 -4.17 -5.18 -6.50 -7.36 -6.75 PL PEAK coal -6.40 -4.96 -6.27 -5.99 -4.37 -6.35 -8.84 PL OFF coal -5.22 -5.85 -5.19 -7.70 -4.55 -4.86 -7.08 CZ PEAK coal -9.19 -6.49 -8.86 -9.61 -8.29 -11.00 -14.56 CZ OFF coal -7.55 -7.61 -9.54 -7.52 -7.15 -7.64 -12.60
Note: Grayed cells mean that series are stationary at least at a 10% signifcance level.
Table 8: Results of Augmented Dickey-Fuller stationarity test based on the compli-ance samples (with constant and trend terms. zero lag)
2005 2006 Phase 1 2008 2009 2010 Phase 2 CO2 -0.19 -2.29 -2.15 -2.20 -2.91 -2.52 -1.15 COAL -1.74 -2.40 -2.80 -1.37 -5.09 -1.45 -0.92 GAS Zeebrugge -4.18 -6.61 -5.19 -3.41 -3.88 -3.22 -2.42 GAS NBP -3.22 -5.11 -4154 -3.66 -3.65 -2.79 -2.60 GAS TTF -2.78 -3.84 -2.80 -2.15 -3.17 -2.40 -1.63 OIL brent -2.26 -2.17 -2.59 -1.77 -2.75 -1.41 -0.80 DE PEAK coal -6.70 -12.24 -13.49 -8.62 -10.26 -12.60 -14.30 DE OFF coal -6.19 -9.17 -8.88 -7.01 -10.03 -9.49 -12.69 FR PEAK coal -6.21 -6.85 -8.43 -7.69 -8.46 -8.56 -12.60 FR OFF coal -4.25 -6.47 -6.14 -4.62 -6.78 -5.83 -8.30 UK PEAK ccgt -10.94 -9.92 -12.90 -9.63 -12.38 -10.00 -15.01 UK OFF coal -6.11 -7.87 -6.91 -6.27 -9.05 -7.78 -8.48 NL PEAK gas -8.81 -8.97 -11.95 -10.92 -9.50 -12.80 -17.23 NL OFF coal -5.93 -5.65 -6.97 -5.70 -7.18 -6.72 -9.25 NP PEAK coal -6.50 -3.13 -3.17 -4.82 -7.17 -4.72 -9.01 NP OFF coal -3.98 -2.00 -1.86 -2.40 -3.15 -3.99 -4.07 IT PEAK oil -9.25 -9.64 -12.75 -6.72 -9.20 -6.91 -8.18 IT OFF ccgt -4.44 -7.83 -6.21 -8.19 -8.87 -8.69 -11.90 ES PEAK oil -5.55 -7.33 -8.69 -2.72 -6.38 -3.80 -3.64 ES OFF coal -3.71 -6.95 -5.70 -3.68 -7.42 -7.25 -8.06 AT PEAK coal -3.41 -4.24 -5.01 -4.53 -6.28 -7.25 -7.59 AT OFF coal -2.80 -5.11 -4.58 -5.06 -7.93 -6.96 -8.92 PL PEAK coal -4.54 -5.79 -6.785 -3.72 -7.64 -6.23 -7.04 PL OFF coal -4.39 -6.63 -6.06 -5.02 -5.28 -4.13 -6.19 CZ PEAK coal -8.55 -6.66 -9.30 -8.99 -9.89 -11.79 -14.69 CZ OFF coal -7.81 -7.68 -9.71 -7.50 -8.31 -7.85 -12.28
Note: Grayed cells mean that series are stationary at least at a 10% signifcance level.
Table 9: Results of Augmented Dickey-Fuller stationarity test based on forward series (with constant and trend terms. zero lag)
2008 2009 2010 Phase 2 CO2 -0,81 -3,20 -2,04 -1,46 DE BASE coal -4,53 -3,70 -4,64 -4,88 DE PEAK coal -1,57 -2,87 -2,66 -3,28 FR BASE coal -2,99 -4,23 -4,16 -3,52 FR PEAK coal -0,85 -3,67 -2,52 -2,69
UK BASE summer coal -1,30 -2,66 -2,30 -1,88
UK PEAK summer ccgt -0,74 -5,71 -2,12 -1,72
UK BASE winter coal -1,60 -3,35 -3,08 -2,28
UK PEAK winter ccgt -1,98 -1,92 -2,47 -2,63 NL BASE coal -2,42 -3,88 -3,76 -3,35 NL PEAK gas -2,56 -3,78 -9,21 -2,50 NP BASE coal -6,34 -3,88 -3,42 -4,26 AU BASE coal -4,53 -3,70 -4,66 -4,88 AU PEAK coal -1,57 -2,87 -2,67 -3,28 PL BASE coal -4,00 -2,77 -1,93 -5,74 PL PEAK coal -3,54 -3,20 -7,68 -5,01 CZ BASE coal -3,96 -3,29 -4,50 -4,38 CZ PEAK coal -3,24 -3,62 -3,02 -4,83
Note: Grayed cells mean that series are stationary at least at a 10% signifcance level.
B
Data
B.1
Data description
Table 10: Country data specifications spot markets
Country Spot Market
Exchange
Load periods Marginal
technology
Germany EPEX Spot Peak: 8 a.m. to 8 p.m. Coal
Off-Peak: 9 p.m. to 7 a.m. Coal
France EPEX Spot Peak: 8 a.m. to 8 p.m. Coal
Off-Peak: 9 p.m. to 7 a.m. Coal
United-Kingdom APX Peak: 7 a.m. to 7 p.m. Ccgt (NBP)
Off-Peak: 7 p.m. to 7 a.m. Coal
Netherlands APX Peak: 8 a.m. to 8 p.m. Gas (TTF)
Off-Peak: 8 p.m. to 8 a.m. Coal
Italy GME Peak: 8 a.m. to 8 p.m. Oil (NBP)
Off-Peak: 9 p.m. to 8 a.m. Ccgt (Zeebrugge)
Spain OMEL Peak: 8 a.m. to 8 p.m. Oil (NBP)
Off-Peak: 9 p.m. to 8 a.m. Coal
Nord Pool System ELSPOT Peak: 9 a.m. to 8 p.m. Coal
Off-Peak: 9 p.m. to 8 a.m. Coal
Austria EXAA Peak: 9 a.m. to 8 p.m. Coal
Off-Peak: 9 p.m. to 8 a.m. Coal
Poland POLPX Peak: 8 a.m. to 22 p.m. Coal
Off-Peak: 23 p.m. to 7 a.m. Coal
Czech Republic OTE Peak: 8 a.m. to 7 p.m. Coal
Table 11: Country data specifications derivatives markets
Country Derivatives Market
Exchange
Contract considered Marginal technology
Germany EEX Peak load Calendar Coal
Baseload Calendar Coal
France EEX Peak load Calendar Coal
Baseload Calendar Coal
United Kingdom ICE Summer Calendar Ccgt (NBP)
Winter Calendar Coal
Netherlands ENDEX Peak load Calendar Gas (Zeebrugge)
Baseload Calendar Coal
Nord Pool System ICE Baseload Calendar Coal
Austria EEX Peak load Calendar Coal
Baseload Calendar Coal
Poland POLPX Peak load Calendar Coal
Baseload Calendar Coal
Czech Republic PXE Peak load Calendar Coal
B.2
Data graphical trends
Figure 3: 10-day moving average of Electricity prices, fuel costs nets of thermal efficiency and CO2 emissions costs in coal countries
0 40 80 120 160 200 2005 2006 2007 2008 2009 2010
Electricity Coal CO2(Coal)
GERMANY (Peak) 0 10 20 30 40 50 60 70 80 2005 2006 2007 2008 2009 2010
Electricity Coal CO2(Coal)
GERMANY (Off-peak) 0 40 80 120 160 200 2005 2006 2007 2008 2009 2010
Electricity Coal CO2(Coal)
FRANCE (Peak) 0 10 20 30 40 50 60 70 80 90 2005 2006 2007 2008 2009 2010
Electricity Coal CO2(Coal)
FRANCE (Off-peak) 0 20 40 60 80 100 120 2005 2006 2007 2008 2009 2010
Electricity Coal CO2(Coal)
NORD POOL (Peak)
0 10 20 30 40 50 60 70 80 90 2005 2006 2007 2008 2009 2010
Electricity Coal CO2(Coal)
NORD POOL (Off-peak)
0 40 80 120 160 200 2005 2006 2007 2008 2009 2010
Electricity Coal CO2(Coal)
AUSTRIA (Peak) 0 10 20 30 40 50 60 70 80 2005 2006 2007 2008 2009 2010
Electricity Coal CO2(Coal)
AUSTRIA (Off-peak) 0 20 40 60 80 100 2005 2006 2007 2008 2009 2010
Electricity Coal CO2(Coal)
POLAND (Peak) 0 10 20 30 40 50 60 2005 2006 2007 2008 2009 2010
Electricity Coal CO2(Coal)
POLAND (Off-peak) 0 20 40 60 80 100 120 140 2005 2006 2007 2008 2009 2010
Electricity Coal CO2(Coal)
CZECH REPUBLIC (Peak)
0 10 20 30 40 50 60 70 80 2005 2006 2007 2008 2009 2010
Electricity Coal CO2(Coal)
CZECH REPUBLIC (Off_peak)
€/
M
W
Figure 4: 10-day moving average of Electricity prices, fuel costs nets of thermal efficiency and CO2 emissions costs in gas and oil countries mainly
0 40 80 120 160 200 2005 2006 2007 2008 2009 2010
Electricity Gas(Ccgt) CO2(Ccgt)
UNITED KINGDOM (Peak)
0 20 40 60 80 100 120 2005 2006 2007 2008 2009 2010
Electricity Coal CO2(Coal)
UNITED KINGDOM (Of f -peak)
0 40 80 120 160 200 2005 2006 2007 2008 2009 2010
Electricity Gas CO2(Gas)
NETHERLANDS (Peak) 0 10 20 30 40 50 60 70 80 2005 2006 2007 2008 2009 2010
Electricity Coal CO2(Coal)
NETHERLANDS (Of f -peak)
0 40 80 120 160 2005 2006 2007 2008 2009 2010
Electricity Oil CO2(Oil)
ITALY (Peak) 0 20 40 60 80 100 120 2005 2006 2007 2008 2009 2010
Electricity Gas(Ccgt) CO2(Ccgt)
ITALY (Of f -peak)
0 40 80 120 160 2005 2006 2007 2008 2009 2010
Electricity Oil CO2(Oil)
Spain (Peak) 0 10 20 30 40 50 60 70 80 2005 2006 2007 2008 2009 2010
Electricity Coal CO2(Coal)
SPAIN (Of f -peak)
€/
M
W
B.3
Data sample correlation
Table 12: Sample yearly correlation matrix between daily electricity spot and CO2 prices 2005 2006 Phase 1 2008 2009 2010 Phase 2 DE PEAK -0.17 0.17 0.11 0.30 -0.13 0.26 0.45 DE OFF -0.10 0.63 0.48 0.33 -0.31 0.33 0.45 FR PEAK -0.21 0.30 0.22 0.26 -0.01 0.04 0.42 FR OFF -0.17 0.62 0.47 0.10 -0.21 -0.01 0.32 UK PEAK -0.25 0.36 0.27 0.39 -0.15 0.19 0.50 UK OFF -0.30 0.69 0.53 0.44 -0.33 0.41 0.54 NL PEAK -0.15 0.18 0.13 0.32 -0.11 0.24 0.47 NL OFF -0.18 0.62 0.45 0.22 -0.42 0.34 0.42 NP PEAK -0.29 0.09 -0.26 0.15 -0.12 -0.32 0.10 NP OFF -0.28 0.16 -0.19 -0.02 -0.37 -0.30 0.03 IT PEAK 0.10 0.00 -0.14 0.05 -0.13 -0.08 0.30 IT OFF -0.06 0.38 -0.07 0.25 -0.35 0.07 0.36 ES PEAK 0.16 0.56 0.55 -0.32 -0.20 0.63 0.23 ES OFF -0.21 0.69 0.63 -0.26 -0.35 0.66 0.27 AT PEAK -0.27 0.22 0.13 0.34 -0.15 0.23 0.48 AT OFF -0.27 0.63 0.45 0.30 -0.38 0.30 0.44 PL PEAK -0.27 -0.02 -0.16 0.07 0.07 0.19 0.35 PL OFF -0.23 0.35 -0.06 0.41 0.13 0.41 0.44 CZ PEAK 0.01 -0.01 -0.09 0.30 -0.02 0.31 0.46 CZ OFF -0.10 0.09 -0.06 0.30 -0.05 0.37 0.45
Table 13: Sample yearly correlation matrix between daily electricity spot and CO2 prices based on the compliance samples
2005 2006 Phase 1 2008 2009 2010 Phase 2 DE PEAK -0.02 0.27 0.30 0.56 0.08 0.29 0.66 DE OFF 0.26 0.69 0.66 0.61 -0.10 0.44 0.67 FR PEAK -0.01 0.33 0.38 0.57 0.08 0.15 0.64 FR OFF 0.20 0.59 0.60 0.48 -0.15 0.22 0.55 UK PEAK -0.01 0.45 0.43 0.64 -0.03 0.17 0.73 UK OFF 0.15 0.74 0.66 0.78 -0.20 0.45 0.82 NL PEAK -0.05 0.37 0.36 0.63 0.10 0.28 0.72 NL OFF 0.19 0.70 0.66 0.64 -0.20 0.44 0.69 NP PEAK 0.57 0.72 0.25 0.37 -0.18 -0.10 0.07 NP OFF 0.61 0.74 0.30 0.15 -0.22 -0.10 -0.01 IT PEAK 0.33 0.19 0.03 0.46 0.03 -0.06 0.58 IT OFF 0.56 0.64 0.22 0.37 -0.10 0.06 0.54 ES PEAK -0.02 0.52 0.65 0.53 0.15 0.54 0.66 ES OFF 0.03 0.63 0.69 0.53 0.05 0.57 0.65 AT PEAK -0.10 0.37 0.38 0.61 0.12 0.28 0.71 AT OFF 0.16 0.71 0.67 0.62 -0.15 0.45 0.67 PL PEAK 0.08 -0.13 -0.15 0.53 0.18 0.26 0.62 PL OFF 0.46 0.63 0.28 0.73 0.24 0.44 0.56 CZ PEAK 0.01 0.23 0.16 0.58 0.18 0.31 0.68 CZ OFF 0.09 0.40 0.21 0.66 0.01 0.46 0.68
B.4
Price volatility
Table 14: Annualized historical volatility of energy and CO2 prices (in %, 20-day moving average) German Spot German Futures CO2 Spot (Bluenext) Gaz Spot (Zeebrugge) Coal Spot (ARA) Oil Spot (Brent) Peak Off Peak Base
2005 488 221 14 14 41 141 14 33 2006 636 300 21 16 60 200 13 33 2007 692 323 14 13 161 106 15 27 2008 489 243 21 19 37 80 36 39 2009 422 277 21 18 44 126 27 46 2010 393 196 17 17 26 70 20 27
C
Estimations results
Table 15: Estimates of CO2 cost pass-through rates to electricity spot prices in phase 1 (2005-2006) PT 2005 R2 2005 PT 2006 R2 2006 PT Phase 1 R2 Phase I DE Peak_coal -0.34 (-0.12) 0.46 1.18 (1.96) 0.12 0.90 (1.63) 0.17 Off_coal 0.47 (0.58) 0.52 1.03 (7.11) 0.56 0.87 (5.50) 0.54 FR Peak_coal 0.17 (0.06) 0.49 1.75 (2.10) 0.55 1.54 (2.14) 0.54 Off_coal 0.65 (0.68) 0.66 1.05 (3.76) 0.78 0.92 (3.45) 0.74 UK Peak_ccgt 0.83 (0.24) 0.13 1.12 (0.82) 0.24 1.28 (1.21) 0.22 Off_coal 0.57 (0.62) 0.81 1.66 (7.77) 0.66 1.33 (4.68) 0.69 NL Peak_gas 0.79 (0.17) 0.19 0.33 (0.25) 0.30 0.87 (0.79) 0.27 Off_coal -0.30 (0.21) 0.46 0.99 (5.02) 0.75 0.84 (4.33) 0.65 NP Peak_coal 0.04 (0.18) 0.75 0.75 (2.65) 0.81 0.70 (2.92) 0.90 Off_coal 0.02 (0.08) 0.76 0.39 (2.17) 0.94 0.34 (2.35) 0.96 IT Peak_oil 1.05 (0.72) 0.13 -0.64 (-1.71) 0.15 -0.90 (-2.72) 0.18 Off_ccgt -0.03 (-0.01) 0.91 -3.56 (-4.02) 0.61 -2.82 (-2.23) 0.76 ES Peak_oil 2.03 (1.22) 0.46 1.29 (2.85) 0.56 1.70 (4.02) 0.60 Off_coal -0.18 (-0.28) 0.64 0.67 (2.45) 0.86 0.72 (3.12) 0.83 AT Peak_coal -0.76 (-0.38) 0.82 0.54 (0.66) 0.77 0.25 (0.33) 0.79 Off_coal -0.15 (-0.31) 0.89 0.64 (3.00) 0.81 0.31 (1.42) 0.84 PL Peak_coal -0.18 (-0.97) 0.63 -0.01 (-0.30) 0.68 -0.00 (-0.09) 0.66 Off_coal -0.05 (-0.56) 0.55 0.09 (2.40) 0.64 0.05 (1.32) 0.70 CZ Peak_coal -0.03 (-0.04) 0.04 0.02 (0.04) 0.49 -0.16 (-0.35) 0.43 Off_coal -0.48 (-0.82) 0.29 0.14 (0.75) 0.37 -0.03 (-0.21) 0.37
Table 16: Estimates of CO2 cost pass-through rates to electricity spot prices in phase 2 (2008-2010) PT 2008 R2 2008 PT 2009 R2 2009 PT 2010 R2 2010 PT Phase 2 R2 Phase 2 DE Peak_coal 0.36 (1.35) 0.28 -0.66 (-0.67) 0.38 0.48 (0.68) 0.09 0.89 (4.12) 0.44 Off_coal -0.04 (-0.21) 0.46 -1.29 (-2.29) 0.41 0.15 (0.24) 0.23 0.13 (1.09) 0.44 FR Peak_coal 0.27 (0.89) 0.34 0.13 (0.10) 0.49 -0.49 (-0.33) 0.36 0.84 (3.19) 0.51 Off_coal -0.21 (-0.81) 0.70 -0.46 (-0.56) 0.68 -0.38 (-0.29) 0.64 -0.04 (-0.21) 0.70 UK Peak_ccgt 3.69 (3.81) 0.28 3.08 (1.42) 0.11 2.83 (0.71) 0.22 6.17 (7.61) 0.47 Off_coal 0.37 (1.74) 0.58 -0.97 (-1.90) 0.51 0.18 (0.43) 0.46 0.64 (3.20) 0.77 NL Peak_gas 0.96 (2.42) 0.18 4.56 (3.40) 0.27 -4.36 (-3.62) 0.14 1.56 (4.99) 0.31 Off_coal -0.17 (-0.89) 0.58 -0.74 (-1.26) 0.68 0.53 (0.83) 0.47 0.07 (0.47) 0.66 NP Peak_coal -0.16 (-0.79) 0.84 -0.09 (-0.25) 0.39 -4.94 (-2.32) 0.59 -0.38 (-1.53) 0.74 Off_coal -0.15 (-1.11) 0.95 -0.55 (-1.89) 0.72 1.11 (1.07) 0.89 -0.15 (1.12) 0.95 IT Peak_oil -1.23 (-1.70) 0.69 -6.39 (-2.72) 0.66 -4.87 (-2.26) 0.35 -0.99 (-1.61) 0.72 Off_ccgt 0.05 (0.12) 0.50 1.01 (0.56) 0.35 -5.43 (-2.09) 0.49 -0.23 (-0.68) 0.46 ES Peak_oil -0.42 (-0.89) 0.94 -2.98 (-2.91) 0.92 3.43 (1.83) 0.64 -0.52 (-1.39) 0.92 Off_coal -0.35 (-2.04) 0.86 -0.76 (-1.74) 0.60 4.24 (5.44) 0.56 -0.15 (-0.91) 0.79 AT Peak_coal 0.02 (0.05) 0.70 -0.87 (-0.86) 0.72 -0.28 (-0.31) 0.48 0.21 (0.67) 0.79 Off_coal -0.14 (-0.67) 0.71 -1.36 (-2.50) 0.53 -0.77 (-1.19) 0.44 -0.00 (-0.02) 0.66 PL Peak_coal -0.26 (-1.13) 0.63 -0.09 (-0.18) 0.76 -0.06 (-0.08) 0.50 0.00 (0.00) 0.67 Off_coal -0.02 (-0.23) 0.43 0.16 (0.63) 0.79 0.90 (1.87) 0.81 -0.11 (-1.16) 0.84 CZ Peak_coal 0.42 (1.50) 0.26 0.37 (0.38) 0.34 0.94 (1.29) 0.11 1.02 (4.58) 0.42 Off_coal 0.00 (0.01) 0.44 0.27 (0.46) 0.42 0.21 (0.27) 0.36 0.17 (1.41) 0.45
D
Alternatives estimates of CO
2cost pass-through
rates
D.1
Estimation results of CO
2cost pass-through rates on
forward markets
Table 17: Estimates of the CO2 cost pass-through on forward markets (front year)
PTR 2008 R2 2008 PTR 2009 R2 2009 PTR 2010 R2 2010 PTR Phase 2 R2 Phase 2 FR Base_coal 1.57 0.29 1.39 0.28 1.04 0.13 1.40 0.24 Peak_coal 1.71 0.28 1.51 0.19 1.14 0.08 1.53 0.19 DE Base_coal 1.61 0.33 1.25 0.29 1.05 0.15 1.39 0.26 Peak_coal 1.86 0.33 1.34 0.26 1.22 0.14 1.57 0.22 UK Summer Base_coal 1.92 0.35 1.25 0.19 1.62 0.20 1.64 0.27 Peak_ccgt 1.40 0.08 -0.09 -0.00 1.40 0.11 0.93 0.02 UK Winter Base_coal 2.13 0.15 1.38 0.17 1.56 0.15 1.80 0.14 Peak_ccgt 2.32 0.01 0.91 0.02 0.52 0.01 1.65 0.01 NL Base_coal 1.51 0.29 1.25 0.26 1.29 0.16 1.39 0.26 Peak_gas 0.50 0.02 0.73 0.03 0.38 0.00 0.58 0.01 NP Base_coal 1.63 0.30 1.25 0.25 1.15 0.09 1.42 0.23 AT Base_coal 1.61 0.33 1.25 0.29 1.06 0.15 1.39 0.26 Peak_coal 1.86 0.33 1.34 0.26 1.21 0.14 1.57 0.22 PL Base_coal 0.48 0.02 0.46 0.05 0.56 0.04 0.48 0.03 Peak_coal 0.43 0.00 0.52 0.02 0.24 0.00 0.43 0.01 CZ Base_coal 1.57 0.26 1.11 0.22 1.32 0.19 1.35 0.23 Peak_coal 1.17 0.05 1.29 0.08 1.55 0.14 1.25 0.06
Table 18: Estimates of the CO2 cost pass-through on forward markets (2011 Calen-dar) PTR 2008 R2 2008 PTR 2009 R2 2009 PTR 2010 R2 2010 PTR Phase 2 R2 Phase 2 DE Base_coal 1.16 0.26 1.04 0.28 1.13 0.19 1.12 0.25 Peak_coal 1.37 0.29 1.11 0.26 1.28 0.16 1.28 0.26 FR Base_coal 1.14 0.24 1.03 0.24 1.11 0.16 1.10 0.22 Peak_coal 1.53 0.28 0.99 0.09 1.19 0.10 1.32 0.18 NL Base_coal 1.13 0.28 0.98 0.28 1.17 0.20 1.09 0.26 Peak_gas 0.13 0.00 0.90 0.07 -0.55 -0.00 0.32 0.01 NP Base_coal 1.20 0.27 0.90 0.20 1.20 0.10 1.10 0.21