PURE SPECIES OF GRASS DISCRIMINATION WITH THE HELP OF
HYPERSPECTRAL IMAGING NIR
Laura Monica DALE1, Ioan ROTAR1, Anca BOGDAN1, Florin PACURAR1, Andre THEWIS2, Juan FERNÁNDEZ PIERNA3, Nicaise KAYOKA MUKENDI3, Vincent BEATEN3
E-mail: dale_lm@yahoo.com
Abstract
The possibilities to discriminate with hyperspectral imaging system, SWIR ImSpector N25E in grass mixtures of the pure species Festuca rubra L., Trifolium repens L., Agrostis capillaris L., Hieracium aurantiacum L., Arnica montana L.was the objective of this study. All the samples were collected from natural meadows, from the National Apuseni Park, Apuseni Mountains, from Gârda area. The samples were naturally dried then prepared using the protocol for NIRS analyze. The model built with PLS–DA, was used to demonstrate wether the classes discrimination between pure species is possible or not. The goal of this study was to see in other images if the pure species are or are not recognized according to the spectral data base. The potential of using the Hyperspectral Imaging NIR (Camera NIR) to discriminate or to identify pure species was confirmed. For this technique the MatLab program was used .A percentage of more than 96% correct prediction for species discrimination was obtained. This study should drive to a more important point, which is to verify whether the toxic species are or are not used as food for animals in the natural meadows. The floristic composition of a meadow can be determined only if we have in the data base, dates for each identified species, as being part of the mix.
Key words: discrimination, camera NIR, pure species, meadow
1University of Agricultural Science and Medicine Veterinary, Cluj Napoca
2 Animal Science Unit, Gembloux Agro-Bio Tech, University of Liège, Belgium
3 Walloon Agricultural Research Centre, Valorisation of Agricultural Products Department, Gembloux, Belgium
Grass is grown on hay meadow in approximate 34.85% of the Gârda area in Apuseni Mountains (Gârda, 2010). Grassland management is an important determinant of the economic viability and environmental impact of a grassland based farm. Good management of grassland reduces the need for purchase of expensive feed and limits the environmental impact by applying fertilizer, choosing the timing of grazing and a good period of mowing.
Forages contain a mixture of chemical, physical and structural characteristics that determine the quality of a pasture and the accessibility of nutrients to the target animal. Forage quality is a broader term that includes not only nutritive value, but also forage intake, especially because forage plant characteristics change with maturity. Regular and timely analyses of forage are required to determine whether forage meets the daily nutritional requirements of the animals.
Near-infrared spectroscopy is based on diffuse reflectance of ground samples and is widely used for laboratory measurements of the concentration of nutrients and feeding value in dried and fresh crop material (Berardo, 1997; Park
et al., 1998; Paul et al., 2002; Ruano-Ramos et al., 1999). In 2006, Fernandez Pierna et al., showed that the data obtained with NIR imaging instrument correspond with those obtained by conventional NIRS, and that all the advantages of conventional NIRS are possessed by the imaging instrument also. The imaging instrument contains spectral information and spatial information also. In the last years, important emphasis was put on the development of non-destructive methods for determining the quality of feed.
Thus, developed countries have initiated numerous researches aimed at the development of non-destructive methods based on the Near Infrared Spectroscopy (NIRS) technology in order to evaluate opportunities to build spectral database and perform calibration and validation of methods. The NIRS technique has been in the last ten years a more and more common practice in forage analyses techniques. Most NIR instruments used for forage evaluation cover the 1000 nm to 2500 nm part of the spectrum.
The imaging instruments are detecting adequate NIR data and present a fast answer and a good repeatability. Perspective NIR cameras and NIR spectroscopes can detect fractions of plant
species and properties of plant material (Schut et al., 2006).
Imaging spectroscopy provides the means to measure the reflectance of light with an array of detectors, combining spectral and spatial resolution. Imaging spectroscopy brings the concept of NIRS one step further, as it measures the in situ leaf reflectance with high spectral and high spatial resolution in the near-infrared area of the spectrum. This can be of interest also for the discrimination of samples not only for the variety discrimination.
The study aim is to discriminate with hyperspectral imaging system, the species Festuca rubra L., Trifolium repens L., Agrostis capillaris L., Hieracium aurantiacum L., Arnica montana L. in the mixtures grasses.
MATERIAL AND METHOD
Samples were collected in Romania, Carpathians Apuseni Mountains, Gârda Area which is included in Apuseni Natural Park.
The grass was cut into field in July 2010, and let on field to dry, the samples of grass were mixed, then were took samples from each, pure samples of Festuca rubra L., Trifolium repens L., Agrostis capillaris L., Hieracium aurantiacum L., Arnica montana L.. The samples taken were natural dried and were milled first (after one month) with Retsch Grndmx Gm200 and after that withthe Cyclotec™ 1093 Sample Mill.
The samples were scanned on a piece of teflon by SWIR ImSpector N25E hyperspectral imaging system (Specim Ltd) (fig.1). This near infrared line scan or push-broom imaging spectrometer is using a cooled, temperature stabilized MCT (Mercury-Cadmium-Telluride), detector (Xenics), combined with a conveyor belt (Burgermetrics).
The parameters for the line scan instrument are: the wavelength range: 1100 – 2400 nm by step of 6.3 nm, 209 wavelength canales, average on 32 scan/image, time of acquisition = 0.05 sec/frame = 20 frames/sec = 25sec/image (Vermeulen et al., 2010).
RESULTS AND DISCUSSIONS
Each sample was scanned in order to register the images (fig. 2), and from the images 1000 spectra were selected to be able to build a calibration model to point out the samples. The calibration model in order contained the following species (table 1).
Table 1 Class composition for calibration model
Classes Species Botanical
Family
1 Arnica montana L. (AM) Asteraceae
2 Trifolium repens L. (TR) Fabaceae
3 Hieracium aurentiacum
L. (HR)
Asteraceae
4 Festuca rubra L. (FR) Poaceae
Table 2 Calibration model Classes AM TR HA FR AM 100 0 0 0 TR 0 100 0 0 HA 0 0 100 0 FR 0 0 0 100 Table 3 The cross-validation model
Classes 1 2 3 4
1 98.40 0.30 1.20 1.000e–01
2 0 99.90 1.000e–02 0
3 0.80 0.40 98.80 0
4 0 0 0 100
In order to achieve this model, the program MatLab was used, where a class for each species was introduced. Because in the MatLab program, there was only the spectrum, it was necessary to build the Y variable, with a name for each class. After the data.set was generated, the X and Y axes were also built. With the help of PLS–DA, the probability was generated, and to be able to visualise the equation, it was necessary to use the algorithm: ConfMatrix. In the table 2, it is presented the model for the equation and in table 3., the cross-validation model.
For the external validation 5 more classes with a specific number of spectrum for each species were built. In table 4, is presented the composition of the classes and the external validation of the model is shown in table 5. Because AC species is not in the calibration model, it can be seen that the prediction is 0.
For the external validation PLS Toolbox programme was used. The axis X_Block (axels X= classes XAC, XAM, XTR, XFR, XHA) was the first to be validated and then the model built was charged for calibration. With the help of prediction, it can be seen in figure 3., that class 0, that is class AC, (for Agrostis capillaries L.), is pointed out in a clear way by the other classes, presented in table 4.
Table 4 The external validation class composition
Classes Species Botanic Family Number of spectra
1 Agrostis capillaries L.(AC) Poaceae 1188
2 Arnica montana L. (AM) Asteraceae 1225
3 Trifolium repens L. (TR) Fabaceae 1016
4 Hieracium aurentiacum L. (HA) Asteraceae 975
5 Festuca rubra L. (FR) Poaceae 1225
Table 5 External validation model
Classes 1 2 3 4 1 0 0 0 0 2 97.62 1.59 0.79 0 3 2.07 96.73 1.19 0 4 1.37 0 98.63 0 5 0 0 0.60 99.40
Figure 1 SWIR ImSpector N25E hyperspectral imaging system (VERMEULEN, et al., 2010)
Figure 2 Image of a sample before scanned with Camera NIR 200 400 600 800 1000 1200 1400 -1 -0.5 0 0.5 1 1.5 Scores on LV 1 (88.48%) Y P redi ct ed 2 ( C las s 2)
Samples/Scores Plot of X,c & Xac,
Y Predicted 2 (Class 2) Class 0 Class 1 Class 2 Class 3 Class 4 Discrim Y 2 x-axis zero y-axis zero
Figure 3 Agrostis capillaries L. species discrimination 500 1000 1500 2000 2500 3000 3500 4000 4500 5000 -0.4 -0.2 0 0.2 0.4 0.6 0.8 1 1.2 1.4 Sample Y P redi ct ed 4 (C las s 4)
Samples/Scores Plot of X,c & Xfr, Y Predicted 4 (Class 4) Class 0 Class 1 Class 2 Class 3 Class 4 Discrim Y 4 x-axis zero y-axis zero
Figure 4 Festuca rubra L. prediction
-0.4 -0.2 0 0.2 0.4 0.6 0.8 1 1.2 1.4 -400 -300 -200 -100 0 100 200 300 400 Y Predicted 4 (Class 4) S cor es on LV 2 (10. 71%)
Samples/Scores Plot of X,c & Xfr,
Scores on LV 2 (10.71%) Class 0 Class 1 Class 2 Class 3 Class 4 Discrim Y 4 x-axis zero y-axis zero
Figure 5 Festuca rubra L. species discrimination
500 1000 1500 2000 2500 3000 3500 4000 4500 5000 -1 -0.5 0 0.5 1 1.5 2 Sample Y P redi ct ed 2 (C las s 2)
Samples/Scores Plot of X,c & Xtr,
Y Predicted 2 (Class 2) Class 0 Class 1 Class 2 Class 3 Class 4 Discrim Y 2 x-axis zero y-axis zero
Figure 6 Trifolium repens L. prediction
-1 -0.5 0 0.5 1 1.5 2 -80 -60 -40 -20 0 20 40 60 80 Y Predicted 2 (Class 2) S cor es on LV 4 ( 0. 12%)
Samples/Scores Plot of X,c & Xtr,
Scores on LV 4 (0.12%) Class 0 Class 1 Class 2 Class 3 Class 4 Discrim Y 2 x-axis zero y-axis zero
Figure 7 Trifolium repens L. species discrimination
500 1000 1500 2000 2500 3000 3500 4000 4500 5000 -1 -0.5 0 0.5 1 1.5 Sample Y Pr ed ic te d 3 ( C las s 3)
Samples/Scores Plot of X,c & Xhr, Y Predicted 3 (Class 3) Class 0 Class 1 Class 2 Class 3 Class 4 Discrim Y 3 x-axis zero y-axis zero
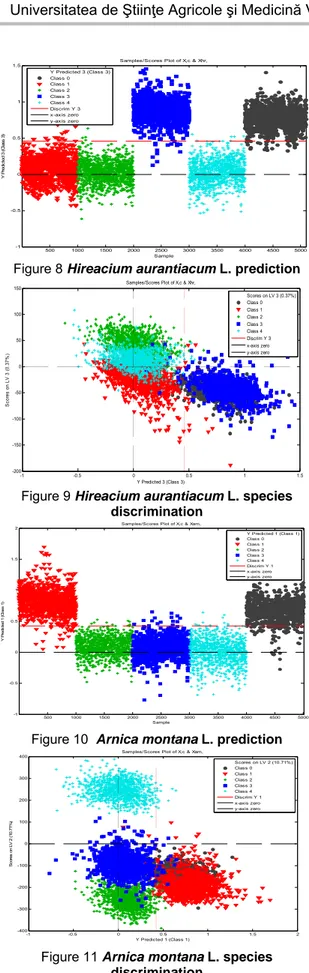
Figure 8 Hireacium aurantiacum L. prediction
-1 -0.5 0 0.5 1 1.5 -200 -150 -100 -50 0 50 100 150 Y Predicted 3 (Class 3) S co res o n LV 3 ( 0. 37% )
Samples/Scores Plot of X,c & Xhr,
Scores on LV 3 (0.37%) Class 0 Class 1 Class 2 Class 3 Class 4 Discrim Y 3 x-axis zero y-axis zero
Figure 9 Hireacium aurantiacum L. species discrimination 500 1000 1500 2000 2500 3000 3500 4000 4500 5000 -1 -0.5 0 0.5 1 1.5 2 Sample Y P red ic te d 1 ( C la ss 1)
Samples/Scores Plot of X,c & Xam,
Y Predicted 1 (Class 1) Class 0 Class 1 Class 2 Class 3 Class 4 Discrim Y 1 x-axis zero y-axis zero
Figure 10 Arnica montana L. prediction
-1 -0.5 0 0.5 1 1.5 2 -400 -300 -200 -100 0 100 200 300 400 Y Predicted 1 (Class 1) S cor es on LV 2 ( 10 .7 1% )
Samples/Scores Plot of X,c & Xam,
Scores on LV 2 (10.71%) Class 0 Class 1 Class 2 Class 3 Class 4 Discrim Y 1 x-axis zero y-axis zero
Figure 11 Arnica montana L. species discrimination
For the species mentioned above the samples were scanned and the following values were obtained: the species AC of the calibration model is positive in this interval, this is marked in with black, and can be observed that this species was pointed out compared to the other 4 species that were taken in this study with the help of NIRS
technique. In the image 2d, AC is pointed out in this way, so it can be observed that the specie doesn’t overlay one at other, each has its own space. This image exists due to the fact that AC is not in the calibration system and because of this the confusion matrix can not be determined.
In figure 4, it can be observed that the FR species is included initially in the model and because of this there is an error present: Class 0, that is FR of the external validation model, is precise as the class FR 99.40%, HA 0.60%, TR 0%, AM 0%. In figure 5, it can be observed clearly, that class 4 covers class 0 almost entirely, and that means that FR is predicted as species to be Festuca rubra L..
In figure 6, it can be observed that the species TR is a species included in the initial model, and because of this there is the following error: Class 0, which is TR from the model of external validation is predicted as FR 0%, HA 1.19%, TR 96.73%, AM 2.07%. In figure 7, it can be observed clearly that class 4 that covers almost entirely class 0, which means TR, is predicted as species Trifolium repens L..
In figure 8, it can be observed that HA is a species included in the initial model, and because of this there is the following error: Class 0, which is HA in the external validation model, is predicted as class FR 0%, HA 98.63%, TR 0%, AM 1.37%. In figure 9, it can be observed, that class is covering class 0 almost entirely, and this means that Hieracium arantiacum L. is predicted as a HR.
In figure 10, it can be observed that AM is a species included in the initial model, and for that there is the following error: Class 0, which is AM of the external validation model is predicted as class FR 0%, HA 1.59%, TR 0.79%, AM 97.62%. In figure 11, it can be observed, clearly, that AM class covering class 0 almost entirely, that means Arnica montana L. is predicted as AM species.
The model built with PLS–DA, was used to demonstrate wether the classes discrimination between pure species was possible or not. More than 96% of the predictions obtained with the help of the programme are correct by predicted, as it can be seen in external validation model.
In 2006 Schut et al., indicates that this concept of using the imaging spectroscopy for prediction of yields, nutrients concentration and nutritive value was used in practical field by Daughtry et al., 2005, Nagler et al., 2003.
These methods of the imaging spectroscopy are based on a mathematical description of the differences between instruments or between recording dates that is based on recording a set of reference standards before measurement.
CONCLUSIONS
The discrimination or the highlighting of the pure species is made using the Imaging NIR instrument (Camera NIR) with a very good standard prediction error (SEP), the SEP for FR is 99.40%, for TR is 96.73%, for HA is 98.63% and for AM is 97.62%.
The goal for the next study will be to see in other images of binary and ternary mixtures if the pure species are or are not recognized according to the spectral data base with the potential of using the Hyperspectral Imaging NIR (Camera NIR) to discriminate or to identify pure species.
The floristic composition of a meadow can be determined only if there are data for each identified species in the data base, as being part of the mixtures.
So, the calibration model can be used in order to discriminate species, we have to use this model to discriminate from mixtures of two or three species, to see if it is possible or not.
ACKNOWLEDGEMENTS
We thank the CRA-W Gembloux for providing technical advice on the hyperspectral NIR instrument, PN II IDEI 1485, contract no. 1099 unfolded by CNCSIS.
BIBLIOGRAPHY
Berardo, N., 1997 - Prediction of the chemical
composition of white clover by near-infrared reflectance spectroscopy, Grass Forage Science,
52, 27-32.
Daughtry, C.S.T., Hunt, E.R., Doraiswamy, P.C, McMurtrey, J.E., 2005 - Remote sensing the
spatial distributionof crop residues. Agronomy
Journal 97, 864-871.
Fernandez Pierna, J.A., Baeten, V., Dardenne, P., 2006 - Screening of compound forages using NIR
hyperspectral data, Chemometrics and Intelligent Laboratory Systems 84, 114-118.
Gârda, N., 2010 - Studiul unor elemente de landșaft
montan (cu privire specială asupra ecosistemelor de pajiști din comuna Gârda de Sus, Munții Apuseni. Doctoral Thesis.
Nagler, P.L., Inoue, Y., Glenn, E.P., Russ, A.L., Daughtry, CS.T., 2003 - Cellulose absorption
index (CAI) to quantify mixed soil plant litter scenes, Remote Sens. Environ. 87, 310-325.
Park, R., Agnew, R., Gordon, F., Steen, R., 1998 - The
use of near infrared reflectance spectroscopy (NIRS) on undried samples of grass silage to predict chemical composition and digestibility parameters, Animal Feed Science Technologie
72, 155-167.
Paul, C., Hausler, A., 2002 - Developing the NIRS
Harvest Line concept for forage trials, Grasslans
Science Euro, 7:464–465.
Ruano-Ramos, A., Garcia-Ciudad, A., Garcia-Criado, B. 1999 – Determination of nitrogen and ash
contents in total herbage and botanical components of grassland systems with near infrared spectroscopy, Journal of Science Food
Agriculture, 79:137-143.
Schut, A.G.T., Van der Heijden, A.M., Hoving, I., Stienezen, M.W., Van Evert, F.K., Meuleman, J., 2006 - Imaging spectroscopy for on-farm
measurement of grassland yield and quality,
Agronomy Journal 98, 1318-1325.
Vermeulen, P., Fernández Pierna, J.A., Burger, J., Tossens, A., Dardenne, P., Baeten, V., 2010
-NIR Hyperspectral Imaging and Chemometrics as a lab tool for the quality control of agricultural products, Chemometrics in analytical chemistry.
Antwerp, Belgium: Poster in: Chemometrics in analytical chemistry (CAC).