Detection of CN gas in Interstellar Object 2I/Borisov
Alan Fitzsimmons,1 Olivier Hainaut,2 Karen J. Meech,3 Emmanuel Jehin,4 Youssef Moulane,5, 6, 7 Cyrielle Opitom,5Bin Yang,5Jacqueline V. Keane,3Jan T. Kleyna,3Marco Micheli,8, 9andColin Snodgrass10
1Astrophysics Research Centre Queen’s University Belfast
Belfast BT7 1NN, UK 2European Southern Observatory
Karl-Schwarzschild-Strasse 2 D-85748 Garching bei M¨unchen, Germany
3Institute for Astronomy 2680 Woodlawn Drive Honolulu, HI 96822 USA
4STAR Institute Universit´e de Li`ege All´ee du 6 aoˆut, 19C
4000 Liege, Belgium 5European Southern Observatory
Alonso de Cordova 3107 Vitacura, Santiago, Chile
6STAR Institute Universit´e de Liege All´ee du 6 aoˆut, 19C
4000 Liege, Belgium 7Oukaimeden Observatory Cadi Ayyad University, Morocco 8ESA NEO Coordination Centre
Largo Galileo Galilei, 1 00044 Frascati (RM), Italy 9INAF - Osservatorio Astronomico di Roma
Via Frascati, 33
00040 Monte Porzio Catone (RM), Italy 10Institute for Astronomy,
University of Edinburgh, Royal Observatory, Edinburgh EH9 3HJ, UK
(Received September 26, 2019; Revised September 30, 2019; Accepted October 1, 2019) Submitted to ApJ Letters
ABSTRACT
The detection of Interstellar Objects passing through the Solar System offers the promise of constrain-ing the physical and chemical processes involved in planetary formation in other extrasolar systems. While the effect of outgassing by 1I/2017 U1 (’Oumuamua) was dynamically observed, no direct de-tection of the ejected material was made. The discovery of the active interstellar comet 2I/Borisov means spectroscopic investigations of the sublimated ices is possible for this object. We report the first detection of gas emitted by an interstellar comet via the near-UV emission of CN from 2I/Borisov
Corresponding author: Alan Fitzsimmons
a.fitzsimmons@qub.ac.uk
at a heliocentric distance of r = 2.7 au on 2019 September 20. The production rate was found to be Q(CN) = (3.7 ± 0.4) × 1024 s−1, using a simple Haser model with an outflow velocity of 0.5 km s−1.
No other emission was detected, with an upper limit to the production rate of C2 of 4 × 1024 s−1.
The spectral reflectance slope of the dust coma over 3900 ˚A < λ < 6000 ˚A is steeper than at longer wavelengths, as found for other comets. Broad band Rc photometry on 2019 September 19 gave a
dust production rate of Af ρ = 143 ± 10 cm. Modelling of the observed gas and dust production rates constrains the nuclear radius to 0.7 − 3.3 km assuming reasonable nuclear properties. Overall, we find the gas, dust and nuclear properties for the first active Interstellar Object are similar to normal Solar System comets.
Keywords: comets: individual (C/2019 Q4) — comets: general 1. INTRODUCTION
Solar System formation models suggest that a large number of planetesimals were ejected to space as the giant planets formed and migrated. Most of these plan-etesimals are expected to be icy (i.e. comet-like) with only a small fraction of them being rocky objects (Meech
et al. 2016;Engelhardt et al. 2017). Assuming that
simi-lar processes have taken place elsewhere in the Galaxy, a large number of planetesimals are wandering through in-terstellar space, some eventually crossing the Solar Sys-tem. Many decades of comet and asteroid studies have yielded formation models that explain the mass distribu-tion, chemical abundances, and planetary configuration of the Solar System today. However, studies of exoplanet systems have shown that many different planetary sys-tem architectures can exist. It is still uncertain whether the Solar System is typical of planetary systems in gen-eral. Interstellar Objects (ISOs) provide an opportunity to study the planet-building process in extrasolar plan-etary systems.
The first known ISO, 1I/2017 U1 (’Oumuamua), was discovered on 2017 October 19 and followed by a short intense period of observation as it faded quickly as it receded from Earth. Assuming it was dark, 1I was very red and small with an average diameter of 200m (Meech
et al. 2017). However, it could possibly be as small as
100 m across if it has a higher albedo (Trilling et al. 2018). ‘Oumuamua’s rotational light curve was extraor-dinary, with a brightness range of over 2.5 magnitudes, implying that it had a very elongated nucleus with an axis ratio >5:1, perhaps as large as 10:1. Further, it was found to be in an excited rotation state with a period of 8.67±0.34 h precessing around the angular momen-tum vector, and a longer period of ∼54 h. Because of the long damping timescale, this excited state was likely caused by its ejection from its home star system (Belton
et al. 2018; Fraser et al. 2018; Drahus et al. 2018).
Al-though there were very sensitive searches for dust and gas (Meech et al. 2017; Ye et al. 2017; Trilling et al. 2018), none were detected. Spectroscopy only revealed a
red featureless spectrum similar to that expected for an irradiated cometary surface (Fitzsimmons et al. 2018). Nevertheless, non-gravitational accelerations were de-tected in 1I’s motion combining astrometry from the ground and with the long extension of arc afforded by HST observations (Micheli et al. 2018). The only plau-sible explanation for this acceleration was comet out-gassing at a level below our ability to detect it during the ∼2-week period that we had for detailed observa-tions.
One of the most important questions left unanswered from the study of ’Oumuamua was “What is it made of?” It had been expected that any ISO would proba-bly be ice-rich, displaying cometary activity if it passed within the sublimation distance of the Sun for its con-stituent ices. This in turn would allow spectroscopy of the coma gases. The near-inert nature of 1I was ini-tially puzzling, although subsequent studies have shown it is consistent with ejection mechanisms and subse-quent evolution in interstellar space (see ’Oumuamua
ISSI Team et al.(2019) and references within).
On 2019 August 30 Gennady Borisov at the MARGO observatory in Crimea discovered Comet C/2019 Q4 (Borisov) at small solar elongation in the morning twi-light. The orbit was very quickly shown to be hyper-bolic, with an eccentricity > 3 (MPEC 2019-R106; 2019 September 11). On September 24 it was officially named by the IAU as 2I/Borisov - the second known ISO. Un-like 1I, this second ISO was discovered before perihe-lion (q = 2.0 au; 2019 December 8) and will be well placed for observing before it goes into solar conjunc-tion again in 2020 October. Initial photometry showed it to possess broad-band optical colors similar to other active comets with significant dust comae (Guzik et al. 2019). An optical spectrum showed a featureless red re-flectance spectrum (de Le´on et al. 2019). However, to probe the composition of an ISO and compare its na-ture to our own Solar System requires identification and measurement of emission or absorption features within
its spectrum. In this paper we report the first detection of gas in the coma of an interstellar comet.
2. OBSERVATIONS AND DATA REDUCTION 2I/Borisov was observed with the 4.2 m William Her-schel Telescope (hereafter WHT) plus ISIS spectrograph on La Palma on 2019 September 20.2 UT. The obser-vational circumstances are given in Table 1. The ISIS R300B grating was used with an intrinsic spectral re-solving power of λ/δλ = 976. The detector was a blue-sensitive EEV-4280 CCD, giving a pixel scale of 0.86 ˚
A pixel−1 at 4000 ˚A. Two 900-second and two 1200-second exposures were obtained through a 200 wide slit, chosen to maximise the cometary flux while minimis-ing the background flux due to airglow, astronomical twilight and moonlight. This slit width decreased the effective resolution to 9.5 ˚A at 4000˚A. Due to the faint-ness of the comet, atmospheric extinction at airmasses ≥ 2.0 and the rapidly brightening sky, only two of the four exposures obtained were found to contain cometary flux at wavelengths < 4500 ˚A, starting at 05:19 UT (900 second exposure) and 05:38 UT (1200 second exposure). An exposure of the spectrophotometric standard G191-B2B (Bohlin et al. 1995) was obtained immediately af-terwards using a 1000wide slit to enable flux calibration. The WHT spectra were bias subtracted and flat-fielded. The wavelength calibration used CuNe+CuAR exposures made directly after the observations of the comet, resulting in an rms uncertainty of 0.04˚A in the range 3200 − 6000 ˚A. The spectrum of the comet was extracted over 800centered on the comet, with the back-ground sky measured 1000 to 3000 from the nucleus.
Flux calibration was performed using the G191-B2B spectrum assuming the standard atmospheric extinction curve for La Palma (King 1985). There was thin cloud present during the observations, and combined with the high airmass, we caution that the uncertainty in the flux from the comet could potentially be at the level of tens of percent.
As part of our campaign to get astrometric observa-tions of 2I to confirm that its orbit was hyperbolic, we also obtained images using the Canada-France-Hawaii Telescope (hereafter CFHT) and MegaCam on 2019 Sep. 9 and 10. Megacam covers a 1 × 1 square degree field of view at a pixel scale of 0.1800/pixel. The data were ob-tained through an SDSS r0-band filter. Our pipeline processing performs bias subtraction and flatfielding, and calibrates images against the Pan-STARRS DR2 database (Flewelling et al. 2016) to provide a photo-metric zero point for each frame.
Additionally, BV RcIc photometry of 2I was
per-formed with TRAPPIST-North (hereafter TN) located
at Oukaimeden observatory, Morocco (Jehin et al. 2011). TN is equipped with a 2K×2K CCD camera with a field of view of 220×220, the pixels are binned 2× by 2 to give
a plate scale of 1.200/pixel. Attempts were made on other dates but were thwarted by moonlight. With TN there was only a 30 minute window to observe the comet > 25◦ above the horizon. Data calibration followed standard procedures using frequently updated master bias, flat and dark frames. The removal of the sky contamina-tion and the flux calibracontamina-tion were performed using TN zero points that are regularly updated. Observational circumstances of all photmetry are given in Table1.
3. ANALYSIS 3.1. Gas Emission
To identify any emission bands, we removed the un-derlying continuum resulting from reflected sunlight by dust. We used a scaled and reddened standard refer-ence solar spectrum. After subtracting this spectrum, the comet spectra should only consist of gas fluores-cence emission features. The spectrum before and af-ter removal of the dust continuum is shown in Fig. 1
and shows strong CN (0-0) gas emission due to solar fluorescence at 3880 ˚A. Both the wavelength and the asymmetric profile confirm this as CN.
The CN(0-0) emission was seen in both analysed spec-tra, with an equal intensity within the measurement un-certainties. Unfortunately it was found that combin-ing these spectra resulted in slightly lower S/N than using only the spectrum obtain at 05:38 UT. This was due to the 05:19 UT spectrum being at higher airmass and with higher sky background. Hence we only used the 05:38 UT spectrum for analysis. The CN emis-sion was directly measured by approximating the band shape with two free-fitted gaussians, giving a flux of (8.4±0.9)×10−15ergs s−1cm−2. Using the fluorescence scattering efficiency factors fromSchleicher(2010), this gives (1.2 ± 0.1) × 1026 CN molecules within the extrac-tion aperture.
We used a simple optically-thin Haser model (Haser 1957) to calculate gas production rates using the scale-lengths from A’Hearn et al. (1995). We have adopted an outflow velocity of 0.85/√rh= 0.5 km s−1 (Cochran
& Schleicher 1993). Due to the small size of the
spec-troscopic aperture, we numerically integrated the Haser model within the slit to derive the corresponding pro-duction rate of CN. We find Q(CN)= (3.7 ± 0.4) × 1024 s−1. Assuming this gas is only created through the pho-todissociation of HCN, this would be the sublimation rate of this parent molecule from the nucleus.
Fig.2shows the spatial profile of the CN column den-sity in our data. Overlaid is a predicted Haser column
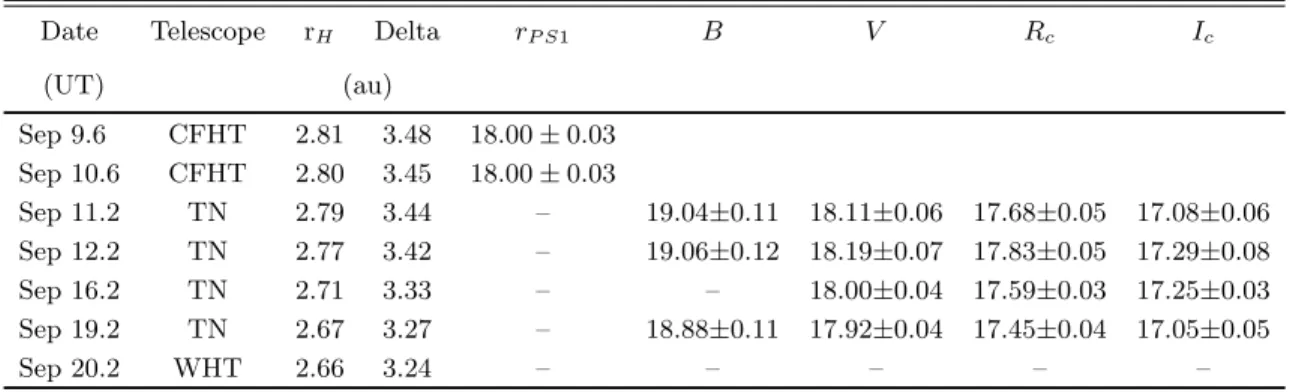
Table 1. Log of Photometric (CFHT, TN) and spectroscopic (WHT) observations of 2I/Borisov. CFHT magnitudes were measured through a 500aperture, TN through a 4.200aperture.
Date Telescope rH Delta rP S1 B V Rc Ic
(UT) (au) Sep 9.6 CFHT 2.81 3.48 18.00 ± 0.03 Sep 10.6 CFHT 2.80 3.45 18.00 ± 0.03 Sep 11.2 TN 2.79 3.44 – 19.04±0.11 18.11±0.06 17.68±0.05 17.08±0.06 Sep 12.2 TN 2.77 3.42 – 19.06±0.12 18.19±0.07 17.83±0.05 17.29±0.08 Sep 16.2 TN 2.71 3.33 – – 18.00±0.04 17.59±0.03 17.25±0.03 Sep 19.2 TN 2.67 3.27 – 18.88±0.11 17.92±0.04 17.45±0.04 17.05±0.05 Sep 20.2 WHT 2.66 3.24 – – – – –
3500
4000
4500
5000
5500
6000
-5.0e-16
0.0e+00
5.0e-16
Flu
x (
er
gs
/s/
cm
2/Å
)
(a)
Comet Borisov
Fitted Solar spectrum
3700
3750
3800
3850
3900
3950
4000
4050
4100
Wavelength (Å)
-2.5e-16
0.0e+00
2.5e-16
5.0e-16
7.5e-16
1.0e-15
Flu
x (
er
gs
/s/
cm
2/Å
)
CN emission
(b)
Figure 1. (a) Flux calibrated spectrum of 2I/Borisov through a 200 by 800aperture centered on the comet. Also shown is a scaled solar spectrum reddened to match the observed dust continuum. (b) Spectral region around the CN (0-0) emission band with the background dust continuum subtracted.
density profile assuming the same A’Hearn et al. scale-lengths. We note that there is some indication of a faster fall-off in column density than normally observed. How-ever, these data were dominated by the bright ground sky where small changes in the fitted sky back-ground can give rise to large changes in the measured flux. There is also the aspect that the nominal scale-lengths from A’Hearn et al. are only scaled as helio-centric distance r2
h, assuming an outflow velocity of 1
km −1. While the Haser model is not physically
re-alistic, we can approximate the effect of our slower as-sumed outflow velocity by scaling the parent scalelength (for HCN as the parent molecule, the daughter velocity will be dominated by the photodissociation energy and hence will be less affected). The resulting Haser profile can be seen in Fig. 2 to provide a better match to the measured column densities. Therefore we conclude that within measurement and modelling uncertainties, there is no significant evidence for different CN scalelengths in these data compared to other comets.
No other emission features were apparent in our spec-tra. In active Solar System comets, the second most prominent emission feature in optical spectra is the C2(0-0) emission band with a band head at 5167˚A.
Around this wavelength our WHT spectrum has an rms uncertainty of 8.1 × 10⁻¹⁷ergs s−1 cm−2˚A−1. Using an effective bandwidth of ∼ 100˚A for this emission band, and using the standard relationship for spectroscopic up-per limits (Cochran et al. 2012), we find a 3σ upper limit to the C2(0-0) flux of 6 × 10⁻¹⁵ ergs s−1 cm−2.
Performing a similar analysis to CN with Haser model scalelengths from A’Hearn et al. (1995), we derive an upper limit of Q(C2)≤ 4 × 1024s−1.
3.2. Dust Continuum
The lack of observable gas emission at λ > 3900 ˚A al-lows a clean measurement of the coma dust reflectance spectrum (assuming a negligible contribution from the nucleus). We divided the fluxed comet spectrum by the standard solar spectrum and normalised the calculated reflectance spectrum to 1 at 5500 ˚A. This resulted in a linear spectrum in the range 3900 ˚A< λ < 6000 ˚A with a slope of 19.9±1.5%/103˚A. This is approximately twice as steep as that reported byde Le´on et al.(2019) in the range 5500 ˚A< λ < 9000 ˚A. However, we note that their published dust reflectance spectrum appears to become steeper at λ < 6000 ˚A, where our data lie. In support of this, the mean colors of the comet mea-sured from our TN imaging data through a 4.200 aper-ture (corresponding to about a 10000 km radius) over the preceeding 9 days were (B − V ) = 0.92 ± 0.06 and (V − Rc) = 0.41 ± 0.01. These correspond to
spec-tral slopes of 24%/103 ˚A over 4380 ˚A< λ < 5450 ˚A
and 6%/103 ˚A over 5450 ˚A< λ < 6410 ˚A. All these
data agree with the general spectral behavior of normal comet dust being redder at shorter wavelengths (Jewitt
& Meech 1986). We conclude that our data are
con-sistent in finding a steep spectral reflectance slope at blue-visual wavelengths.
As the WHT spectra showed no gas emission in the B and V bands, we have used the TN magnitudes to calculate relative dust production rates using the Af ρ formalism of A’Hearn & Millis (1984) and correcting to zero degrees phase angle using the composite dust phase function of D. Schleicher1. We find relative dust production rates for a radius of 104 km in each filter
of (Af ρ)B = 88 ± 15 cm, (Af ρ)V = 140 ± 15 cm,
(Af ρ)Rc = 143 ± 10 cm and (Af ρ)Ic = 142 ± 13 cm. Although these data were obtained 24 hours before the
1https://asteroid.lowell.edu/comet/dustphase.html
WHT spectra, the TN monitoring shows no significant evolution of the coma brightness over the previous 9 nights, and so we take these values as representative of the coma on September 20.2 UT.
4. DISCUSSION
4.1. Comparison with other active comets 2I/Borisov at 2.7 au appears to be similar but slightly less active than many long-period comets observed at similar distances. These include C/2013 R1 (Lovejoy) with Q(CN)= 1.9 × 1025 s−1 at 2.7 au post
perihe-lion (Opitom et al. 2015); C/2013 A1 (Siding Spring) with Q(CN)= 1.1 × 1025 s−1 at 2.4 au pre-perihelion
(Opitom et al. 2016); C/2014 W2 (PANSTARRS) with
Q(CN)= 5.3 × 1024 s−1 at perihelion at 2.7 au (
Hy-land et al. 2019). Short-period comets often display
weaker outgassing rates. 9P (Tempel 1) was found to have Q(CN) =1.8 × 10²³s−1 inbound at 2.4 au (Meech
et al. 2011), while 67P (Churyumov-Gerasimenko) had
Q(CN)= 1.3 × 1024s−1 inbound at 1.3 au and Q(CN)=
9.0 × 10²³s−1 outbound at 2.9 au (Opitom et al. 2017).
Hence it is clear that the range of gas production rates measured for Solar System comets spans our measure-ment of 2I/Borisov.
Similarly, we find that the gas/dust and relative gas production rates are not obviously different to ‘nor-mal’ Solar System comets. In Fig. 3 we compare the large number of measurements of Q(CN)/Q(C2) and
Q(CN)/Af ρ from the Lowell Observatory Comet Pho-tometry Database (Osip et al. 2003) which used the same Haser model scalelengths. It should be noted that these comets were a mixture of Long-Period and Short-Period Comets observed over a range of heliocentric dis-tances. Also, the Lowell database production rates as-sume v = 1 km s−1for all comets; using this for our data would decrease Q(CN) and our upper limit to Q(C2) by
a factor 2. Nevertheless, it is apparent from these data that both the gas/dust and the relative amounts of CN and C2 produced by 2I/Borisov are consistent with the
bulk population of Solar System comets previously mea-sured.
Given this similarity, we can use the above measure-ments to estimate the possible gas-to-dust-ratio emit-ted by the nucleus, assuming the measured proper-ties of Solar System comets. For the gas mass loss rate, this is straightforward. Normal comets have Q(H2O)/Q(HCN)' 500 (Bockel´ee-Morvan et al. 2004),
which for our derived Q(CN) would imply Q(H2O)
= 1.7 × 1027 s−1, assuming all CN results from the
dis-sociation of HCN. Assuming the gas mixing ratio, 77% water, 13% CO and 10% other gas, then the gas mass loss rate is dMg' 3.4 × 10⁻²⁶×Q(H2O)' 57 kg s−1.
10
310
410
5Distance from nucleus (km)
10
910
10Co
lum
n
de
ns
ity
(m
ole
cu
les
cm
2)
Figure 2. CN column density as a function of distance from the nucleus of 2I/Borisov. The solid line indicates the Haser model assuming scalelengths that only vary as r2
h. The dashed line shows the same model but with a parent scale length that scales as outflow velocity v.
21.0 21.5 22.0 22.5 23.0 23.5 24.0 24.5
Log Q(CN)/Afp
23.5
24.0
24.5
25.0
25.5
26.0
26.5
27.0
27.5
Log Q(CN)
(a)
1.5
1.0
0.5
0.0
0.5
1.0
Log [Q(C
2)/Q(CN)]
23.5
24.0
24.5
25.0
25.5
26.0
26.5
27.0
27.5
Log Q(CN)
(b)
Figure 3. (a) Comparison between 2I (red data point) and Q(CN)/Af ρ from theOsip et al.(2003) database for a variety of comets with different Q(CN). We use (Af ρ)V for 2I to match the green continuum data from the Lowell database. Uncertainties on 2I assume a conservative 50% uncertainty due to thin cloud at the time of observation. Error bars for the Lowell database are omitted for clarity. (b) As for (a) but for Q(C2)/Q(CN) indicating our upper limit for Q(C2).
It is more difficult to estimate the dust production rate using Af ρ. Using the observed Rc magnitude and the
simplistic assumptions of a single dust grain diameter of 1 µm, a grain albedo of 0.04, density of 1000 kg m−3, and radially outflowing dust with velocity Vd = 100 m
s−1, then Q(dust)' 1 kg s−1. While this implies a very
low dust/gas ratio, some Solar System comets such as 2P/Encke have this characteristic. On the other hand, assuming larger dust particles of size 20 µm (see below) results in Q(dust)' 30 kg s−1and a dust/gas ratio ∼ 1. This is closer to, but still lower than, in-situ Rosetta pre-perihelion measurements of comet 67P, which had a
dust/gas ratio of ∼ 4 (Rotundi et al. 2015). However we caution these estimates remain highly uncertain.
4.2. Nucleus size
While it is premature to do any detailed modeling with the current limited data, we can explore the parameter space further to place some limits on the nucleus size from the ground-based photometry and the CN produc-tion rate. First, assuming that all of the CFHT flux within a 500 radius photometry aperture for data ob-tained is scattered light from a nucleus with an albedo of 0.04, this implies a nucleus radius, RN ∼ 8 km.
How-ever, given that there is visible dust in the coma, this is an extreme upper limit. We can use a surface ice subli-mation model (Meech et al. 1986;Meech & Svoren 2004) with constraints on the gas production from our CN ob-servations to investigate the activity for 2I, and get some information about the minimum nucleus radius.
If we assume that the CN/OH ratio for 2I/Borisov is typical of Solar System comets (A’Hearn et al. 1995), this implies a water production rate, Q(H2O) = (1.3–
5.1)× 1027 molec s−1. If, on the other hand we assume that 2I is depleted in CN at the level inferred for 1I from the amount of outgassing by water needed to explain its gravitational acceleration combined with the non-detection of CN (Micheli et al. 2018), the suggested pro-duction rate is Q(H2O) ∼7 × 1027 molec s−1. Finally,
if 2I had the chemistry of the severely depleted comet 96P/Machholz (Schleicher 2008), then the inferred pro-duction rate is ∼1.1 × 1029 molec s−1.
The model computes the amount of gas sublimating from an icy surface exposed to solar heating. The total brightness within a fixed aperture combines radiation scattered from both the nucleus and the dust dragged from the nucleus in the escaping gas flow, assuming a dust to gas mass ratio of 1. This type of model can distinguish between H2O, CO, and CO2 driven
activ-ity. The model free parameters include: nucleus radius, albedo, emissivity, nucleus density, dust properties, and fractional active area.
The shape of the light curve – i.e. where the curve is steep or shallow – is determined by the sublimating ice composition. With reasonable estimates of nucleus size, albedo, density, and grain properties, the fractional active surface area is adjusted to produce the observed volatile production rates. We assume an albedo of 0.04 for both the nucleus and dust and a linear phase func-tion of 0.04 mag deg−1 typical of other comets. We assume a nucleus density of 400 kg m−3 similar to that seen for comets 9P/Tempel 1, 103P/Hartley 2 (Thomas 2009) and 67P/Churyumov-Gerasimenko (P¨atzold et al. 2016), a grain density of 1000 kg m−3, and micron-sized
grains. Taking a typical fractional active sublimation area of 4% seen for most comets (A’Hearn et al. 1995), we can fit the data for a nucleus of radius RN = 3.3
km, but only for larger grains (∼ 20 µm). Alternatively, a model with a nucleus radius as small as RN = 0.7
km can fit the data, but only if 100% of the surface is active, again using large grains (see Fig.4). The larger grains require more gas to lift, and contribute less to the scattered brightness from the coma. Our model cannot differentiate between this range in radii with the present data. However the lack of previous detections of active ISOs would favour a smaller size.
Additionally, we ran a canonical model assuming that 2I was driven by CO sublimation, shown as the blue curve in Fig.4. If this occurred then our model predicts a search for precovery observations of 2I would be worth-while, albeit noting the small solar phase angle in mid-2019. A pure water ice sublimation model predicts that 2I would have been likely very faint prior to going into solar conjunction around May 2019. A non-detection of the comet in such data would provide significant support for H2O being the main activity driver of 2I.
5. CONCLUSIONS
We present the first spectroscopic detection of gas emitted by an ISO, 2I/Borisov, on 2019 September 20, using the 4.2 m William Herschel Telescope. Combin-ing these spectra with broad-band photometry 24 hours earlier from the 0.6 m TRAPPIST-North telescope, we present the following results.
1. 2I/Borisov has CN gas present in its coma, with a gas production rate of Q(CN)= 4 × 1024 s−1 at
2.7 au.
2. The upper limit of Q(C2)≤ 4 × 1024 s−1 is
consis-tent with gas abundance ratios measured in Solar System comets.
3. The dust reflectance spectrum is redder at shorter wavelengths, in agreement with previous studies of cometary dust.
4. The true gas/dust ratio is poorly constrained due to the unknown dust size distribution, however the observed Q(CN)/Af ρ is unremarkable when com-pared to the previously observed population of So-lar System comets. The real dust/gas mass ratio is also likely similar to Solar System comets. 5. Assuming that the properties of 2I are similar
to Solar System comets, it implies that the nu-cleus may be between 0.7-3.3 km, is ejecting large grains, and if it is on the small end, the comet likely has a large fraction of the surface active.
Figure 4. Predicted brightness of 2I as a function of true anomaly using our model described in the text, consistent with magnitudes measured from CFHT and TN (closed and open symbols respectively). Red and blue curves show predicted brightness for water-dominated and carbon monoxide-dominated sublimation respectively. A true anomaly of 0◦ represents perihelion.
Models of planetary system predict that the forma-tion of the icy planetesimals we call comets should be ubiquitous (Raymond et al. 2018). Yet models of pro-toplanetary disks predict a range of possible disk com-positions. For example, the HCN/H2O ratio can vary
by a factor > 100 in protoplanetary disks depending on distance from the star and evolutionary stage (Eistrup
et al. 2019). We also know that within the Solar System,
∼ 30% of comets exhibit strong depletions in carbon-chain molecules such as C2and C3(A’Hearn et al. 1995),
and significant variations in nuclear ice species such as HCN and CH3OH exist (Mumma & Charnley 2011).
The observation of primary ice species such as H2O,
CO2, CO, or their dissociation products, would place the
analysis presented here on a much firmer footing. Cur-rently, our knowledge of the composition of 2I is still rel-atively unconstrained. For example, we do not yet know if 2I is depleted in C2. Yet our data also show it is not C2
rich, and the CN/dust ratio is normal when compared to other comets. The normal scalelengths for production of cometary CN via photodissociation match the observed column density distribution, indicating similar
produc-tion pathways. If it were not for its interstellar nature, our current data shows that 2I/Borisov would appear as a rather unremarkable comet in terms of activity and coma composition.
Acknowledgements We thank the anonymous referee for rapid and helpful comments on the initial version of this manuscript. We also thank Lilian Dominguez and Ian Skillen of the Isaac Newton Group for per-forming these observations for us at short notice un-der service programme SW2019b04. The WHT is op-erated on the island of La Palma by the Isaac New-ton Group of Telescopes in the Spanish Observatorio del Roque de los Muchachos of the Instituto de As-trofsica de Canarias. TRAPPIST is a project funded by the Belgian Fonds (National) de la Recherche Scien-tifique (F.R.S.-FNRS) under grant FRFC 2.5.594.09.F. TRAPPIST-North is a project funded by the University of Liege, in collaboration with Cadi Ayyad University of Marrakech (Morocco). E.J is F.R.S.-FNRS Senior Re-search Associate. AF and CS acknowledge support for this work from UK STFC grants ST/P0003094/1 and ST/L004569/1. KJM, JTK, and JVK acknowledge sup-port through awards from NASA 80NSSC18K0853.
REFERENCES A’Hearn, M. F., Millis, R. C., Schleicher, D. O., Osip, D. J.,
& Birch, P. V. 1995, Icarus, 118, 223
A’Hearn, M. F., & Millis, R. L. 1984, ApJL, 282, L43 Belton, M. J. S., Hainaut, O. R., Meech, K. J., et al. 2018,
ApJL, 856, L21
Bockel´ee-Morvan, D., Crovisier, J., Mumma, M. J., & Weaver, H. A. 2004, The composition of cometary volatiles (Univ. of Arizona Press), 391
Bohlin, R. C., Colina, L., & Finley, D. S. 1995, AJ, 110, 1316
Cochran, A. L., Barker, E. S., & Gray, C. L. 2012, Icarus, 218, 144
Cochran, A. L., & Schleicher, D. G. 1993, Icarus, 105, 235 de Le´on, J., Licandro, J., Serra-Ricart, M., et al. 2019,
Research Notes of the AAS, 3, 131.
https://doi.org/10.3847%2F2515-5172%2Fab449c Drahus, M., Guzik, P., Waniak, W., et al. 2018, Nature
Astronomy, 2, 407
Eistrup, C., Walsh, C., & van Dishoeck, E. F. 2019, A&A, 629, A84
Engelhardt, T., Jedicke, R., Vereˇs, P., et al. 2017, AJ, 153, 133
Fitzsimmons, A., Snodgrass, C., Rozitis, B., et al. 2018, Nature Astronomy, 2, 133
Flewelling, H. A., Magnier, E. A., Chambers, K. C., et al. 2016, arXiv e-prints, arXiv:1612.05243
Fraser, W. C., Pravec, P., Fitzsimmons, A., et al. 2018, Nature Astronomy, 2, 383
Guzik, P., Drahus, M., Rusek, K., et al. 2019, arXiv e-prints, arXiv:1909.05851
Haser, L. 1957, Bulletin de la Societe Royale des Sciences de Liege, 43, 740
Hyland, M. G., Fitzsimmons, A., & Snodgrass, C. 2019, MNRAS, 484, 1347
Jehin, E., Gillon, M., Queloz, D., et al. 2011, The Messenger, 145, 2
Jewitt, D., & Meech, K. J. 1986, ApJ, 310, 937
King, D. L. 1985, RGO/La Palma technical note 31. http: //www.ing.iac.es/astronomy/observing/conditions/#ext Meech, K. J., Jewitt, D., & Ricker, G. R. 1986, Icarus, 66,
561
Meech, K. J., & Svoren, J. 2004, Using cometary activity to trace the physical and chemical evolution of cometary nuclei (Univ. of Arizona Press), 317
Meech, K. J., Pittichov´a, J., Yang, B., et al. 2011, Icarus, 213, 323
Meech, K. J., Yang, B., Kleyna, J., et al. 2016, Science Advances, 2, e1600038
Meech, K. J., Weryk, R., Micheli, M., et al. 2017, Nature, 552, 378
Micheli, M., Farnocchia, D., Meech, K. J., et al. 2018, Nature, 559, 223
Mumma, M. J., & Charnley, S. B. 2011, ARA&A, 49, 471 Opitom, C., Jehin, E., Manfroid, J., et al. 2015, A&A, 584,
A121
Opitom, C., Snodgrass, C., Fitzsimmons, A., et al. 2017, MNRAS, 469, S222
Opitom, C., Guilbert-Lepoutre, A., Jehin, E., et al. 2016, A&A, 589, A8
Osip, D. J., A’Hearn, M., & Raugh, A. 2003, NASA Planetary Data System,
EAR-C-PHOT-5-RDR-LOWELL-COMET-DB-PR-V1.0 ’Oumuamua ISSI Team, Bannister, M. T., Bhand are, A.,
et al. 2019, Nature Astronomy, 3, 594
P¨atzold, M., Andert, T., Hahn, M., et al. 2016, Nature, 530, 63
Raymond, S. N., Izidoro, A., & Morbidelli, A. 2018, arXiv e-prints, arXiv:1812.01033
Rotundi, A., Sierks, H., Della Corte, V., et al. 2015, Science, 347, aaa3905
Schleicher, D. G. 2008, AJ, 136, 2204 —. 2010, AJ, 140, 973
Thomas, N. 2009, Planet. Space Sci., 57, 1106
Trilling, D. E., Mommert, M., Hora, J. L., et al. 2018, AJ, 156, 261
Ye, Q.-Z., Zhang, Q., Kelley, M. S. P., & Brown, P. G. 2017, ApJL, 851, L5