THE PSYCHOLOGY BEHIND ROAD PRICING:
IDENTIFICATION OF SOCIO-COGNITIVE
FACTORS INDUCING CHANGES IN
ACTIVITY-TRAVEL BEHAVIOUR
Mario COOLS, Transportation Research Institute (IMOB), Hasselt University, mario.cools@uhasselt.be
Kris BRIJS, Transportation Research Institute (IMOB), Hasselt University, kris.brijs@uhasselt.be
Elke MOONS, Transportation Research Institute (IMOB), Hasselt University, elke.moons@uhasselt.be
Davy JANSSENS, Transportation Research Institute (IMOB), Hasselt University, davy.janssens@uhasselt.be
Geert WETS, Transportation Research Institute (IMOB), Hasselt University, geert.wets@uhasselt.be
ABSTRACT
The overall final objective of this study is to investigate the effect of road pricing on people’s tendency to adapt their current travel behaviour. In order to reach this goal, a two-stage hierarchical model is estimated, concentrated around the concept of public acceptability. The research was conducted in Flanders, the Dutch-speaking region of Belgium, by means of an interactive stated adaptation survey, administered on the internet, involving 300 respondents. It is found that behavioural changes themselves are not dependent on the perceived acceptability of road pricing. In addition, earlier findings concerning the acceptability of push measures are validated, and the relevance of using latent factors rather than aggregate indicators is illustrated.
Keywords: road pricing, socio-cognitive factors, acceptability, activity-travel behaviour, stated adaptation experiment
1. INTRODUCTION
The previous century is characterized by an extraordinary growth in car use that has continued in the current century (Haustein and Hunecke, 2007). Passenger car use in the European Union grew by 18% between 1995 and 2004 and was responsible for 74% of all
passenger transport in 2004 (EEA, 2008). As a result, in today’s society, various car-related problems are manifested, including serious environmental, economic and societal repercussions (Schuitema et al., 2010; Steg, 2003a). It is estimated that urban transport in the European Union accounts for 80% of congestion costs, 15% of all greenhouse gas emissions and annually 20,000 road fatalities (May et al., 2008). Rising concerns over these increasingly intolerable externalities have generated particular interest in how transport-planning policies might moderate the pressures resulting from growth in personal mobility and support the principles of sustainable development (Janssens et al., 2009a).
Although no standard definition of sustainable transport is available (Beatley, 1995), most delineations imply that sustainable transport balances environmental, social and economic qualities (Steg and Gifford, 2005). Generally speaking, sustainable transport could be seen as the outcome of different policy measures that aim at lowering the ecological footprint of activity-travel patterns in an economically feasible manner (Wittneben et al., 2009). These policy measures are commonly referred to as Travel Demand Management (TDM) measures.
1.1 Travel Demand Measures
As indicated by Eriksson et al. (2006, p. 15), Travel Demand Management measures can be defined as ‘strategies aiming to change travel behaviour’. Such measures can be of various kinds (for good overviews, see e.g. Cools et al., 2009; Gärling & Schuitema, 2007; Hickman et al., 2010). Steg (2003b) categorizes different TDM-measures at the strategic level (i.e., in terms of practical implementation). Accordingly, measures applying to physical changes are distinguished from legal-, economic-, and informative or educative measures. Another more fundamental approach however is to classify TDM-measures at a deeper lying psychological level (i.e., in function of how it is assumed a behavioural change can be induced). As an example, Vlek (1996) distinguishes between structural or hard measures (i.e., aimed at changing the individual’s context) on the one hand and psychological or soft measures (i.e., aimed at increasing awareness and knowledge) on the other. A more widely adopted systematization distinguishes so-called coercive measures from non- (or less) coercive measures (Steg & Vlek, 1997). Traditionally, the latter are referred to as pull measures while the former are better known as push measures (Loukopoulos, 2005). When it comes for instance to the reduction of car use, pull measures are meant to improve and encourage alternative travel options while push measures should discourage car use by making it less beneficial and thereby lowering its attractiveness as a transport mode.
1.2 Road Pricing
Non-coercive TDM-measures alone are unlikely to be effective in achieving a more sustainable transport system. Therefore coercive TDM-measures such as increasing costs for or prohibiting car use may be necessary (Gärling and Schuitema, 2007). An important coercive policy instrument (push measure) for governments in modifying activity-travel behaviour is the introduction of road pricing. The term road pricing, also referred to as
congestion charging and congestion pricing, can be defined as any form of charging of the use of roads during periods of peak demand (Janssens et al, 2009a).
A key issue in making road pricing systems operational is building support for the policy measure. Several best-practices are often discussed in literature. First, road pricing must be embedded in a broader plan involving public transportation, climate change and land use goals. This helps the general public to see the connections between road pricing and larger sustainability goals (Schaller, 2010). Moreover, the joint implementation of congestion pricing and improved transit could lever the effectiveness of congestion pricing. Nonetheless, to ensure the leverage effect, transit improvement should come at the same time or prior to implementation of congestion pricing, and transit improvements should not be limited to the revenue generated by the road pricing system (Munich Jr., 2010).
Second, effective stakeholder management is important. An extensive program for outreach and public education could help the public, interested groups, and elected officials understand the benefits of congestion pricing. Moreover, effective consultation and participation throughout the policy process is a key success factor. Participation should commence with joint agreement over objectives that are both clear and measureable (Eliasson, 2008; May and Crass, 2007).
Third, the political champion plays a fundamental role. The support of a person or group of persons who are ready to undertake the necessary change and face the problems that these changes might create is crucial (Attard and Ison, 2010; Smirti et al., 2007).
Fourth, the design of schemes should avoid unnecessary complexity: the schemes should be simple and fully understood (Gaunt et al., 2007). Nonetheless, there should be a degree of time variation of the tolls as time-variation of tolls enhances the efficiency gains, which can amount to a substantial fraction of the toll revenues collected (de Palma et al., 2004).
Finally, the technical system should work from the start and be customer-friendly, and various modes of accessible payment should be provided (Eliasson, 2008).
An interesting trend within the literature is that, over the last few years, socio-cognitive factors received more attention when it comes to evaluating the effectiveness of TDM-measures such as road pricing (Abrahamse et al., 2009; Eriksson et al., 2006, 2008; Schmöker et al., 2010). While cognitive factors typically stand for the individual’s rational considerations with regard to the target object under study (in this case, road pricing), social factors stand for influences emanating from the broader social environment (friends, family, etc.) to which these personal considerations are potentially subject (Ajzen and Fishbein, 1980; Meyers, 2008).
When it comes more specifically to the implementation and effectiveness of push measures, a general finding is that these typically face more resistance on behalf of the road user population and that this resistance to a considerable extent is related to the way in which road users subjectively perceive such push measures (Rienstra et al., 1999; Steg and Vlek, 1997). More in detail, the lack of acceptance is seen as a crucial factor explaining why people are more inclined to oppose to such push measures (Rentziou et al., 2010; Schade, 2003; Schade and Schlag, 2003; Schlag and Schade, 2000; Steg et al., 2005, 2006). As a consequence, public acceptability has become a concept of major importance within the field of TDM.
1.3 Public Acceptability
Together with Schade (2003), Eriksson et al. (2006, p. 16) define public acceptability as ‘the degree of positive or negative evaluation of a TDM-measure that may be implemented in the future.’ In line with its basic definition, public acceptability is traditionally operationalized as a single-dimensional concept, captured by means of one (or more) item(s) probing for some kind of overall evaluative assessment such as the degree to which individuals consider a certain TDM-measure is likeable, acceptable, admissible, agreeable or favourable.
In general, studies on public acceptability of TDM-measures concentrate around one main issue which is how to model the concept’s origination. According to Eriksson et al. (2006, 2008), two basic approaches can be distinguished within the extant literature.
A first approach is to treat a measure’s public acceptability exclusively in function of measure-specific aspects with the two most important ones being perceived effectiveness and fairness. A measure’s perceived effectiveness stands for the extent to which a person believes it will reach the purpose for which it has been developed (in case of road pricing, the final objective is to reduce car use and thereby diminish human pressure on the ecological environment). Perceived fairness is more a matter of moral legitimacy, i.e., the degree to which a policy measure is seen as ethically just. On the one hand, fairness is seen as a function of the degree to which a measure infringes on personal freedom with the underlying reasoning being that, the more a measure threatens individual freedom, the less fair it is perceived to be (Bamberg and Rölle, 2003). On the other hand, a measure’s fairness is considered as dependent upon its perceived effectiveness as well. That is, given a measure is not believed to reach its goal, its implementation is perceived as unfair (Nordlund and Garvill, 2006).
In terms of how both perceived effectiveness and fairness structurally relate to a measure’s overall acceptability, it is assumed the effect of effectiveness can be direct as well as indirect, i.e., mediated through fairness.
An alternative approach is to treat a measure’s public acceptability as a two-stage hierarchical model, that is, with the inclusion of deeper-lying environmental-related beliefs, norms and values. As indicated by Eriksson et al. (2006, 2008), the primary reason for doing so is drawn from the work of Schwartz (1977) on Norm Activation Theory where he explains pro-social behaviour in function of altruistic norms and motives. With pro-environmental actions (such as recycling or reducing car use) seen as typical examples of pro-social behaviour, the idea of explaining pro-environmental behaviour in function of more deeply ingrained environment-related beliefs, norms and values is perfectly arguable. One of the most popular theoretical frameworks to this respect is the Value-Belief-Norm (VBN) Theory of Environmentalism (Stern, 2000; Stern et al., 1999). One of its basic hypotheses is that general environmental beliefs and values determine both the extent to which the individual is cognizant of the environmental problem (i.e., problem awareness) and whether s/he feels a personal obligation to contribute to the solution and thus behave in a (more) pro-environmental manner (i.e., personal norm). Personal norm and problem awareness in turn, are believed to affect the individual’s willingness to act pro-environmentally.
As already indicated, some studies have modelled public acceptability as a two-stage hierarchical model with measure-specific aspects (i.e., effectiveness and fairness) as first-stage constructs and variables appearing within the VBN framework (i.e., general
environmental beliefs and values, problem awareness, personal norm and willingness to act pro-environmentally) as second-stage constructs (Eriksson et al., 2006, 2008). This paper will focus on two-stage modelling for public acceptability as well but takes into account the concerns and issues that will be outlined throughout the following section.
1.4 Two-Stage Models: Current Issues
Three interesting findings came out of a review of current research on public acceptability of TDM-measures.
Firstly, although lack of public acceptability is widely acknowledged as the single greatest barrier to the implementation of road pricing (see e.g. Gaunt et al., 2007), to the best of our knowledge, no studies focusing on the psychological underpinnings of road pricing, have investigated whether or how public acceptability itself, as well as its most important determinants, relate to people’s actual changes in travel behaviour. Put differently, prior research investigating the socio-cognitive underpinnings of road pricing has systematically taken public acceptability instead of behaviour as the final outcome variable. This is somewhat surprising since, strictly taken, the key-question when it comes to examining the effectiveness of TDM-measures is not so much to understand what makes such measures more or less acceptable, but whether and (even more importantly) how acceptability relates to the induction of a behavioural change. Indeed, as for the ‘whether’ question, although it seems an agreed upon idea that acceptability is an important condition for TDM-measures to make people adapt their behaviour, without this assumption being empirically verified, it remains a speculative assertion. As for the ‘how’ question, we do not know for instance whether it is overall acceptability itself or (one of) its underlying determinants that leads to the desired behavioural change.
A second interesting finding with regard to the literature on two-stage models for public acceptability is that the more precise structural relationships within these two-stage models have been redefined somewhat over time. Originally for instance, Eriksson et al. (2006) found willingness to act pro-environmentally to be the only second-stage construct that influenced measure-specific beliefs (i.e., first-stage constructs such as effectiveness and fairness). In a study published two years later, Eriksson et al. (2008), established how perceived effectiveness was not only determined by willingness to act pro-environmentally, but by problem awareness as well. Besides that, the structural relationships between public acceptability on the one hand and personal norm and problem awareness (i.e., two second-stage constructs) on the other have been found to vary in function of whether the policy measure under study is a push or a pull measure. For example, Eriksson et al. (2008) established that public acceptability for push measures besides being dependent upon perceived fairness and effectiveness was determined also by personal norm while in case of pull measures, instead of personal norm, problem awareness was found to be an important second-stage co-determinant of public acceptability. Thus, for push measures to be acceptable, people should at least feel personally obligated to act pro-environmentally. Contrary to that, for pull measures, acceptability is dependent upon the extent to which people are aware of the negative effects car use can have on the environment. As such, it appears that even though the basic structure of two-stage models for public acceptability remains intact, (i.e., measure-specific aspects as first-order constructs and VBN-variables as
second-order constructs), the more precise relationships within these models vary in function of the kind of TDM-measure (i.e., push or pull) to which such models apply.
A third finding is more related to the way in which two-stage models for public acceptability of TDM-measures have been statistically analyzed. Given the fact that (1) two-stage models are structural by definition with multiple equations to be estimated simultaneously and, (2) variables appearing in such two-stage models are typical latent (i.e., not directly observable) constructs, Structural Equation Modelling (SEM) is the preferred approach in terms of model estimation. Interestingly, a closer look at how latent constructs are treated in the literature reveals that, in strict sense, these are not operationalized as full worthy latent constructs. Instead, a typical practice is to have the unobservable construct itself being replaced by the aggregation of values obtained for that construct’s observable indicators (see e.g. Eriksson et al. (2006, 2008)). Nonetheless, this practice is to be avoided. First, from theoretical point of view, SEM should be used as a confirmatory approach. As most of the socio-cognitive factors have their operationalization rooted in the theories on the explanation and prediction of behaviour, the reflective structure of the latent constructs should be kept. Second, dropping an indicator from the aggregate construct might alter the meaning of the construct and measurement errors are capitalised in this one construct. Third, as the different indicators are likely to be correlated and the direction of the causality is from the construct to the indicators, only a reflective model structure will yield valid results. For a more elaborate methodological discussion concerning the need for a reflective model structure in this type of analysis, the reader is referred to Bollen (1984) and Jarvis et al. (2003).
1.5 Objectives and Proposed Model
The overall final objective of this study is to investigate the effect of road pricing (i.e., a coercive TDM-measure) on people’s tendency to adapt their current travel behaviour. In order to reach this goal, we will make use of a two-stage hierarchical model (see Figure 1) concentrated around the concept of public acceptability. By means of this model, three specific research targets will be set.
Firstly, we will explore the relationship between adapted travel behaviour itself on the one hand and public acceptability as well as its most important first- (i.e., effectiveness and fairness) and second-order determinants (i.e., general environmental beliefs and values, problem awareness, personal norm, and willingness to act pro-environmentally) on the other. Secondly, we verify whether earlier findings concerning the acceptability of push measures replicate for road pricing. In line with previous research (Eriksson et al;, 2006, 2008), we expect for instance that public acceptability in case of road pricing, besides being determined by perceived effectiveness and fairness, is rather a function of personal norm than problem awareness. In addition, we expect road pricing to be perceived as a rather unfair policy measure.
Thirdly, while estimating the model, latent constructs measured by means of multiple items will not be replaced by the aggregate of their indicators.
PE PA PN WTA EFF FAIR ACC ADAPT PE1 PE2 PE3 PE4 e1 e2 e3 e4 PN1 PN2
PA1 PA2 PA3
e5 e6 e7 e8 e9 FAIR 1 FAIR 2 EFF1 EFF2 e10 e11 e12 e13 AW AS AL AV
e14 e15 e16 e17
e18 e19 e20 e21 e22 e23 e24 PE: Pro-environmental orientation
PA: Problem awareness PN: Personal norm WTA: Willingness to act EFF: Effectiveness FAIR: Fairness ACC: Acceptability
ADAPT: Change in travel behaviour AW: Change in work trips AS: Change in shopping trips AL: Change in leisure trips AV: Change in visit trips e: residual
Figure 1: Conceptual model
2. METHOD
2.1. Stated Adaptation Experiment
The research represented in this paper was conducted in Flanders, the Dutch-speaking region of Belgium, by means of an interactive stated adaptation survey, administered on the internet, involving 300 respondents. Although it could be argued that sample bias is introduced when solely conducting an internet-based data collection, internet-based surveys allow for automatic randomisation of the ordering of the questions and can be completed at the respondent’s discretion. Furthermore, it is simpler to prompt additional questions within the situational context entered in the questionnaire (Janssens et al., 2009a). On the basis of these arguments, it was decided to choose for an internet-based survey rather than a traditional paper-and-pencil survey as the advantages outweighed the disadvantages.
Given that private car use is derived from needs, desires and obligations to participate in out-of-home activities, it is argued that changes in activity-travel behaviour in response to road pricing are not one-dimensional and need to be conceptualised in function of the engagement of out-of-home activities (Loukopoulos et al., 2006). Therefore in this paper,
changes in activity-travel behaviour in response to road pricing for the four most frequent out-of-home activities (commuting (work/school), shopping, leisure and visits), most frequent according to the Flemish travel behaviour survey 2007-2008 (Janssens et al., 2009b), are surveyed.
2.2 Behavioural Adaptations
For each activity a congestion pricing scenario was formulated of the following general form: Assume that the fixed vehicle taxation is replaced by a variable road price
which is to be paid for each kilometre travelled by car. The charge will be 7 eurocents on roads at uncongested periods, and 27 eurocents at congested periods.
After the introduction of the congestion price measure, the respondents could indicate multiple long-term and short-term adaptations. For each trip for a particular activity, the following long-term changes were considered: (i) a change of residential location of the household (e.g. moving to a location closer to the workplace), (ii) a change of work location of the individual (closer to the residential location), and (iii) no change. Concerning short-term changes the following alternatives were defined: (i) eliminating the trip by conducting the activity at home, (ii) eliminating the trip by skipping the activity, (iii) reduce the distance of the trip by conducting the activity more close to home, (iv) change the transport mode of the trip, (v) change the departure time of the trip, (vi) change the route of the trip, and (vii) no change. For each activity, these behavioural alterations have been recoded on six point scales (1 representing the smallest impact on the activity-travel behaviour, 6 the largest impact): 6 representing structural changes, 5 corresponding to changes in activity situation, 4 indicating a model shift towards environment-friendly transport modes, 3 representing time-of-day changes, 2 indicating route changes, and 1 corresponding to the no change alternative.
2.3 Socio-Cognitive Factors
Next to indicating changes in travel behaviour, the respondents were asked to answer questions concerning general environmental and policy-specific beliefs. Beliefs are defined as the subjective probability that an object has a certain outcome. The outcome of an object can be judged to be favourable, neutral or unfavourable, referring to the valance of a belief (Schuitema et al., 2010). It was decided to adopt the questionnaire implemented by Eriksson et al. (2008) to assess whether earlier findings concerning the acceptability of road pricing are transferrable across notations.
2.3.1 General Environmental Beliefs
First, the respondents’ pro-environmental orientation [PE] was assessed by four items (see Table 1) included in the NEP scale (Dunlap et al., 2000). The respondents had to indicate to what extent they agreed to the statements on a five point scale (1 = strongly disagree, 2 = mildly disagree, 3 = unsure, 4 = mildly agree, 5 = strongly agree). The internal consistency of the latent construct pro-environment orientation was reassured by a Cronbach’s alpha of
0.67. Note that Moss et al. (1998) suggest that an alpha score of 0.60 is generally acceptable. Next, problem awareness [PA] and personal norm [PN] were assessed by respectively three and two statements. Similar to the pro-environmental orientation, respondents had to evaluate the statements on a five point scale. Alpha scores of 0.91 for the indicators of problem awareness, and 0.79 for the indicators of personal norm, underlined the high internal reliability of the latent constructs. Finally, willingness to act [WTA] was directly measured with one item, again measured on the same five point scale.
2.3.2 Policy Specific Beliefs
With respect to socio-cognitive factors, road pricing was evaluated to the extent road pricing was perceived to be effective, fair and acceptable. First, perceived effectiveness [EFF] was evaluated by two questions rated on a five point scale (1 = not all effective, 3 = neither effective nor ineffective, 5 = very effective). Second, respondents evaluated perceived fairness [FAIR] for both themselves and others using also a five point scale (1 = very unfair, 3 = neither fair nor unfair, 5 = very fair). The internal reliability of both latent constructs was reassured by alpha values of respectively 0.87 and 0.89. Finally, perceived acceptability [ACC] was directly measured with one item, again measured on a five point scale (1 = completely against, 3 = neither in favour nor against, 5 = completely in favour).
Table 1: Statements for the indicators of the socio-cognitive factors Indicator1 Statements
General environmental beliefs
PE1 When humans interfere with nature it often produces disastrous consequences. PE2 Humans are severely abusing the environment.
PE3
If things continue on their present course, we will soon experience a major ecological catastrophe.
PE4 The balance of nature is very delicate and easily upset.
PA1
Air pollution from private car use is a threat to humans and the environment in the whole world.
PA2 Air pollution from private car use is a threat to humans and the environment in Belgium.
PA3
Air pollution from private car use is a threat to the health and well-being of me and my family.
PN1 I feel morally responsible to reduce the negative environmental effects of my car use.
PN2
I get a guilty conscience if I don't try to reduce the negative environmental effects of my car use.
WTA I am willing to reduce the negative environmental effects of my car use. Policy specific beliefs
EFF1 To what extent do you perceive road pricing to be effective?
EFF2 To what extent do you perceive road pricing will lead to an improved environment? FAIR1 To what extent do you perceive road pricing to be fair for you?
FAIR2 To what extent do you perceive road pricing to be fair for others?
ACC To what extent are you in favour or against the implementation of this policy measure?
3. RESULTS
3.1 Descriptive Analysis
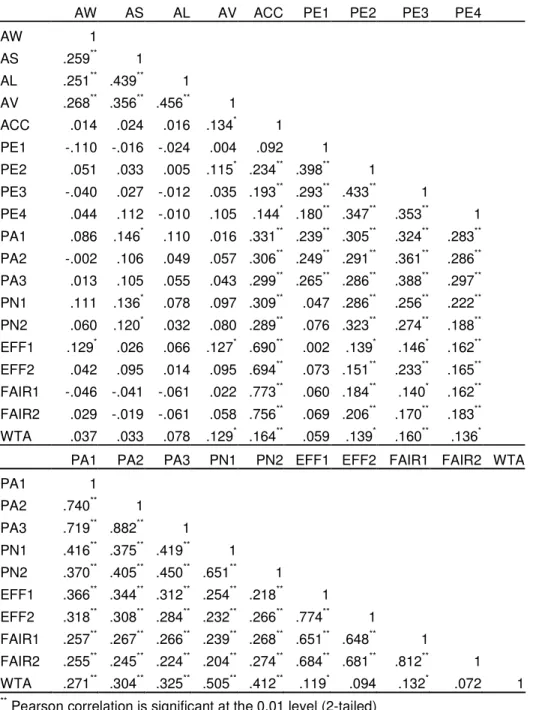
Before providing an in-depth interpretation of the results of the proposed conceptual model, first the relationships between adapted travel behaviour itself on the one hand and public acceptability as well as its most important first- and second-order determinants on the other, are investigated by means of Pearson correlations between the observable variables.
Table 2: Correlation matrix of observed variables included in the model
AW AS AL AV ACC PE1 PE2 PE3 PE4
AW 1 AS .259** 1 AL .251** .439** 1 AV .268** .356** .456** 1 ACC .014 .024 .016 .134* 1 PE1 -.110 -.016 -.024 .004 .092 1 PE2 .051 .033 .005 .115* .234** .398** 1 PE3 -.040 .027 -.012 .035 .193** .293** .433** 1 PE4 .044 .112 -.010 .105 .144* .180** .347** .353** 1 PA1 .086 .146* .110 .016 .331** .239** .305** .324** .283** PA2 -.002 .106 .049 .057 .306** .249** .291** .361** .286** PA3 .013 .105 .055 .043 .299** .265** .286** .388** .297** PN1 .111 .136* .078 .097 .309** .047 .286** .256** .222** PN2 .060 .120* .032 .080 .289** .076 .323** .274** .188** EFF1 .129* .026 .066 .127* .690** .002 .139* .146* .162** EFF2 .042 .095 .014 .095 .694** .073 .151** .233** .165** FAIR1 -.046 -.041 -.061 .022 .773** .060 .184** .140* .162** FAIR2 .029 -.019 -.061 .058 .756** .069 .206** .170** .183** WTA .037 .033 .078 .129* .164** .059 .139* .160** .136* PA1 PA2 PA3 PN1 PN2 EFF1 EFF2 FAIR1 FAIR2 WTA
PA1 1 PA2 .740** 1 PA3 .719** .882** 1 PN1 .416** .375** .419** 1 PN2 .370** .405** .450** .651** 1 EFF1 .366** .344** .312** .254** .218** 1 EFF2 .318** .308** .284** .232** .266** .774** 1 FAIR1 .257** .267** .266** .239** .268** .651** .648** 1 FAIR2 .255** .245** .224** .204** .274** .684** .681** .812** 1 WTA .271** .304** .325** .505** .412** .119* .094 .132* .072 1
** Pearson correlation is significant at the 0.01 level (2-tailed) * Pearson correlation is significant at the 0.05 level (2-tailed)
From Table 2 one could notice that the direct relationship between acceptability [ACC] and changes in travel behaviour are not significant, except for visit trips [AV]. Moreover, most of the indicators of the first- and second-order determinants of acceptability neither have a significant relationship with the changes in travel behaviour. In contrast, all these indicators, with exception of the first indicator of pro-environmental orientation, do have a statistically significant correlation with perceived acceptability.
Next to the relationships between the various indicators on the one hand and acceptability on the other, most of these indicators are highly correlated among themselves.
3.2 Model evaluation
The estimated model predicting both acceptability of road pricing and behavioural adaptations in response to road pricing, is displayed in Figure 2. Recall that both general environmental and policy specific beliefs were included in the model. The whole sample (N = 300) was used in the analysis. Note that the proposed model was tested using AMOS 4.0 (Arbuckle and Wothke, 1999).
PE PA PN WTA EFF FAIR ACC ADAPT PE1 PE2 PE3 PE4 e1 e2 e3 e4 PN1 PN2
PA1 PA2 PA3
e5 e6 e7 e8 e9 FAIR 1 FAIR 2 EFF1 EFF2 e10 e11 e12 e13 AW AS AL AV
e14 e15 e16 e17
e18 e19 e20 e21 e22 e23 e24 PE: Pro-environmental orientation
PA: Problem awareness PN: Personal norm WTA: Willingness to act EFF: Effectiveness FAIR: Fairness ACC: Acceptability
ADAPT: Change in travel behaviour AW: Change in work trips AS: Change in shopping trips AL: Change in leisure trips AV: Change in visit trips e: residual
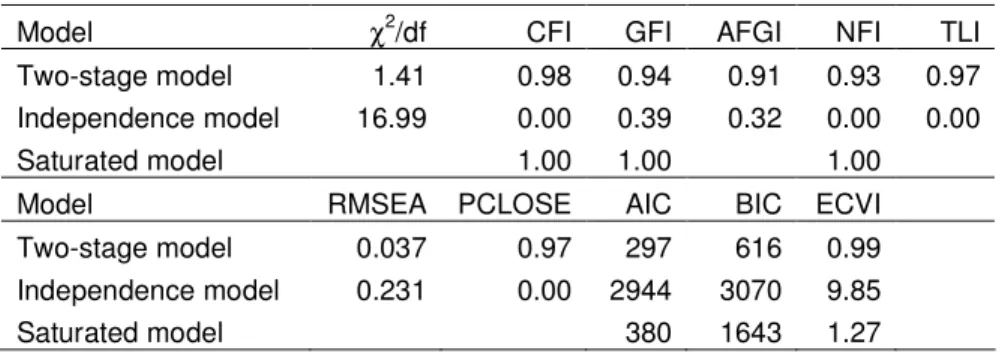
To assess the appropriateness of the proposed model, different goodness-of-fit measures were tabulated, for the proposed model, as well as for the independence model and the saturated model. The first criterion that is displayed in Table 3 is the chi-square value divided by the degrees of freedom of the model. Values lower than 2 are generally considered to represent a minimally plausible model (Byrne, 1991). Second, the comparative fit index (CFI) is displayed, which should be greater than 0.95 to represent a good fit (Hu and Bentler, 1999). Next, the goodness-of-fit index (GFI), adjusted GFI (AFGI), normed fit index (NFI) and Tucker-Lewis index are computed. A good fit is indicated by values greater than 0.90 (Hu and Bentler, 1999; Sanders et al, 2005). In addition, the root mean square error of approximation (RMSEA) and PCLOSE are presented. RMSEA values lower than 0.05 indicate a good fit (Browne and Cudeck, 1993). PCLOSE tests the null hypothesis that RMSEA is not greater than 0.05. If PCLOSE is greater than 0.05, the null hypothesis is not rejected, indicating a good fit. Finally, the Akaike information criterion (AIC), Bayesian information criterion (BIC) and expected cross-validation index (ECVI) are displayed. The model with the lowest value is considered to be the best model according to these criteria. All the tabulated goodness-of-fit and model evaluation criteria are indicating a good model fit, providing evidence that the proposed model can explain well the relationships between adapted travel behaviour on the one hand and public acceptability and its most important determinants on the other hand.
Table 3: Goodness-of-fit-statistics
Model χ2/df CFI GFI AFGI NFI TLI
Two-stage model 1.41 0.98 0.94 0.91 0.93 0.97 Independence model 16.99 0.00 0.39 0.32 0.00 0.00
Saturated model 1.00 1.00 1.00
Model RMSEA PCLOSE AIC BIC ECVI
Two-stage model 0.037 0.97 297 616 0.99 Independence model 0.231 0.00 2944 3070 9.85
Saturated model 380 1643 1.27
3.3 Socio-cognitive factors inducing changes in activity-travel behaviour
3.3.1 Factors inducing changes in activity-travel behaviour
Investigation of the causal relationships between adapted travel behaviour on the one hand and public acceptability and its most important determinants on the other (Table 4), reveals that the behavioural changes themselves are not dependent on the perceived acceptability of road pricing. Moreover, only a relative small amount of the variability in the behavioural changes (10.7%) is explained by the socio-cognitive factors. Nonetheless, personal norm and in particular, perceived effectiveness, have an inducing effect on changes in activity-travel behaviour. The negative effect caused by perceived fairness can be accounted for by the fact that at least some degree of unfairness must exist in order to change a person’s mind set in such way that he/she alters his/her activity-travel behaviour. Indeed, a measure not perceived as unfair probably would leave people without a reason to modify their current
behaviour. In this respect it is important to stress that the focus of this paper are indeed the changes in activity-travel behaviour.
An assessment of the total standardized effects (i.e. the sum of direct and indirect effects) displayed in Table 5, yields the insight that next to personal norm, perceived effectiveness, and perceived fairness, also pro-environmental orientation and problem awareness have an impact on behavioural changes, albeit it a small impact.
3.3.2 Factors influencing the acceptability of road pricing
When the focus is turned to the perceived acceptability of road pricing, earlier findings concerning the acceptability of push measures could be validated. Evaluation of the regression weights (Table 4) illustrates that acceptability of road pricing is directly influenced by effectiveness, fairness and personal norm: all three socio-cognitive factors have an increasing effect on acceptability. This is in line with the model predicting the acceptability of raised tax on fossil fuel (which could be seen as an operationalization of road pricing) presented by Eriksson et al. (2008). The transferability of the results across nations is even further supported by the mutual relationships between the most important first- (i.e. effectiveness and fairness) and second-order determinants (i.e. pro-environmental orientation, problem awareness and personal norm).
Table 4: Regression weights, standard errors and standardized regression weights Path Est. S.E. S. Est Path Est. S.E. S. Est EFF → ACC 0.324 0.107 0.246 ADAPT → AW 1.000 0.402 EFF → ADAPT 0.404 0.156 0.477 EFF → EFF1 1.093 0.057 0.885 EFF → FAIR 0.959 0.062 0.838 EFF → EFF2 1.000 0.875 FAIR → ACC 0.711 0.093 0.618 FAIR → FAIR1 1.000 0.901 FAIR → ADAPT -0.349 0.134 -0.470 FAIR → FAIR2 0.917 0.041 0.903 PA → EFF 0.432 0.067 0.390 PA → PA1 0.899 0.048 0.784 PA → PN 0.440 0.080 0.425 PA → PA2 1.001 0.037 0.941 PE → PA 1.044 0.181 0.552 PA → PA3 1.000 0.934 PE → PN 0.436 0.177 0.223 PE → PE1 1.000 0.473 PN → ACC 0.141 0.052 0.100 PE → PE2 1.389 0.217 0.680 PN → ADAPT 0.153 0.073 0.168 PE → PE3 1.391 0.218 0.662 PN → WTA 0.525 0.056 0.577 PE → PE4 1.042 0.183 0.514 ADAPT → AL 1.624 0.298 0.706 PN → PN1 1.000 0.846 ADAPT → AS 1.459 0.274 0.611 PN → PN2 0.969 0.082 0.768 ADAPT → AV 1.283 0.240 0.625
Note: Est. = Estimate, S.E. = Standard Error, S. Est = Standardized Estimate Explained variance: ADAPT 10.7%, ACCEPT 74.1%, FAIR 70.2%, EFF 15.2%, WTA 33.3%, PN 33.5%, PA 30.5%
Despite the large amount of similarities, the relationships concerning the willingness to act differ between the two studies. Whereas willingness to act was significantly influenced by both problem awareness and personal norm, and had on its own a positive effect on
effectiveness and fairness in the study reported by Eriksson et al. (2008), in the study reported in this paper willingness to act was only directly influenced by personal norm, and had on its own no significant impact on effectiveness and fairness. This could be an indication that the concept of willingness to act might be better grasped by a latent factor using multiple indicators.
Table 5: Total standardized effects for road pricing
PE PA EFF FAIR PN
ADAPT 0.095 0.104 0.083 -0.470 0.168
ACC 0.211 0.341 0.764 0.618 0.100
3.3.3 The relevance of using latent factors rather than aggregate indicators
As indicated in the introduction, an important difference between the present study and the study reported by Eriksson et al. (2008) is that the latent constructs measured by means of multiple items in this study are not replaced by the aggregate of their indicators. The appropriateness of using latent constructs is supported by the proportion of the variance that is explained by the model presented in this paper, when compared to the percentage of the variance that is explained by the TAX-model presented by Eriksson et al. (2008). When focussing on the final outcome variable of their model (i.e. perceived acceptability) in the present study, 74% of the variance is explained, while the TAX-model reported by Eriksson et al. (2008) accounts for 58%. Also for all underlying determinants a larger portion of the variance is explained by the model that uses the latent constructs. The largest difference in variance explained could be noticed for perceived fairness: 70% of the variance was explained by the latent construct model, while only 22% of the variance was accounted for by the model using aggregate indicators. Especially for this socio-cognitive factor the reflective structure of the constructed contributed significantly.
4. DISCUSSION
In this paper, changes in activity-travel behaviour in response to road pricing are treated as a complex psychological phenomenon. The most important finding is that acceptability of road pricing as a single dimensional overall evaluative construct itself does not directly entice changes in activity-travel behaviour. As Goodwin and Lyons (2010) reported, there are strong arguments that socio-cognitive factors and actual choices may be ill-matched. The lack of a direct impact of acceptability on behavioural changes supports this hypothesis of mismatching. From policy point of view however, it was argued that at least some degree of unfairness must exist in order to change a person’s mind set in such way that he/she alters his/her activity-travel behaviour. This however, does not mean that acceptability can be neglected. The main focus should be clear communication of the benefits of road pricing, and these benefits should be visible for the road users (Cools et al., 2009; Schuitema et al., 2010).
In the attempt of achieving a more sustainable transport, road pricing alone will not counterbalance the growth in car use. As discussed by Jakobsson et al (2002), even
substantial economic disincentives are unlikely to lead to any large reduction in private car use. Therefore, it is important to implement a wider range of policy packages at a higher intensity in application (Hickman et al., 2010). Combined improvements to public transport services and fares, road pricing and integration of land use and transport planning can be instrumental in achieving a more sustainable transport (May et al., 2008). A single policy response is unlikely to encourage changed behaviour in all users. The travel market is thus probably best simplified and understood by segmentation into coherent groups that share similar characteristics (Hickman et al., 2010). The key challenge will be to induce the most car-dependent travellers to shift towards more sustainable activity-travel behaviour. Even focusing on small changes in behaviour might yield significantly larger benefits on the long term, as people who are already inclined to show ecological activity-travel behaviour are more likely to express similar behaviour. Once a first step toward an increased environmental awareness is achieved, more significant changes can be obtained more easily (Janssens et al., 2009a).
5. CONCLUSIONS
In the present study the relationship between changes in activity-travel behaviour on the one hand and public acceptability and its most important determinants on the other was investigated by means of a stated adaption experiment. It was found that behavioural changes themselves are not dependent on the perceived acceptability of road pricing itself, and that only a small amount of the variability in the behavioural changes were explained by socio-cognitive factors. The lesson for policy makers is that policy measures should at least have some degree of unfairness to entice changes. Secondly, earlier findings concerning the acceptability of push measures were validated, supporting transferability of results. In line with other studies, effectiveness, fairness and personal norm all had a significant direct impact on perceived acceptability. Finally, the relevance of using latent factors rather than aggregate indicators was underlined.
6. REFERENCES
Abrahamse, W., L. Steg, R. Gifford and C.A.J. Vlek (2009). Factors influencing car use for commuting and the intention to reduce it: A question of self-interest or morality? Transp. Res. F-Traf., 12, 317–324.
Ajzen, I. and M. Fishbein (1980). Understanding attitudes and predicting social behavior. Prentice-Hall, Englewood Cliffs, NJ.
Arbuckle, J.L. and W. Wothke (1999). Amos User’s Guide Version 4.0. SPSS, Incorporated, Chicago, IL.
Attard, M. and S.G. Ison (2010). The implementation of road user charging and the lessons learnt: the case of Valletta, Malta. J. Transp. Geogr., 18, 14-22.
Bamberg, S. and D. Rölle (2003). Determinants of people’s acceptability of pricing measures – Replication and extension of a causal model. In: Acceptability of transport pricing strategies (J. Schade and B. Schlag, eds.), pp. 235-248. Elsevier, Oxford.
Bollen, K.A. (1984). Multiple Indicators: Internal Consistency or No Necessary Relationship? Qual. Quant., 18, 377-385.
Browne, M.W. and R. Cudeck (1993). Alternative ways of assessing model fit. In: Testing Structural Equation Models (K.A. Bollen and J.S. Long, eds.), pp. 136-162. Sage, New Park, CA.
Byrne, B.M. (1991). The Maslach Burnout Inventory: validating factorial structure and invariance across intermediates, secondary, and university educators. Multivar. Behav. Res., 26, 583-605
Cools, M., E. Moons, B. Janssens and G. Wets (2009). Shifting towards environment-friendly modes: Profiling travelers using Q-methodology. Transportation, 36, 437-453. de Palma, A., R. Lindsey and E. Quinet (2004). Time-varying road pricing and choice of toll
locations. Res. Transp. E., 9, 107-131.
Dunlap, R.E., K.D. Van Liere, A.G. Mertig and R.E. Jones (2000). Measuring endorsement of the new ecological paradigm: a revised NEP scale. J. Soc. Issues, 56, 425-442. Eliasson, J. (2008). Lessons from the Stockholm congestion charging trial. Transp. Policy,
15, 395-404.
Eriksson, L., J. Garvill and A.M. Nordlund (2006). Acceptability of travel demand management measures: The importance of problem awareness, personal norm, freedom, and fairness. J. Environ. Psychol., 26, 15-26.
Eriksson, L., J. Garvill and A.M. Nordlund (2008). Acceptability of single and combined transport policy measures: The importance of environmental and policy specific beliefs. Transp. Res. A.-Pol., 42, 1117-1128.
European Environmental Agency (EEA). (2008). Climate for a transport change – TERM 2007: Indicators tracking transport and environment in the European Union. European Environmental Agency, Denmark.
Gärling, T. and G. Schuitema (2007). Travel demand management targeting reduced private car use: effectiveness, public acceptability, and political feasibility. J. Soc. Issues, 63, 139-153.
Gaunt M., T. Rye and S. Allen (2007). Public Acceptability of Road User Charging: The Case of Edinburgh and the 2005 Referendum. Transp. Rev., 27, 85-102.
Goodwin, P. and G. Lyons (2010). Public attitudes to transport: interpreting the evidence, Transp. Plan. Tech., 33, 3-17.
Haustein, S. and M. Hunecke (2007). Reduced Use of Environmentally Friendly Modes of Transportation Caused by Perceived Mobility Necessities: An Extension of the Theory of Planned Behavior. J. Appl. Soc. Psychol., 37, 1856-1883.
Hickman, R., O. Ashiru and D. Banister (2010). Transport and climate change: Simulating the options for carbon reduction in London. Transp. Policy, 17, 110-125.
Hu, L-T. and P.M. Bentler (1999). Cutoff criteria for fit indexes in covariance structure analysis: conventional criteria versus new alternatives. Struct. Equ. Modeling, 6, 1-55. Jakobsson, C., S. Fujii and T. Gärling (2002). Effects of economic disincentives on private
car use. Transportation, 29, 349-370.
Janssens, D., M. Cools, E. Moons, G. Wets, T.A. Arentze and H.J.P. Timmermans (2009a). Road Pricing as an Impetus for Environment-Friendly Travel Behavior: Results from a Stated Adaptation Experiment. Transp. Res. Rec., 2115, 50-59.
Janssens, D., E. Moons, E. Nuyts, G. Wets (2009b). Onderzoek Verplaatsingsgedrag Vlaanderen 3 (2007-2008): Verkeerskundige interpretatie van de belangrijkste tabellen. Diepenbeek: Transportation Research Institute (IMOB), Hasselt University, Diepenbeek.
Jarvis, C.B., S.B. Mackenzie, P.M. Podsakoff (2003). A Critical Review of Construct Indicators and Measurement Model Misspecification in Marketing and Consumer Research. J. Consum. Res., 30, 199-218.
Loukopoulos, P. (2005). Future urban sustainable mobility: implementing and understanding the impacts of policies designed to reduce private automobile usage. Department of Psychology, Göteborg University, Göteborg.
Loukopoulos, P., C. Jakobsson, T. Gärling, S. Meland and S. Fujii (2006). Understanding the process of adaptation to car-use reduction goals. Transp. Res. F-Traf., 9, 115-127. May, A.D., M. Page and A. Hull (2008). Developing a set of decision-support tools for
sustainable urban transport. Transp. Policy, 15, 328-340.
May, T. and M. Crass (2007). Sustainability in Transport: Implications for Policy Makers. Transp. Res. Rec., 2017, 1-9.
Meyers, D.G. (2008). Social Psychology, Ninth Editon. McGraw Hill, NY.
Moss, S., H. Prosser, H. Costello, N. Simpson, P. Patel, S. Rowe, S. Turner and C. Hatton (1998). Reliability and validity of the PAS–ADD Checklist for detecting psychiatric disorders in adults with intellectual disability. J. Intell. Disabil. Res., 42, 173-183. Munich Jr., L.W. (2010). Enhancing Livability and Sustainability by Linking Congestion
Pricing with Transit. In: Proceedings of the 89th Annual Meeting of the Transportation Research Board. Transportation Research Board of the National Academies, Washington, DC.
Nordlund, A.M. and J. Garvill (2006). Structural solutions to the social dilemma of travel mode choice. Unpublished manuscript.
Rentziou, A., C. Milioti, K. Gkritza and M.G. Karlaftis (2010). Urban road pricing: Modeling public acceptability. In: Proceedings of the 89th Annual Meeting of the Transportation Research Board. Transportation Research Board of the National Academies, Washington, DC.
Rienstra, S.A., P. Rietveld and E.T. Verhoef (1999). The social support for policy measure in passenger transport. A statistical analysis for the Netherlands. Transp. Res. F-Traf., 4, 181-200.
Sanders, R.D., D.N. Allen, S.D. Formand, T. Tarpey, M.S. Keshavan and G. Goldstein (2005). Confirmatory factor analysis of the Neurological Evaluation Scale in unmedicated schizophrenia. Psychiat. Res., 133, 65-71.
Schade, J. (2003). European research results on transport pricing acceptability. In: Acceptability of transport pricing strategies (J. Schade and B. Schlag, eds.), pp. 109-123. Elsevier, Oxford.
Schade, J., & Schlag, B. (2003). Acceptability of urban transport pricing strategies. Transp. Res. F-Traf., 6, 45-61.
Schaller, B. (2010). New York City’s Congestion Pricing Experience and Implications for Road Pricing Acceptance in the United States. In: Proceedings of the 89th Annual Meeting of the Transportation Research Board. Transportation Research Board of the National Academies, Washington, DC.
Schlag, B. and J. Schade (2000). Acceptability or road pricing strategies. VATT, Helsinki. Schmöcker, J.-D., P. Pettersson and S. Fujii (2010). On the influence of psychological factors
and beliefs on the acceptance of coercive policies. In: Proceedings of the 89th Annual Meeting of the Transportation Research Board. Transportation Research Board of the National Academies, Washington, DC.
Schuitema, G., L. Steg and S. Forward (2010). Explaining differences in acceptability before and acceptance after the implementation of a congestion charge in Stockholm. Transp. Res. A.-Pol., 44, 99-109.
Schwartz, S.H. (1977). Normative influences on altruism. Adv. Exp. Soc. Psychol., 10, 221-279.
Smirti, M., A. Evans, M. Gougherty and E. Morris (2007). Politics, Public Opinion, and Project Design in California Road Pricing. Transp. Res. Rec., 1996, 41-48.
Steg, L. (2003a). Can public transport compete with the private car. IATSS Res., 27, 27-35. Steg, L. (2003b). Factors influencing the acceptability and effectiveness of transport pricing.
In: Acceptability of transport pricing strategies (J. Schade and B. Schlag, eds.), pp. 187-202. Elsevier, Oxford.
Steg, L., L. Dreijerink and W. Abrahamse (2005). Factors influencing the acceptability of energy policies: A test of VBN theory. J. Environ. Psychol., 25, 415-425.
Steg, L., L. Dreijerink and W. Abrahamse (2006). Why are energy policies acceptable and effective? Environ. Behav., 38, 92-111.
Steg, L. and R. Gifford (2005). Sustainable transportation and quality of life. J. Transp. Geogr., 13, 59-69.
Steg, L. and C.A.J. Vlek (1997). The role of problem awareness in willingness-to-change car use and in evaluating relevant policy measures. In: Traffic and Transport Psychology: Theory and Application (T. Rothengatter and E. Carbonell Vaya, eds.), pp. 465-475. Pergamon, Oxford.
Stern, P.C. (2000). Toward a coherent theory of environmentally significant behaviour. J. Soc. Issues, 56, 407-424.
Stern, P.C., T. Dietz, T. Abel, G.A. Guagnano and L. Kalof (1999). A value-belief-norm theory of support for social movements: The case of environmentalism. Hum. Ecol. Rev., 6, 61-97.
Vlek, C.A.J. (1996). Collective risk generation and risk management: The unexploited potential of the social dilemma paradigm. In: Frontiers in social dilemma research (W.B.G. Liebrand and D.M. Messick, eds.), pp. 11-38. Springer, Berlin.
Wittneben, B., D. Bongardt, H. Dalkmann, W. Sterk and C. Baatz (2009). Integrating Sustainable Transport Measures into the Clean Development Mechanism. Transp. Rev., 29, 91-113.