1998 91: 2139-2145
Mario Cazzola, Roberta Guarnone, Paola Cerani, Esther Centenara, Andrea Rovati and Yves Beguin
Erythropoietin Level
Red Blood Cell Precursor Mass as an Independent Determinant of Serum
http://bloodjournal.hematologylibrary.org/cgi/content/full/91/6/2139
Updated information and services can be found at:
(1178 articles)
Red Cells
collections:
Blood
Articles on similar topics may be found in the following
http://bloodjournal.hematologylibrary.org/misc/rights.dtl#repub_requests
Information about reproducing this article in parts or in its entirety may be found online at:
http://bloodjournal.hematologylibrary.org/misc/rights.dtl#reprints
Information about ordering reprints may be found online at:
http://bloodjournal.hematologylibrary.org/subscriptions/index.dtl
Information about subscriptions and ASH membership may be found online at:
.
Hematology; all rights reserved
Copyright 2007 by The American Society of
DC 20036.
by the American Society of Hematology, 1900 M St, NW, Suite 200, Washington
Blood (print ISSN 0006-4971, online ISSN 1528-0020), is published semimonthly
Red Blood Cell Precursor Mass as an Independent Determinant of Serum
Erythropoietin Level
By Mario Cazzola, Roberta Guarnone, Paola Cerani, Esther Centenara, Andrea Rovati, and Yves Beguin
Serum erythropoietin (sEpo) concentration is primarilyre-lated to the rate of renal production and, under the stimulus of hypoxia, increases exponentially as hemoglobin (Hb) decreases. Additional factors, however, appear to influence sEpo, and in this work, we performed studies to evaluate the role of the red blood cell precursor mass. We first compared the relationship of sEpo with Hb in patients with low versus high erythroid activity. The first group included 27 patients with erythroid aplasia or hypoplasia having serum transfer-rin receptor (sTfR) levels F 3 mg/L (erythroid activity F 0.6 times normal), while the second one included 28 patients withb-thalassemia intermedia having sTfR levels G 10 mg/L (erythroid activity G 2 times normal). There was no differ-ence between the two groups with respect to Hb (8.36 1.6v 8.06 1.3 g/dL,PG .05), but sEpo levels were notably higher in patients with low erythroid activity (1,6016 1,542v2356 143 mU/mL, P F .001). In fact, multivariate analysis of variance (ANOVA) showed that, at any given Hb level, sEpo was higher in patients with low erythroid activity (P F
.0001). Twenty patients undergoing allogeneic or autologous bone marrow transplantation (BMT) were then investigated. A marked increase in sEpo was seen in all cases at the time of marrow aplasia, disproportionately high when compared with the small decrease in Hb level. Sequential studies were also performed in five patients with iron deficiency anemia undergoing intravenous (IV) iron therapy. Within 24 to 72 hours after starting iron treatment, marked decreases in sEpo (up to one log magnitude) were found before any change in Hb level. Similar observations were made in patients with megaloblastic anemia and in a case of pure red blood cell aplasia. These findings point to an inverse relation-ship between red blood cell precursor mass and sEpo: at any given Hb level, the higher the number of red blood cell precursors, the lower the sEpo concentration. The most likely explanation for this is that sEpo levels are regulated not only by the rate of renal production, but also by the rate of utilization by erythroid cells.
r
1998 by The American Society of Hematology.I
N ADULT HUMANS, erythropoietin (Epo) is primarily
made by a single organ, the kidney, outside the bone
marrow (BM) and participates in a classic negative feedback
control system.
1,2Hypoxia is the fundamental physiologic
stimulus that causes a rapid increase in renal production of
erythropoietin through an exponential increase in the number of
erythropoietin-producing cells. It is generally accepted that
serum Epo (sEpo) concentration is directly related to the rate of
renal production. Serum erythropoietin levels are in the range of
5 to 30 mU/mL in normal individuals and increase
exponen-tially as hemoglobin (Hb) or hematocrit (Hct) decreases, unless
there is a blunted renal production.
3With the availability of commercial immunoassays for sEpo,
assessment of endogenous Epo production has become a routine
diagnostic procedure. Serum Epo is evaluated in relation to the
degree of anemia, and the definition of defective Epo
produc-tion relies on a low sEpo in comparison to reference patients
with similar Hct (or Hb).
3In the individual patient, the
adequacy of endogenous Epo production can be easily assessed
through the observed/predicted log (sEpo) ratio (O/P ratio).
4The O/P ratio is below 1 if the observed value is lower than the
predicted one; in reference subjects, the 95% confidence
interval ranged from 0.80 to 1.22.
4With the only exceptions of prematurity and renal failure,
determination of sEpo is mandatory in all anemic patients for
deciding treatment with recombinant human Epo (rHuEpo).
5In
fact, it is mainly in patients in whom endogenous Epo levels are
inappropriately low for the degree of anemia that administration
of rHuEpo can be effective in increasing red blood cell
production. In particular, several reports point to the use of a
sEpo threshold of
# 100 mU/mL for predicting response to
rHuEpo in patients with Hb levels
, 10 g/dL.
6,7Although tissue hypoxia is the fundamental physiologic
stimulus that increases renal secretion, a number of clinical
observations suggest that other factors might be involved in the
regulation of Epo production and/or may influence serum
concentration. Abnormally high Epo levels have been reported
in patients with aplastic anemia,
8,9and dramatic changes in
serum levels have been described after chemotherapy
10,11and
during vitamin B12 or iron replacement therapy.
12,13These
findings point to an inverse relationship between red blood cell
precursor mass and sEpo levels.
14In this study, we performed
studies to evaluate whether the red blood cell precursor mass is
an independent determinant of sEpo concentration.
MATERIALS AND METHODS
Patients. This study was designed to evaluate whether the red blood cell precursor mass can directly and independently influence sEpo levels. Therefore, we planned to study: (1) sEpo levels in patients with low versus high erythroid activity; (2) the time course of sEpo in patients undergoing myeloablative therapy for bone marrow transplan-tation (BMT); and (3) the time course of sEpo in anemic patients with iron deficiency or vitamin B12 deficiency undergoing specific replace-ment therapy.
Anemic patients with low versus high erythroid activity. To identify any effect of the erythroid marrow activity on sEpo concentration, we selected two groups of anemic patients: one with defective erythroid proliferation and decreased numbers of erythroid precursors
(hypopro-From the Department of Internal Medicine and Medical Therapy, Section of Internal Medicine and Medical Oncology, and the Depart-ment of Medicine, Division of Hematology, University of Lie`ge, Lie`ge, Belgium.
Submitted September 2, 1997; accepted October 28, 1997. Supported by grants from Istituto di Ricovero e Cura a Carattere Scientifico (IRCCS) Policlinico S. Matteo and Fondazione Ferrata Storti, Pavia, Italy.
Address reprint requests to Mario Cazzola, MD, Internal Medicine and Medical Oncology, Istituto di Ricovero e Cura a Carattere Scientifico (IRCCS) Policlinico S. Matteo, 27100 Pavia, Italy.
The publication costs of this article were defrayed in part by page charge payment. This article must therefore be hereby marked
‘‘adver-tisement’’ in accordance with 18 U.S.C. section 1734 solely to indicate
this fact.
r
1998 by The American Society of Hematology. 0006-4971/98/9106-0002$3.00/0liferative anemia), the second one with ineffective erythropoiesis and elevated numbers of marrow immature red blood cells (proliferative anemia). The degree of erythroid proliferation was evaluated through the serum transferrin receptor (sTfR) level (see below). Patients with severe aplastic anemia (n5 11), pure red blood cell aplasia (PRCA, n 5 7), or mild hypoplastic anemia (n5 9) having values for erythroid proliferation below the normal range (sTfR, 3 mg/L) were included in the hypoproliferative anemia group. Twenty-eight individuals with b-thalassemia intermedia having sTfR levels . 10 mg/Ll were included in the group of anemic patients with high erythroid activity.
Sequential studies in patients receiving myeloablative therapy or conventional chemotherapy. Twenty patients undergoing allogeneic (n5 14) or autologous (n 5 6) BMT were investigated immediately before undergoing myeloablative therapy and on day 0. Previous studies on evolution of erythropoiesis and Epo after BMT15showed that sEpo
had a peak value on day 0, while sTfR decreased sharply after conditioning to a minimum on day 14. Therefore, for the purpose of this study, we decided to assay sEpo and sTfR before transplant and on day 0. Similar studies were performed in five patients undergoing chemother-apy for non-Hodgkin’s lymphoma.
Sequential studies in patients with iron deficiency anemia treated with intravenous (IV) iron saccharate. The five patients with severe iron deficiency anemia had a mean Hb level of 6.46 1.4 g/dL (range, 4.2 to 7.4 g/dL) and a mean serum ferritin of 56 4 µg/L (range, 2 to 10 µg/L). They received IV iron therapy (iron oxide saccharate, Ferrum Hausman, Laboratorien Hausman, St. Gallen, Switzerland). The total amount of iron required was calculated according to the following formula16: total dose (mg)5 [Hb deficit (g/dL) 3 estimated blood
volume (dL)3 3.4] 1 500, where Hb deficit is the difference between 15 and the patient’s Hb level, blood volume is estimated according to sex and body surface,173.4 is the factor converting g Hb to mg iron, and
500 is an arbitrary quantity to allow for restoration of the iron reserve. The daily dose was 100 or 200 mg of iron saccharate: this amount was diluted in 250 mL of normal saline and infused IV over 1 hour.
Case reports. Additional studies were performed in two patients with megaloblastic anemia due to vitamin B12 deficiency or folic acid deficiency and in one patient with pure red blood cell aplasia after autologous BMT for treament of non-Hodgkin’s lymphoma.
In the treatment of megaloblastic anemia, vitamin B12 was adminis-tered intramuscular (IM) as cyanocobalamin, 500 µg per day; folic acid was administered IM at a dose of 15 mg per day.
The patient with PRCA was previously reported.18He was given high
doses of rHuEpo (150 U/kg per day subcutaneously [SC], 5 days a week) based on previous observations on the use of Epo in the treatment of PRCA after stem cell transplantation (reviewed in our previous report18). During treatment, sEpo was measured on Monday morning,
ie, approximately 72 hours after the last SC rHuEpo administration. In normal individuals receiving SC rHuEpo, sEpo increases from basal levels of 10 to 20 mU/mL to peak values of 30 to 40 mU/mL after about 12 hours and then decreases with a half-life of about 24 hours (see review by Cazzola et al5).
Hematologic profile. Blood counts were determined with a Coulter Counter Model S (Coulter, Hialeah, FL). Reticulocyte counts were performed with an automated reticulocyte analyzer Sysmex R-3000 (Toa Medical Electronics GmbH, Hamburg, Germany). This system performs reticulocyte analysis using flow cytometry, with an argon laser as the light source. Whole blood specimens stained with a fluorescent dye pass through a sheath flow cell, where fluorescently-labeled cells are irradiated with a laser beam and thus produce forward scatter and fluorescence. The scatter and fluorescence are detected as indicator of the relative cell size and the RNA content, respectively. Reticulocyte count is expressed both as an absolute number per µL and as a percentage of red blood cells. Dividing the reticulocyte area of the scattergram into three sections according to the fluorescent intensity, reticulocytes can then be fractionated into maturity stages: HFR (high fluorescence ratio, immature reticulocytes), MFR (middle fluorescence
ratio, intermediate reticulocytes), and LFR (low fluorescence ratio, mature reticulocytes).
Serum erythropoietin assay. Circulating Epo levels were measured by a commercially available radioimmunoassay (Incstar Corp, Sillwa-ter, MN) that uses rHuEpo for tracer and standards.4To define Epo
levels as appropriate or inappropriate for a given degree of anemia, an exponential regression of sEpo versus Hct was determined in reference subjects (102 normal individuals or patients with iron deficiency anemia, hemolytic anemia, or hypoplastic anemia), and the 95% confidence limits were defined. For Hct values#40%, the regression equation was: log(epo)5 3.42 2 (0.056 3 Hct). For Hct values .40%, the regression equation was: log(epo)5 1.31 2 (0.003 3 Hct). Based on these equations, the observed/predicted log(epo) ratio (O/P ratio) was derived for each sample. The mean O/P ratio in reference subjects was 1.016 0.11 (95% confidence interval, 0.80 to 1.22).
Measurement of sTfR. The amount of circulating transferrin recep-tor was estimated by an enzyme-linked polyclonal antibody assay, using purified placental receptor-transferrin complexes as a reference stan-dard and rabbit antibodies as described in detail elsewhere.4The mean
sTfR level in 165 normal control subjects was 5.06 1.1 mg/L, with a normal range from 3 to 7 mg/L.
Data analysis and presentation. Data were stored, analyzed, and reported with the packages STATISTICA/Mac (StatSoft, Tulsa, OK), Exstatix (Select Micro Systems Inc, Yorktown Heights, NY), and DeltaGraph Pro 3 (DeltaPoint Inc, Monterey, CA), all run on a Macintosh Quadra 800 (Apple Computer Inc, Cupertino, CA) personal computer. Results were expressed as mean6 1 standard deviation (SD) unless otherwise stated. The Student’s t test and/or the F test (one-way analysis of variance [ANOVA]) were used to evaluate the probability of significant differences between groups. Multivariate ANOVA was used to show any significant difference in the regression of serum sEpo to Hb level in different groups. P values less than .05 were considered statistically significant.
As discussed below, the number of erythroid cells in the BM may directly influence the Epo clearance: the higher the erythroid activity, the lower sEpo level. To account for this effect of erythroid activity on sEpo levels, the following correction was made:
Corrected sEPo (mU/mL)5 measured sEPo (mU/mL) 3ln sTfr(mg/L) ln 5 (mg/L) where 5 mg/L is the mean normal value for sTfR, taken as a measure of erythroid activity. For several reasons, including the impossibility of distinguishing between erythroid and nonerythroid TfR at the lowest sTfR levels, an additional empirical correction was introduced: the minimum value for ln sTfR was set to 0.2. Any time the calculated value was, 0.2, it was changed to 0.2.
RESULTS
Serum Epo in anemic patients with low versus high erythroid
activity.
As reported in Table 1, there was no significant
difference with respect to Hb level (Student’s t test
5 0.97, P $
.05) between the 27 patients with low erythroid activity
Table 1. Hb Level, sTfR, and sEpo in Anemic Patients With Low Erythroid Activity (Hypoproliferative Anemia) Versus Anemic Patients With High Erythroid Activity (b-Thalassemia Intermedia)
Condition Hb Level (g/dL) sTfR (mg/L) sEpo (mU/mL) Hypoproliferative anemia (n5 27) 8.36 1.5 (5.5-10.4) 1.86 0.8 (0.4-2.9) 1,6016 1,541 (172-6,030) b-thalassemia inter-media (n5 28) 8.06 1.3 (5.9-10.6) 23.56 11.4 (10.4-48.6) 2356 143 (70-619) Normal range 12-16 (females) 3.0-7.0 5-30
13.5-17.5 (males)
(hypoproliferative anemia, sTfR
, 3 mg/L) and the 28
individu-als with
b-thalassemia intermedia and high erythroid activity
(sTfR
. 10 mg). By contrast, sEpo levels were about one log
higher in patients with hypoproliferative anemia (Student’s t
test
5 4.67, P , .001).
Figure 1A displays the relationship of sEpo to Hb observed in
the two groups of patients. A significant inverse relationship
between Hb and sEpo was found in both patient populations
(P
, .001 in both groups). However, multivariate ANOVA
showed that at any given Hb level, sEpo was higher in patients
with low versus high erythroid activity (the multivariate tests
Rao’s R and Pillai-Bartlett Trace V were both significant at P
,
.0001).
Assuming that the erythroid cells in the BM directly
influ-ence the Epo clearance rate, we made an empirical correction to
remove the effect of variation in erythroid activity on sEpo
levels using the formula reported in Materials and Methods.
As shown in Fig 1B, when we reanalyzed the data of Fig 1A
using the corrected sEpo instead of the measured sEpo levels, a
substantial part of the variation previously observed was
abolished. In fact, whereas only 15.8% of the variation in sEpo
was explained by variations in Hb level (Fig 1A), these latter
variations in Hb level explained 37.5% of the variation in
corrected sEpo. In particular, there was no difference (P
. .05)
between corrected sEpo levels calculated in patients with
thalassemia intermedia having high erythroid activity and those
calculated in patients with low erythroid activity.
Sequential studies in patients receiving myeloablative therapy
or conventional chemotherapy.
Twenty patients undergoing
allogeneic or autologous BMT were investigated immediately
before undergoing myeloablative therapy and on day 0 (Table 2
and Fig 2). Conditioning regimen markedly reduced erythroid
activity as shown by the sharp decrease in sTfR (t
5 10.40, P ,
.001). Day 0 values for the circulating receptor were
compa-rable with those of patients with aplastica anemia or PRCA
(Table 1).
There was also a mild, although significant decrease in Hb
level (t
5 2.93, P , .05). However, the marked increment in
sEpo (t
5 6.66, P , .001) appeared to be disproportionately
high when compared with the mild decrease in Hb level (Fig 2).
We therefore calculated for each patient the day-0 sEpo
concentration expected (or predicted) on the basis of the actual
Hb level. As displayed in Fig 2, the predicted day-0 sEpo was
significantly lower than the observed one (81
6 45 mU/mL v
254
6 141 mU/mL, t 5 6.86, P , .001), indicating that
factor(s) other than Hb level contributed to the elevation in
circulating Epo level.
Similar findings were observed in five patients with
non-Hodgkin’s lymphoma undergoing conventional chemotherapy
(Fig 3). A marked increase in serum Epo was seen in all cases
after 8 days, before any significant decrease in Hb was
observed; this was associated with a parallel decrease in sTfR.
Fig 1. Relationship of sEpo to Hb observed in 27 patients with hypoproliferative anemia having erythroid activity F0.6 times normal (X) versus 28 patients with b-thalassemia intermedia having ery-throid activity G2 times normal (W). (A) Relationship of measured sEpo to Hb level. Multivariate ANOVA showed that, at any given Hb level, sEpo was higher in patients with low versus those with high erythroid activity (P F .0001). (B) Relationship of corrected sEpo to Hb level. Data are those of (A), but corrected sEpo levels have been used instead of the measured ones. Multivariate ANOVA showed no significant difference between the relationship in patients with low erythroid activity and that in subjects with high erythroid activity (P G .05).
Table 2. Hb, sTfR, and sEpo in 20 Patients Undergoing Allogeneic (n5 14) or Autologous (n 5 6) BMT Time Hb (g/dL) sTfR (mg/L) sEpo (mU/mL) Pretransplant 9.16 1.2 6.06 1.6 666 37 Day 0 8.66 1.2 2.16 0.5 2546 141
Fig 2. Time course of Hb level, sEpo, and circulating transferrin receptor in 20 patients undergoing BMT. Data are mean values6 1
SD. Observed values before myeloablative therapy and those on day 0 are shown. Predicted sEpo values were calculated on the basis of the patient’s Hct using the equation derived from regression analysis as previously described.4
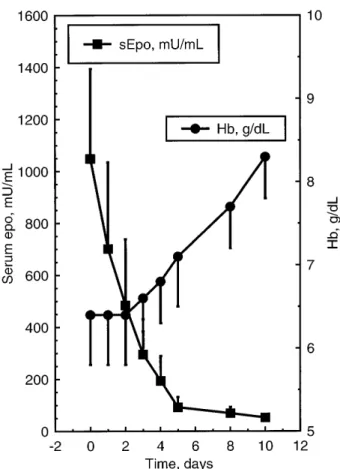
Sequential studies in patients with iron deficiency anemia
treated with IV iron saccharate.
Five patients with severe iron
deficiency anemia (mean Hb, 6.4
6 1.4 g/dL) were studied
immediately before and during IV iron therapy. Data of these
sequential studies are despicted in Fig 4. Within 24 to 72 hours
after starting iron treatment, marked decreases in sEpo were
observed (up to one log magnitude) before any change in Hb
level.
Because both the expression of transferrin receptors on
erythroid cells and the soluble receptor level are influenced by
the body iron status, the measurement of sTfR could not be used
in these patients to evaluate the erythroid activity. However, in
one patient, we were able to monitor the reticulocyte response
to IV iron. Figure 5 shows that the reticulocyte count and, in
particular, the percentage of immature reticulocytes (HFR),
increased sharply after starting IV iron, and this was paralleled
by a mirror decrease in sEpo.
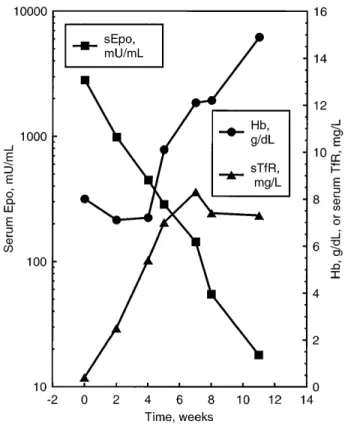
Case reports: megaloblastic anemia and PRCA.
Two
pa-tients with megaloblastic anemia were studied (Figs 6 and 7). In
both cases, replacement therapy with vitamin B12 or folate
induced a sharp decrease in sEpo in the first few days before any
change in Hb level. Such decreases were paralleled by increases
in sTfR, and in one case (Fig 7), also of immature reticulocytes
(HFR), indicating that ineffective erythropoiesis was replaced
by effective erythropoiesis with a subsequent expansion of the
red blood cell precursor mass.
Of particular interest was the patient with PRCA after
peripheral stem cell transplantation (Fig 8). His sTfR was 0.4
mg/L, indicating the complete absence of any erythroid activity:
this amount of TfR, in fact, is contributed by nonerythroid
tissues. As previously reported,
18this patient responded to
rHuEpo therapy despite the elevated sEpo (2820 mU/mL). For 4
weeks, there was no increase in Hb level: however, sTfR started
to increase after 2 weeks, and there was a parallel decrease in
sEpo despite exogenous Epo administration, suggesting
in-creased use by an expanding erythroid precursor mass.
DISCUSSION
Renal Epo production is typically regulated by a
transcrip-tional feedback mechanism where hypoxia plays a crucial
role.
19,20However, a number of additional
pathophysiopatho-logic factors, including inflammatory cytokines
21and plasma
viscosity,
22may independently affect the renal response to
hypoxia. Epo catabolism is largely unknown and it is not clear
whether sEpo levels are determined only by the production rate
or rather reflect a balance between this and consumption by
erythroid cell use.
The observation that serum Epo levels in aplastic anemia are
higher than those in iron deficiency anemia
8,9suggests that use
Fig 3. Time course of Hb level, sEpo, and circulating transferrin receptor in five patients with non-Hodgkin’s lymphoma undergoing conventional chemotherapy (CHOP regimen). Data are mean values6 1 SEM. One way ANOVA showed that Hb level did not
change significantly during the observation period (P G .05), whereas both the decrease in circulating transferrin receptor (sTfR, F5 6.02,
P F .01) and the mirror increase in sEpo (F5 14.54, P F .001) were
found to be significant changes.
Fig 4. Time course of Hb level and sEpo in five patients with iron deficiency anemia treated with IV iron saccharate from day 0. Data are mean values6 SEM. Within 48 hours, sEpo fell from 1,049 6 772
mU/mL to 4856 567 mU/mL (P F .01), whereas Hb level did not
change significantly (6.46 1.4 v 6.4 6 1.2, P G .057).
by erythroid precursors may be an important factor in
determin-ing serum concentrations. Unexpectedly low sEpo levels have
been previously found in patients with refractory anemia,
23sickle cell anemia,
24thalassemia,
25and megaloblastic anemia
26indicating that erythroid hyperplasia may involve a faster
clearance of Epo.
In the initial part of this study, we have clearly shown that the
sEpo level in aplastic anemia (erythroid activity
, 0.6 times
normal) is much higher than the level in thalassemia intermedia
(erythroid activity
. 2 times normal) at the same hemoglobin
concentration (Fig 1A). This may either suggest that the
clearance of Epo is much faster in thalassemia than in marrow
failure, or alternatively that the renal production is to some
extent higher in the latter condition.
To establish any relationship between erythropoiesis and
sEpo, several investigators studied patients receiving
myelosup-pressive treatments. Overall, patients treated with
chemother-apy were found to have a temporary, but prominent, increase in
sEpo titers without a concomitant change in Hb
concentra-tion.
10,11,27-30However, different interpretations were provided
for the observed marked sEpo increase before the decrease in
Hb after treatment with cytostatic drugs. Possible explanations
included: (1) cytotoxic therapy causes direct injury to
Epo-producing cells in the kidney in a manner that mimics hypoxia;
(2) BM inhibition triggers an unknown stimulus for Epo
production; (3) a decreased mass of erythroid precursors
disrupts the usual Epo degradation pathway, reduced Epo use
resulting in prolonged sEpo lifespan and concentration; (4)
cytotoxic drugs enhance Epo mRNA stability with a consequent
increase in protein synthesis.
Our studies after myelosuppressive therapy (Figs 2 and 3)
definitely show an inverse relationship between erythroid
activity (as indicated by sTfR) and sEpo. Such relationship is
further reinforced by observations in patients with iron
defi-ciency, megaloblastic anemia, and PRCA (Figs 4 through 8).
Although it has been suggested that iron deprivation increases
Epo production,
31cobalamin deficieny does not raise Epo level
per se, but only to the extent that it produces anemia.
32It is not
clear why the erythroid marrow of our patient with PRCA did
not respond to endogenous Epo and responded to exogenous
rHuEpo (Fig 8). We cannot rule out that the erythroid response
was spontaneous and unrelated to rHuEpo, but at least three
other similar cases have been reported.
18Endogenous Epo
production might have been defective in this patient despite the
elevated sEpo levels if one assumes that these levels essentially
reflected a very low utilization rate by the few erythroid cells
existing in the BM.
Overall, our findings point to an inverse relationship between
red blood cell precursor mass and sEpo level: the higher the
number of red blood cell precursors, the lower the sEpo level.
There are four possible explanations for this relationship: (1)
sEpo levels are independently regulated by the rate of hormone
Fig 5. Time course of sEpo, reticulocyte count, and HFR in a patient with iron deficiency anemia treated with IV iron saccharate from day 0. HFR, ie, the most immature reticulocytes, expressed as % of total reticulocytes.
Fig 6. Time course of Hb level, sEpo, and sTfR in a patient with megaloblastic anemia due to vitamin B12 deficiency treated with vitamin B12 (IM as cyanocobalamin, 500 mg per day). A marked decrease in serum Epo was seen after the first injection and before any increase in Hb level. There was a parallel increase in serum transferrin receptor, indicating a rapid expansion of the erythroid marrow during the first days of treatment.
use by erythroid cells through Epo receptors; (2) erythroid
marrow hypoplasia triggers a stimulus for Epo synthesis; (3)
erythroid marrow expansion inhibits renal production; and (4)
Epo excretion by the kidneys is directly influenced by erythroid
activity.
Two reports argue against the model of regulation by the
utilization rate, Piroso et al
33studied Epo lifespan in rats with
hypoplastic and hyperplastic BMs. They found no significant
difference and concluded that it is unlikely that erythroid
activity determines sEpo lifespan and catabolism. Using a
mouse model, Lezo´n et al
34have found an inverse relationship
between the rate of stimulated Epo production and
erythropoi-etic marrow activity. They concluded that decreases in sEpo
levels during periods of rapidly increasing erythropoiesis are
the reflection of a decrease in the rate of production rather than
an increase in the rate of utilization by expanding erythroid
cells.
Although the above direct studies failed to show evidence for
increased utilization when the erythroid precursor mass is
expanded, a large body of evidence points to a role by the
utilization rate in the regulation of circulating levels of
hemato-poietic growth factors. In particular, thrombopoietin levels
appear to be primarily regulated through absorption and
metabo-lism by both megakaryocytes and platelets.
35Our findings
indicate that the rate of utilization by erythroid cells acts as an
independent determinant of sEpo, this latter being a balance
between the rate of renal production and the rate of erythroid
consumption. This interpretation may be too simplistic, as other
factors linking erythron to renal production likely exist. Indeed,
we have previously reported elevated sEpo levels in
compen-sated hereditary spherocytosis, a condition defined by decreased
red blood cell lifespan without anemia.
36Products of red blood
cell destruction may not only exert a distinct stimulatory effect
on BM,
37,38but also influence Epo production.
From a practical point of view, we have recently proposed
that treatment with rHuEpo should be started only after an
inadequate erythropoietin production has been documented, eg,
by showing sEpo levels
, 100 mU/mL in patients with Hb
values
, 10 g/dL.
5According to the present study, when using
sEpo for this purpose, it might be necessary to take into account
the patient’s erythroid activity. For example, patients with
erythroid hypoplasia may present sEpo values
. 100 mU/mL
due to the small erythroid cell mass and still be responsive to
rHuEpo treatment.
18We are not suggesting the adoption of the
empirical correction for sEpo reported in Fig 1B, but
consider-ation of this point in the clinical reasoning of the
patient-oriented approach to the use of rHuEpo.
5In this reasoning, it
Fig 7. Time course of Hb level and sEpo (upper panel) and of sTfR, reticulocyte count and HFR (lower panel) in a patient with megaloblas-tic anemia due to folate deficiency treated with folic acid (15 mg per day IM). A marked decrease in serum Epo was seen after the first injection and before any increase in Hb level. There was a parallel increase in HFR, sTfR, and reticulocyte count, indicating a rapid expansion of the erythroid marrow during the first days of treatment.
Fig 8. Time course of Hb level, sEpo, and sTfR in a patient with PRCA responding to treatment. The patient was given rHuEpo at an initial dose of 150 U/kg per day SC, 5 days a week; dosage was reduced to three weekly administrations when Hb level achieved 12 g/dL and treatment was discontinued after 8 weeks. Serum Epo started to decrease as erythroid marrow activity reappeared, before any change in Hb level.
should be taken into account that apparently normal sEpo levels
in patients with hypoproliferative anemia may reflect an
inad-equate production combined with reduced utilization rate and,
conversely, that inappropriately low levels in patients with
proliferative anemia can be simply due to an accelerated
hormone consumption.
REFERENCES
1. Lacombe C, Da Silva JL, Bruneval P, Fournier JG, Wendling F, Casadevall N, Camilleri JP, Bariety J, Varet B, Tambourin P: Peritubular cells are the site of erythropoietin synthesis in the murine hypoxic kidneys. J Clin Invest 81:620, 1988
2. Koury ST, Bondurant MC, Koury MJ: Localization of erythropoi-etin synthetizing cells in murine kidneys by in situ hybridization. Blood 71:524, 1988
3. Barosi G: Inadequate erythropoietin response to anemia. Defini-tion and clinical relevance. Ann Hematol 68:215,
4. Beguin Y, Clemons G, Pootrakul P, Fillet G: Quantitative assessment of erythropoiesis and functional classification of anemia based on measurements of serum transferrin receptor and erythropoi-etin. Blood 81:1067, 1993
5. Cazzola M, Mercuriali F, Brugnara C: Use of recombinant human erythropoietin outside the setting of uremia. Blood 89:4248, 1997
6. Cazzola M, Messinger D, Battistel V, Bron D, Cimino R, Enller-Ziegler L, Essers U, Greil R, Grossi A, Ja¨ger G, LeMevel A, Najman A, Silingardi V, Spriano M, van Hoof A, Ehmer B: Recombi-nant human erythropoietin in the anemia associated with multiple myeloma or non-Hodgkin’s lymphoma: Dose finding and identification of predictors of response. Blood 86:4446, 1995
7. Cazzola M, Ponchio L, Pedrotti C, Farina G, Cerani P, Lucotti C, Novella A, Rovati A, Bergamaschi G, Beguin Y: Prediction of response to recombinant human erythropoietin (rHuEpo) in anemia of malig-nancy. Haematologica 81:434, 1996
8. Gaines Das RE, Milne A, Rowley M, Gordon-Smith EC, Cotes PM: Serum immunoreactive erythropoietin in patients with idiopathic aplastic and Fanconi’s anaemia. Br J Haematol 82:601, 1992
9. Schrezenmeier H, Noe´ G, Raghavacar A, Rich IN, Heimpel H, Kubanek B: Serum erythropoietin and serum transferrin receptor levels in aplastic anaemia. Br J Haematol 88:286, 1994
10. Schapira L, Antin JH, Ransil BJ, Antman KH, Eder JP, Mc-Garigle CJ, Goldberg MA: Serum erythropoietin levels in patients receiving intensive chemotherapy and radiotherapy. Blood 76:2354, 1990
11. Birgegård G, Wide L, Simonsson B: Marked erythropoietin increase before fall in Hb after treatment with cytostatic drugs suggests mechanism other than anaemia for stimulation. Br J Haematol 72:462, 1989
12. Kendall RG, Cavill I, Norfolk DR: Serum erythropoietin levels during haematinic therapy. Br J Haematol 81:630, 1992 (letter)
13. Cazolla M, Beguin Y: New tools for clinical evaluation of erythropoiesis and iron status in man. Br J Haematol 80:278, 1992
14. Cazzola M, Guarnone R, Beguin Y: Red cell precursors mass as an independent determinant of serum erythropoietin level. Blood 88:348a, 1996 (suppl 1, abstr)
15. Beguin Y, Oris R, Fillet G: Dynamics of erythropoietic recovery following bone marrow transplantation: role of marrow proliferative capacity and erythropoietin production in autologous versus allogeneic transplants. Bone Marrow Transplant 11:285, 1993
16. Bothwell TH, Charlton RW, Cook JD, Finch CA: Iron Metabo-lism in Man. Oxford, Blackwell, 1979
17. Napier JAF: Blood Transfusion Therapy: A Problem-Oriented Approach. Chichester, Wiley, 1987
18. Martelli M, Ponchio L, Beguin Y, Meloni G, Mandelli F, Cazzola
M: Pure red cell aplasia following peripheral stem cell transplantation: Complete response to a short course of high-dose recombinant human erythropoietin. Haematologica 79:456, 1994
19. Krantz SB: Erythropoietin. Blood 77:419, 1991
20. Ratcliffe PJ, Ebert BL, Firth JD, Gleadle JM, Maxwell PH, Nagao M, O’Rourke JF, Pugh CW, Wood SM: Oxygen regulated gene expression: Erythropoietin as a model system. Kidney Int 51:514, 1997 21. Faquin WC, Schneider TJ, Goldberg MA: Effect of inflammatory cytokines on hypoxia-induced erythropoietin production. Blood 79: 1987, 1992
22. Singh A, Eckardt KU, Zimmermann A, Go¨tz KH, Hamann M, Ratcliffe PJ, Kurtz A, Reinhart WH: Increased plasma viscosity as a reason for inappropriate erythropoietin formation. J Clin Invest 91:251, 1993
23. Jacobs A, Janowska-Wieczorek A, Caro J, Bowden DT, Lewis T: Circulating erythropoietin in patients with myelodysplastic syndromes. Br J Haematol 73:36, 1989
24. Sherwood JB, Goldwasser E, Chilcote R, Carmichael LD, Nagel RL: Sickle cell anemia patients have low erythropoietin levels for their degree of anemia. Blood 67:46, 1986
25. Camaschella C, Gonella S, Calabrese R, Vischia F, Roetto A, Graziadei G, Mazza U, Cappellini MD: Serum erythropoietin and circulating transferrin receptor in thalassemia intermedia patients with heterogeneous genotypes. Haematologica 81:397, 1996
26. Remacha AF, Bellido M, Garcia-Die F, Marco N, Ubeda J, Gimferrer E: Serum erythropoietin and erythroid activity in vitamin B12 deficiency. Haematologica 82:67, 1997
27. Piroso E, Erslev AJ, Caro J: Inappropriate increase in erythropoi-etin titers during chemotherapy. Am J Hematol 32:248, 1989
28. Schapira L, Antin JH, Ransil BJ, Antman KH, Eder JP, Mc-Garigle CJ, Goldberg MA: Serum erythropoietin levels in patients receiving intensive chemotherapy and radiotherapy. Blood 76:2354, 1990
29. Grace RJ, Kendall RG, Chapman C, Hartley AE, Barnard DL, Norfolk DR: Changes in serum erythropoietin levels during allogeneic bone marrow transplantation. Eur J Haematol 47:81, 1991
30. Sawabe Y, Kikuno K, Iseki T, Lida S, Tabata Y, Yonemitsu H: Changes in serum erythropoietin and the reticulocyte count during chemotherapy for leukemias. Eur J Haematol 57:384, 1996
31. Kling PJ, Dragsten PR, Roberts RA, Dos Santos B, Brooks DJ, Hedlund BE, Taetle R: Iron deprivation increases erythropoietin production in vitro, in normal subjects and patients with malignancy. Br J Haematol 95:241, 1996
32. Carmel R, MacPhee RD: Erythropoietin levels in cobalamin deficiency: Comparison of anemic and non-anemic, subtly deficient patients. Eur J Haematol 48:159, 1992
33. Piroso E, Erslev AJ, Flaharty KK, Caro J: Erythropoietin life span in rats with hypoplastic and hyperplastic bone marrows. Am J Haematol 36:105, 1991
34. Lezo´n C, Alippi RM, Barcelo´ AC, Martinez MP, Conti MI, Bozzini CE: Depression of stimulated erythorpoietin production in mice with enhanced erythropoiesis. Haematologica 80:491, 1995
35. Nagata Y, Shozaki Y, Nagahisa H, Natasawa T, Abe T, Todokoro K: Serum thrombopoietin level is not regulated by transcription but by the total counts of both megakaryocytes and platelets during thrombocy-topenia and thrombocytosis. Thromb Haemost 77:808, 1997
36. Guarnone R, Centenara E, Zappa M, Zanella A, Barosi G: Erythropoietin production and erythropoiesis in compensated and anaemic states of hereditary spherocytosis. Br J Haematol 92:150, 1996 37. Erslev AJ: The effect of hemolysates on red cell production and erythropoietin release. J Lab Clin Med 78:1, 1971
38. Bergamaschi G, Recalde HR, Ponchio L, Rosti V, Cazzola M: Erythrophagocytosis increases the expression of erythroid potentiating activity (EPA) and mRNA in human monocyte-macrophages. Exp Haematol 21:70, 1993