OATAO is an open access repository that collects the work of Toulouse
researchers and makes it freely available over the web where possible
Any correspondence concerning this service should be sent
to the repository administrator:
[email protected]
This is an author’s version published in:
http://oatao.univ-toulouse.fr/21422
To cite this version:
Freulon, Alexandre
and Sertucha, Jon and Lacaze, Jacques
Solidification and Room Temperature Microstructure of a Fully Pearlitic
Compacted Graphite Cast Iron. (2018) Transactions of the Indian Institute
of Metals, 71 (11). 2651-2656. ISSN 0972-2815
https://doi.org/10.1007 /s 12666-018-1424-7
Solidification and Room Temperature Microstructure of a Fully
Pearlitic Compacted Graphite Cast Iron
Alexandre Freulon1 • Jon Sertucha2 • Jacques Lacaze1G
Abstract Compacted graphite cast irons are rapidly
developing for they have better mechanical properties than lamellar graphite cast irons and present less porosity than spheroidal graphite cast irons. For many applications, an as-cast fully pearlitic matrix would be desired which can hardly be achieved when graphite is compacted. Addition of manganese, copper and tin are thus made as these ele ments are known to be pearlite promoters. However, their amount should be limited so as to avoid detrimental effects amongst which are heterogeneities in the matrix properties which impede easy machining. In the present work, a compacted graphite cast iron containing 0.3 wt% Mn, 0.8 wt% Cu and 0.1 wt% Sn was cast in sand mould and in standard thermal analysis cup. The cup sample showed a nearly fully pearlitic matrix and was selected for further study. The characterization consisted of measuring and correlating the distributions of pearlite interlamellar spac ings and microhardness values. An attempt was made to look for the effect of solidification microsegregation on microhardness which did not reveal any trend.
Keywords Compacted graphite iron · Pearlite ·
Interlamellar spacing · Microhardness
� Jacques Lacaze
1 CIRIMAT, Université de Toulouse, 4 allée Monso, 31030 Toulouse, France
2 Investigaci6n y Desarrollo de Procesos Metalurgicos, IK4-Azterlan, Aliendalde Auzunea 6, 48200 Durango, Bizkaia, Spain
1 Introduction
As for steels, pearlite is known to increase the strength of cast irons, though at the expense of decreased ductility. Further, the strength and hardness of pearlite do increase when the pearlite interlamellar spacing Àp is decreased.
Thus, following Janowak and Gundlach [1], the pearlite specific properties to look for in cast irons may be simply stated as: "fine pearlite with uniform strength and hard ness". Such an aim calls for: (1) increasing pearlite fine ness, i.e. decreasing Àp, which improves strength and (2)
achieving a uniform interlamellar spacing of pearlite as it is thought that this will ensure uniform matrix hardness.
The first difficulty appears to be the measurement of interlamellar spacing itself. The various ways proposed to measure Àp have been reviewed by Vander Voort and
Roosz [2] and by Ridley [3]. These reviews emphasize the fact that Àp may be not constant in a sample even in the
case of isothermal growth of pearlite, and this is also true under directional growth conditions [3]. Pearlite fineness should thus be characterized by the mean of the true interlamellar spacing which can be measured with some certainty only by transmission electron microscope imag ing (TEM). In all practicality, it bas been suggested to characterize pearlite fineness by the minimum interlamellar spacing observed on metallographic sections or TEM images. However, the ratio of the mean true interlamellar spacing to the minimum spacing value bas been reported to vary from 1.1 to 2.5 depending, e.g. on material and on transformation temperature [2, 3].
In the present work, it was postulated that pearlite fineness could possibly vary because of microsegregation issued from the solidification step. lt was thus important to characterize the distribution of Àp values, even though our study was limited to 2D observations. Furthermore, a study
of the relation between microhardness and Àp values was undertaken. A first set of measurements were taken to get the overall distributions, and then attention was focused on the relation with microsegregation. The results were finally discussed in comparison with the few data available in the literature.
2 Experimental Details
Melt was prepared using a medium frequency induction fumace (250 Hz, 100 kW) 100 kg in capacity. Metallic charge was composed of 50% steel scrap and 50% nodular iron retums. After the melting process was completed, the chemical composition of the alloy was checked and then adjusted according to the carbon, silicon, manganese, copper and tin contents as previously planned. The melt temperature was then increased to 1507 °C, and its surface was skimmed before being transferred to a 50 kg capacity ladle for treating the batch with 220 g (0.45 wt% of the batch weight) of a FeSiMg alloy (grain size 2-10 mm, 45.7 wt% Si, 5.5 wt% Mg, 2.42 wt% Ca, 0.39 wt% Al and 2.24 wt% rare earths) by the tundish-cover method. The FeSiMg alloy was positioned at the bottom of the ladle and then covered with 0.5 kg of steel scrap (grain size 15-30 mm). Once the reaction was finished, the surface of the Mg-treated melt was properly cleaned, and a sample was taken to determine the chemical composition of the prepared batch. A combustion technique (LECO CS300) was used for deterrnining carbon and sulphur contents, while spectrometry (ARL 3460) was utilized for other elements. The chemical composition including all signifi cant elements is shown in Table 1 which does not include the contribution of post-inoculation.
The melt was cast in standard Yl, Y2 and Y3 keel blocks (EN-1563) which were manufactured with chemi cally bonded sand. Each mould contained one open cavity in which 3.5, 7.0 and 14.0 g (0.10 wt% of the total weight of the ductile iron alloy poured in the corresponding mould) of a commercial inoculant (grain size 0.2-0.5 mm, Si
=
69.9, Al=
0.93, Ca=
1.38, Bi=
0.49, RE=
0.37 and Fe balance, wt%) were, respectively, added before the pouring step. Just before pouring the keel blocks, a stan dard thermal analysis (TA) cup was filled up using metal from the pouring ladle. An amount of 0.3 g (0.10 wt%) ofTable 1 Composition of the alloy (wt %)
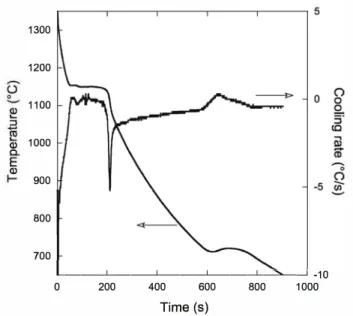
C Si Mn Cu Mg Sn 3.56 2.35 0.31 0.79 0.011 0.11 1300 1200 1100 1000 Q,) Q,) 900 800 700 __ __1.._ __ __1.._ __ __J_ __ __J_____::,,�_J -10 0 200 400 600 800 1000 Time (s)
Fig. 1 Temperature-time record of the TA cup and its time
derivative (cooling rate)
the same inoculant was added to the cup just before filling it. Figure 1 presents the whole cooling curve of the TA cup, including the solidification and solid-state transfor mation steps. Figure 2 illustrates the microstructure before (a) and after (b) etching with Nital.
lt
was seen that themicrostructure of the TA cup sample was nearly fully pearlitic as was expected from the TA record as no recalescence would have shown up if the ferrite fraction were high.
Microhardness measurements were taken with a low force of 50 gf so as to limit the size of the indentations.
lt
was recognized that this force was lower than the minimum value recommended for standard measurements, but it was expected that this would not prevent the intended com parisons. A first set of measurements was taken by implementing two grids of 100 indentations each located far from each other on the sample metallographic sec tion. The step size of the grids was 200 µm in both directions, a value large enough with respect to the microstructure for considering that the measurements were taken randomly. After microhardness measurements, the section was etched and the indentations were examined by scanning electron microscopy (SEM).
In a second step, an area of the sample large enough for containing features from the whole solidification process was selected. Using an SEM equipped with an energy dispersive spectrometer (EDS), the silicon distribution was mapped. Forty-three microhardness measurements were then taken on selected locations of this area and analysed.
.... ,... • ..
.
. .._,;,i - �-
t
. . ..•
·•• • ' • • '--
•-. ' . •·: • •. . , ... ' �_)·> _)-
� • r }, 5· : •,. . •• ).
. l ••
·
.... ,
-
-
�
..,: ,,.... -J( �- ).-',r/��- . \...:/ jf.t
-�- ) \ l. . � , ·, .. • • • }:..:;-',. 1 .. _ .<'--
.
.
)
. . .. '✓ '• '1 ':"'• �-'I � "' .• •. � .,,,, J . .-,/,. ''
-
.
'
;··\,
-
_.,�-
..
_.
·
f
·
·
..
.
··<,
:-e,:·-._,_.1· {l·-,_..� ·.�>i.,
..
.
. � ... :.( � ·, .. • --- r ,·\ t r -... . . / l ·• "I '." J · ff'\
'\..
�.·i..��;wr
,..___
.
· ..
1 ' ,...
.
.;;,,� ·
.,,
�,
·
}·
.. -
.
r
.
. •
.,,., .
.. .
).
.·t
,!... •
�.
;
' ..
.
. '-!·\/ "1' : • (f
. "
' f-
.
r;-,..
.
.
. •.» ';·
.
)·
:
�i
·
·
'
:
:-·
/':i-:::-.
<.) '
.
·
.
.
·· .
..,....),,
• l...
·
.·, ,
.. '-.
,--'I . ·:
.
:
l /":.·... .
:'.-,.\4 �
.
.
?--
-
1..
" . •• \ �-'-...: • • • � • ( • ✓• • � · 1•·s..
·P,. · .• ,.).,.( �;-,'-� �
:.<-
·
·
'c::-.. � .•• y If . ' • . _,., ' r ·/ \ . • '°°"" ·t.:Fig. 2 Microstructure of the alloy cast in TA cup before (a) and after (b) etching with Nital
3 Results
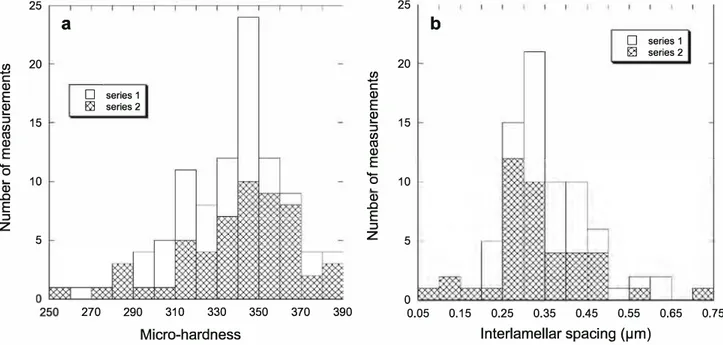
Owing to the shape and fraction of graphite, several of the indentations are seen to touch graphite particles or ferrite areas in the first set of measurements. In this case they have been disregarded, leaving 45 valid indentations for the first hundred and 55 for the next hundred of measurements. Figure 3a presents the distributions of microhardness measurements with an average at 332 HV and 339 HV for the first and second series, respectively. The distributions appear similar, and both show extended tails.
Figure 4 shows a typical example of an indentation which is seen by the cross in the upper middle part of the
25
a
Cl) 20-
C: Q)□
E � &\l :::::, 15 Cl) CO Q) E0
...
Q) 10 ..0 E :::::,z
5 270 series 1 series 2 290 310 330 Micro-hardness 350 370 390image. As in most cases, the indentation is located on several pearlite colonies that may be identified with the direction of the lamellas. Further, it is observed in some cases that the indentation deforms the lamellas as seen in the upper half of the indentation in Fig. 4.
In very few cases, the interlamellar spacing in the area in and around the indentation is homogeneous, which make the measurement easy. In most of the cases, however, the Ap values differ from one of the colonies touched by the indentation to another. In latter case, an area has been selected for measurement that is considered as represen tati ve of the indented zone, thus giving some subjectivity to the measurements. Finally, in very few cases, no
Cl)
-
C: Q) E � :::::, Cl) CO Q) E0
Q) ..0 E :::::,z
25 20 15 10 5 0 0.05b
0.15□
series 1 Œl series 2 0.25 0.35 0.45 0.55 lnterlamellar spacing (µm) 0.65 0.75Fig. 4 Example of an indentation as seen in the SEM
measurement could be performed and thus no value is reported. Figure 3b shows the number distribution of Àp values for the two series. The distributions appear again
IOO
••
•
series 10 series 2 0
similar for both series of measurements, with an impressive overall extension from 50 to 750 nm, an extent far larger than reported for hypoeutectoid steels [4].
Assuming that the true interlamellar spacing follows a Gaussian law, Ikeda et al. [5] could calculate theoretical 2D distributions and compare them with measured distribu tions. By comparison to Ikeda' s results, the characteristics of the distributions in Fig. 3b suggest the range of inter lamellar true spacings is such that a/�,ave = 20%, where a is the standard deviation of the Gaussian distribution and �,ave
is the average true interlamellar spacing. The authors have also shown that the peak of the 2D distribution deviates very little from the �,ave value.
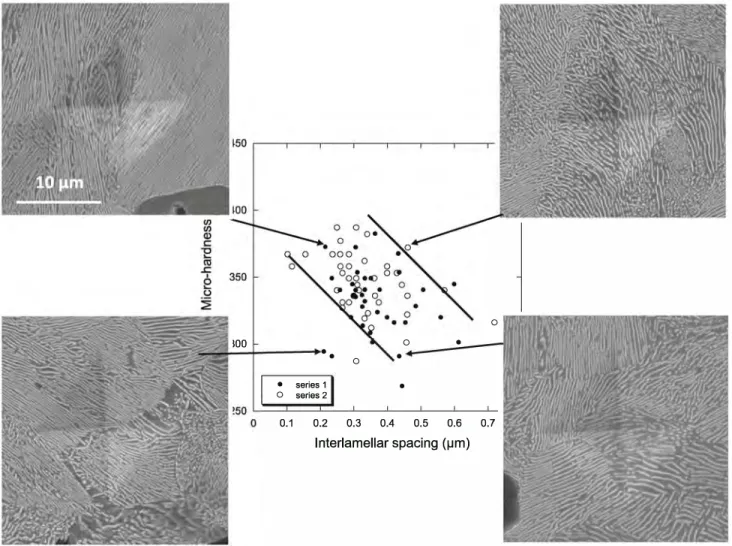
The Àp measurements are reported in Fig. 5 versus the corresponding microhardness values. Solid and open symbols relate to the first and second series of measure ments. The figure shows also a few selected indentations for the purpose of further illustration. The dashed lines have been drawn by band to stress the possible relationship
0 0
•
•
•
0.1 0.2 0.3 0.4 0.5 0.6 0.7 lnterlamellar spacing (µm)Fig. 5 Correlation between interlamellar spacing and microhardness. Examples of microhardness indentations with the same scale for ail four
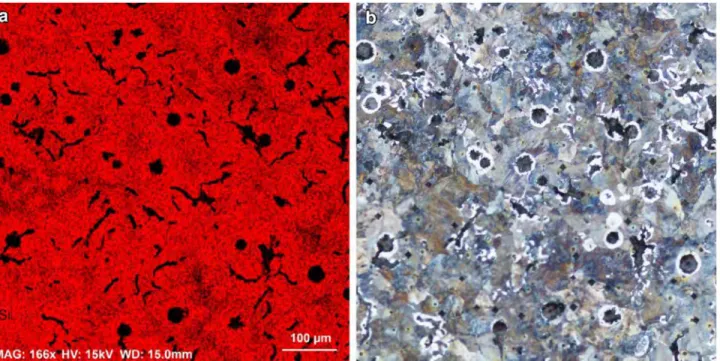
Fig. 6 a EDS silicon map; b micrograph of the same area after Nital etching 20
ai
15 E ::::, Cl) CO a.> 10 E0
Q) ..0 E 5 ::::, 1 1 1 1 1 I 1 1 1 1 1 1 1 1 -, 1 1 -nearby nodules LTF areas whole distribution 290 310 330 350 370 390 410 430 450 Micro-hardnessFig. 7 Distribution of microhardness values in relation to the
location of the indentations (see text) in the area seen in Fig. 6
between interlamellar spacing and pearlite microhardness. In doing so, the scatter of the microhardness values at given interlamellar spacing appears of the order of ± 50 HV, i.e.
±
15%.Figure 6a shows the silicon map and Fig. 6b a micro graph of the same area after Nital etching. On the EDS map, graphite nodules and worms are quite easily identi fied. Areas rich in silicon solidifies first, while areas lean in silicon are expected to represent last to freeze (LTF) zones. U sing this map as a guide, microhardness measurements are taken close to large nodules in areas appearing rich in
silicon, then on L TF zones, and finally several other indentations are located in intermediate areas. On the whole, 43 indentations have been performed from which two have been withdrawn, one that touches a graphite particle and produce a very low microhardness value and the other which produce a very high value probably because it hit an exogenous bard particle. By comparing the silicon map and the location of the indentations on the etched micrograph, it can be seen that all indentations are located on pearlite .
Figure 7 shows the whole distribution of the micro hardness values, but also differentiates the values close to the large nodules and those from the L TF areas. Compared to the distribution in Fig. 3a, it is seen that the highest value may again be due to an exogenous particle as it is found in a LTF zone. Apart for this, no distinction can be made between measurements in relation to the silicon distribution. Even though higher silicon close to the large nodules is known to increase hardness [6], segregation of other elements such as manganese in the LTF zones may counterbalance lower silicon values.
4 Discussion
The minimum interlamellar spacing is quite often used to characterize pearlite fineness in cast irons [7-9]. However, not only Vander Voort and Roosz [2] and Ridley [3] pointed out that the value obtained strongly depends on the effort put on finding the smallest spacing, but Fig. 5 shows that this will not necessarily give the highest microhardness
value for a given sample. Though Fig. 5 shows a clear trend between interlamellar spacing and microhardness, the scatter of these values is such that it may be easier for characterizing pearlite in cast irons to get an estimate of the average microhardness and interlamellar spacing values rather than to look for their maximum and minimum values.
Accordingly, it is not astonishing that the present attempt to correlate microsegregation with microhardness values is not successful. This goes in line with the most usual conclusion drawn in the literature which is that, selected additions have little or no effect in refining pearlite [1, 9, 10]. Similarly, Nayyar et al. [8] have investigated CGI alloys with various levels of nodularity and of pearlite contents and have reported Àp values varying between 150 and 350 nm without a clear correlation with cooling rate, pearlite content or alloy composition. Clearly, further understanding on the effect of cooling rate and alloy additions on pearlite interlamellar spacing will need dedi cated studies such as constrained or isothermal growth experiments.
5 Conclusions
Microhardness and perlite interlamellar spacing values have been measured on one fully pearlitic sample. Inter estingly, a clear relationship between these quantities can
be observed which may be similar in nature to the relation reported for steels cooled at various rates or alloyed with different elements. In case of cast irons, however, a very high scatter of microhardness and pearlite interlamellar spacing values is observed which results from the small size of pearlite colonies. Further, the expected effect of microsegregation seems to be hindered by this intrinsic scattering. Further understanding of pearlite in cast irons will be beneficial for dedicated experiments such as isothermal and constrained growth experiments.
References
1. Janowak J F, and Gundlach RB, AFS Trans 90 (1982) 847. 2. Vander Voort G F, and Roosz A, Metallography 17 (1984) 1.
3. Ridley N, Metall Trans A 15A (1984) 1019.
4. Ray K K, and Mondai D, Acta metal Mater 39 (1991) 2201. 5. Ikeda T, Ravi V A, and Snyder G J, J Mater Res 23 (2008) 2538.
6. Gonzâlez-Martinez R, de la Torre U, Lacaze J, and Sertucha J,
Mater Sei Eng A 712 (2018) 794.
7. Svensson H, and Sjêigren T, Key Eng Mater 457 (2011) 169. 8. Nayyar V, Svensson H, Kêinig M, Berlund A, and Nyborg L, !nt J
Micro Mater Prop 8 (2013) 262.
9. Fourkalidi V, and Dioszegi A., Mater Sei Eng A 618 (2014) 161.