Michaël Demers Bonin,1Alexandre R. Cabral,2and Mathieu Nuth2
Examination of the Effects of Solids
Content on Thickened Gold Mine Tailings
Sedimentation and Self-Weight
Consolidation
Reference
M. D. Bonin, A. R. Cabral, and M. Nuth,“Examination of the Effects of Solids Content on Thickened Gold Mine Tailings Sedimentation and Self-Weight Consolidation,” Geotechnical Testing Journal 42, no. 6 (November/December 2019): 1493–1517.https://doi.org/10.1520/ GTJ20180094
ABSTRACT
Thickening is being increasingly adopted by the mining industry because of its economic and environmental attributes, such as decreased amounts of water released following deposition and a smaller footprint of the tailings site. This study presents an assessment of the continuous process of sedimentation and the self-weight consolidation of slurry and thickened mine tailings. The results of a series of settling column tests performed with specimens with solids contents between 50 % and 72 % are presented and discussed. Lower solids contents that are more characteristic of slurry tailings were also included to cover a wide range of settling behavior. High-precision monitoring of pore water pressure was used to identify the transition from sedimentation to self-weight consolidation, which likely occurs between solids contents of 65 % and 68 % for this material, and it highlighted the fact that the combination of these two settlement processes accelerates uedissipation. The displacement results for the tailings–water
interface corroborate values in the technical literature related to the settlement of suspensions. Equilibrium was reached within a narrow time range (i.e., 400 to 500 min) despite the wide range of initial solids content in the slurries tested (i.e., 50 % S to 65 % S).
Keywords
mine tailings, self-weight consolidation, sedimentation, settling column Manuscript received July 5, 2017;
accepted for publication August 8, 2018; published online October 30, 2018.
1
Department of Civil Engineering, Université de Sherbrooke, 2500 Boul. de l’Université, Sherbrooke, QC J1K 2R1, Canada; Mine Waste Division, Golder Associates Ltd., 7250 Rue du Mile End, Montreal, QC H2R 3A4, Canada
(Corresponding author), e-mail: Michael_demersbonin@golder.
com,
https://orcid.org/0000-0001-5987-3648
2Department of Civil Engineering, Université de Sherbrooke, 2500 Boul. de l’Université, Sherbrooke, QC J1K 2R1, Canada
Introduction
Thickening of mine tailings is an approach that has been increasingly adopted over the last thirty years (Barbour et al., 1993;Williams and Ennis, 1996;McPhail et al., 2004;Oxenford and Lord, 2006). Thickened tailings (TT) generally imply a solids content range (% S; mass of dry tailings divided by the total mass of tailings) between 50 % and 70 % S (McPhail et al., 2004;Oxenford and Lord, 2006;Bussière, 2007;Daliri et al., 2014;Daliri, Simms, and Sivathayalan, 2016;Simms, 2017). Many studies suggest that the solids content cannot be used as the sole characteristic for tailings to be classified as thickened. Indeed, they also need to exhibit a nonsegregating behavior and display a small yield stress (Landriault, 2000;Jewell and Fourie, 2006;Boger, 2011). Simms (2017) suggests that thickened tailings are generally associated with a yield stress below 50 Pa and a solids content greater than 65 % for hard rock mine tailings. A conical tailings deposit with little or no water pond was one of the main promises made by Robinsky (1975), the developer of TT. Accordingly, adoption of TT would drastically change the nature and size of tailing disposal sites, which would have a significantly smaller footprint compared with traditional tailing ponds. The possibility to recycle water for the mine process is another advantage of TT, especially in arid climates, where water resources are scarce. Recirculation of water allows for minimiz-ing the volume of water pumped into the tailminimiz-ings facility, where good management can help to avoid negative effects, as far as geotechnical stability is concerned. Despite the fact that the actual benefits of TT have been questioned, the proponents of TT claim that envi-ronmental hazards and risks in terms of safety would be minimized by means of an in-creased deposit strength and a reduced risk of contaminated water seepage in the absence of decant pond (Fourie, 2012).
A key consideration related to mine wastes management is the storage capacity of tailings disposal facilities. In the case of TT disposal sites, the storage capacity depends on the settlement of the tailings material during and after deposition. Moreover, the thick-ened material may be used, in some cases, as supporting foundation for rising berms around the tailings facility. The settlement mechanisms that need to be considered in thickened tailings have not been extensively studied. However, similar mechanisms of set-tlement occur in soft soils, which are well documented in the scientific literature. Indeed, Gibson, England, and Hussey (1967) and Been and Sills (1981) advanced an understanding of soft soil consolidation, including self-weight effects, that may apply to thickened tailings. Imai (1981) and McRoberts and Nixon (1976) observed that a soil in suspension, or slurry, undergoes both sedimentation and self-weight consolidation at initially high void ratios. However, if the same soil is prepared at low-enough void ratios, only self-weight consoli-dation governs the soil behavior. Both mechanisms are likely to occur during site depo-sition of thickened tailings, depending on the initial void ratio or solids content. Other phenomena like coagulation and flocculation may also occur and affect the kinetics and amplitude of settlement (Michaels and Bolger, 1962;Imai, 1981;Tan et al., 1990;
Winterwerp and van Kesteren, 2004).
This article provides further examination of the influence of the solids content on settlement mechanisms of thickened tailings, including examination of excess pore water pressure dissipation. More specifically, the study aims to characterize the solids content thresholds beyond which sedimentation and segregation take place. Slurries with initial solids content between 50 % S and 72 % S (2.76< e0< 1.07) were deposited in a settling
column. The lower solids contents are more characteristic of slurry tailings. However, the examination of excess pore water pressure dissipation and settlement behaviors of slurry
tailings is essential to understanding TT behavior, which warrants lower solids contents. Sedimentation and self-weight consolidation were assessed by monitoring slurry–water interface displacements and pore water pressure dissipation of the tested specimens. Results of slurry–water interface displacements with time corroborate findings reported in the technical literature (Imai, 1981;Vesilind and Jones, 1990;Xu et al., 2012). The ex-perimental data at 72 % S and 60 % S were further modeled using CS2, a numerical pro-gram for self-weight consolidation (Fox and Berles, 1997). We propose that the evolution in time and space of pore water pressure can be used as a new way of identifying the boundary between sedimentation and self-weight consolidation.
Review of Sedimentation and Self-Weight
Consolidation
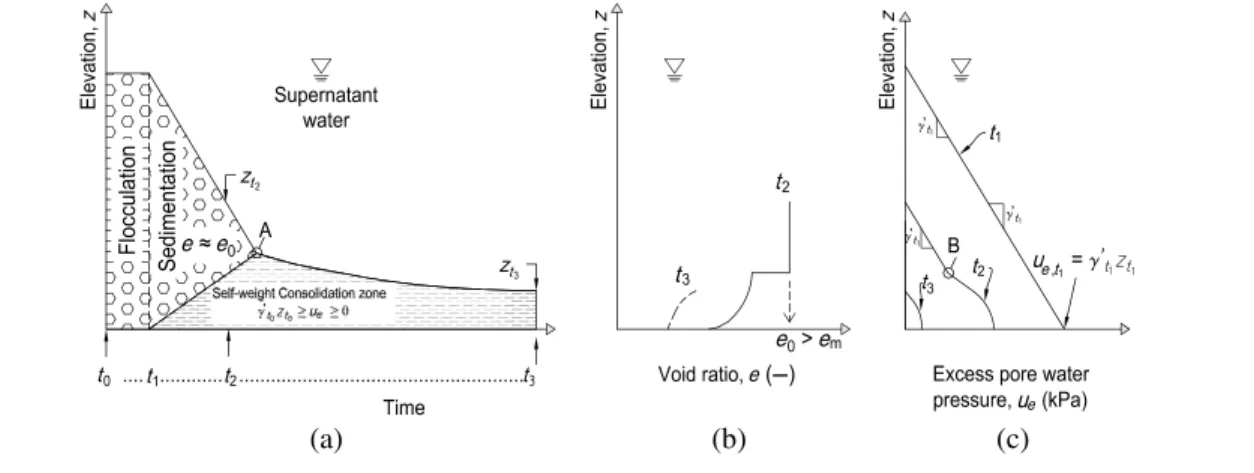
Based on the available technical literature, we adapted a schematic (Fig. 1) from Imai (1981) and Winterwerp and van Kesteren (2004) to illustrate the settlement processes, which are influenced by the existence of cohesive forces in the material. Imai (1981) dem-onstrated that a newly deposited homogeneous clayey material undergoes three main mechanisms: (1) flocculation (t0to t1inFig. 1a, with particles forming flocs under internal
forces such as electrical and Van der Waals forces, (2) sedimentation (from t1inFig. 1a),
and (3) self-weight consolidation (t1to t3inFig. 1a, which is partly concurrent with
sed-imentation). In cases where the solids content is high enough, the material can undergo only self-weight consolidation (Fig. 2).
Cohesionless or low plastic muds, such as silty and silt-like materials, may undergo only self-weight consolidation or sedimentation followed by self-weight consolidation. McRoberts and Nixon (1976) showed that sandy materials will form a rigid granular assembly under sedimentation, while no further compression would occur under self-weight consolidation because of the high hydraulic conductivities of that class of materials. According to Holdich and Butt (1997), sedimentation can be divided into two distinct phenomena: (1) at a very high void ratio, free settling dominates and particles settle
FIG. 1 Schematic representation of flocculation, sedimentation, and self-weight consolidation processes of a slurry in a settling column
with an impervious bottom and without channeling and segregation. (a) Slurry–water interface position–time response; (b) void ratio profiles; and (c)ueprofiles of a slurry ate0> em, i.e., initial void ratio greater than the void ratio associated with the beginning of self-weight consolidation.
individually without interaction with each other according to Stokes’ law (Lamb, 1932); (2) at lower void ratios, particles begin to interact and the slurry settles“en-masse” ac-cording to the principle of hindered settling (initial linear settling stage up to point A in
Fig. 1a, or initial constant rate period according to Vesilind and Jones (1990)). Kynch (1952) developed a theory for hindered settling in which the settling velocity is a function of the local concentration, and this is expressed as follows:
vs= vs,rfðeÞ (1)
where vsis the settling velocity of the slurry, vs,ris the settling velocity of a single particle or
the Stokes velocity, and f(e) is a function that describes the effect of the void ratio on the settling velocity.
In a similar way, Richardson and Zaki (1954) proposed a semi-empirical equation to evaluate the settling velocity of a slurry undergoing hindered settling; the equation is as follows:
vs= vs,rð1 − ∅sÞn (2)
where the settling velocity is influenced by the slurry volumetric concentration∅sand the
exponent n, which is dependent on the Reynolds number. McRoberts and Nixon (1976) suggested exponent n values between 5 and 30 for silty materials.
Following hindered settling, the settling curve shows a contraction point (point A in
Fig. 1a) where the slurry reaches the soil formation void ratio em. The latter is known to
define the boundary between sedimentation and self-weight consolidation. Point A is the point at which the slurry (suspension) becomes a soil and effective stress develops over the whole thickness of the deposit. Whereas Been and Sills (1981) denoted intermediate void ratio values between emand esfor which the slurry is neither a soil nor a suspension, more
recent studies (Carrier III, Bromwell, and Somogyi, 1983; Li and Williams, 1995a; de Oliveira-Filho and van Zyl, 2006) suggested that a sole soil formation void ratio (em)
is able to provide a good estimate of the boundary between sedimentation and self-weight consolidation. Moreover, experimental observations from Sills (1998) suggest that the
FIG. 2 Schematic representation of the self-weight consolidation process of a high solids content slurry in a settling column with an
impervious bottom and without channeling and segregation. (a) Slurry–water interface position–time response; (b) void ratio profiles; and (c)ueprofiles of a slurry ate0≤ em(adapted from Demers Bonin et al. (2014)).
portion of the soil undergoing hindered settling remains close to its initial void ratio (e0)
and thus shows a two-step void ratio profile (t2profile inFig. 1b). The portion undergoing
self-weight consolidation follows a decreasing void ratio path such as is illustrated by the t3
profile inFig. 1b.
At a given intermediary time (t2, seeFig. 1), the soil column is separated into two
parts: the upper part undergoing hindered settling and the bottom part undergoing self-weight consolidation (Burger and Concha, 1998;Sills, 1998).Fig. 1cshows that, initially (t1), excess pore pressure (ue) profiles are linear, while at t2the curve is subdivided into two
parts. The first is the linear part above point B, which is associated with hindered settling, and remains parallel to profile t1as long as the suspension remains close to its initial void
ratio. The second is the parabolic-shaped curve below point B, where the soil is undergoing self-weight consolidation. The transition between the two portions of the curve is more or less noticeable depending on the slurry’s hydraulic conductivity.
Slurries deposited at an initial void ratio lower than the soil formation void ratio e0≤ em(Fig. 2) have no hindered settling phase. The settling rate is constant up to point
A inFig. 2a, where it decreases until settlement stabilizes (t2). The final settlement
mecha-nism (between the time associated with point A and t2) is self-weight consolidation,
lead-ing to smaller vertical strains than sedimentation, and causes a decrease in the void ratio (Fig. 2b) and effective stress from the bottom up. Similar toFig. 1, the excess pore water pressure curves inFig. 2cpresent two different regions: one where the solids are in sus-pension (above point B at t1inFig. 2c), and another where the particles are under
self-weight consolidation (below point B at t1). In theory, solids in suspension waiting to
undergo self-weight consolidation remain close to the initial void ratio. However, exper-imental studies carried out by Sills (1998), Bartholomeeusen et al. (2002), and Li and Williams (1995b) observed a slight increase in density over the whole column from the onset. Similar ueprofiles are obtained in both cases if self-weight consolidation is
the sole mechanism of pore water dissipation (with increasing effective stress). In both cases, the portion of the curve above point B (Fig. 2c) is nearly parallel to the initial profile. From the theoretical viewpoint, Pane and Schiffman (1985) proposed an approach that links sedimentation and self-weight consolidation together by means of an interaction coefficient related to the changing effective stress. Jeeravipoolvarn, Chalaturnyk, and Scott (2009) provided a detailed numerical implementation of the Pane and Shiffman model with good prediction results of the interface height observed experimentally. Li and Williams (1995b), Burger and Concha (1998), and Toorman (1999) successfully modeled the coupled phenomena of sedimentation and self-weight consolidation by means of various numerical formulations.
Settling columns are commonly used as an experimental approach to investigate sed-imentation and self-weight consolidation (Li and Williams, 1995b;Sills, 1998;Alexis, Le Bras, and Thomas, 2004;Salfate, 2011;Demers Bonin et al., 2014). Their adoption implies, most of the time that the slurry is mixed and deposited in the column, with drainage only at the top. Usually, the evolution of the following three physical parameters is monitored: (1) excess pore pressure generated by the self-weight of the slurry supported by the water itself during sedimentation, and eventually by the soil skeleton; (2) displacement of the slurry–water interface; and (3) actual density. Settling columns typically imply the assumption of homogeneous e0, which can be attained by properly mixing the slurry.
In addition, it is well recognized that the final slurry–water interface position, the final effective stress profile, and the final void ratio profile are all a function of the initial height and e0.
Moreover, settling column tests show the advantage of allowing for estimating the hydraulic conductivity of the deposited soils. Pane and Schiffman (1997) showed that mon-itoring the interface settlement with time permits estimating the initial hydraulic conductivity according to Eq3if it is assumed that the slurry mainly undergoes hindered settling.
kðeÞ =vsið1 + eÞγw ðγs− γwÞ
(3)
where k is the hydraulic conductivity, e is the void ratio, vsiis the initial settling velocity at the
very beginning of the test, andγsandγware the unit weights of water and the soil, respectively.
Furthermore, Bartholomeeusen et al. (2002) proposed a method to obtain the k-e relationship of slurries undergoing mainly self-weight consolidation within a column hav-ing an impervious bottom. However, this method needs concomitant density and pore water pressure monitoring.
Materials and Methods
CHARACTERIZATION OF THE THICKENED TAILINGS
Tailings samples were taken from a gold mine tailings facility (location to remain undis-closed) and sent to the Soil Mechanics Laboratory of the Université de Sherbrooke. The plasticity index (Ip) is low and the material was classified as a low plasticity silt,
accord-ing to the USCS classification system, a common classification for gold mine tailaccord-ings (de Oliveira-Filho and van Zyl, 2006; Bussière, 2007). Table 1 (Demers Bonin et al., 2014) summarizes the geotechnical characteristics of the studied tailings. The very same tailings samples as used by Demers Bonin et al. (2014) were used for the tests presented herein. The yield stress was measured by Golder Associates Ltd. on samples shipped in bar-rels by the mine to the consultant’s laboratory at approximately the same time where sam-ples were shipped to the university’s laboratory. The yield stress was measured using a Brookfield Yield Rheometer model YR-1 (AMETEK Brookfield, Middleboro, MA). A sam-ple barrel was thoroughly mixed using an electric drill with a grout mixer attachment; then a specimen was taken and allowed to rest for 30 seconds prior to yield stress measurement with a rotation rate of 0.2 rotation per minute. The presence of supernatant water in the pails shipped to Université de Sherbrooke indicated that the tailings had settled during transport. The average gravimetric water content (w) of the settled material was approximately 34.7%, while w= 50.7 % after homogenization. This corresponded to a % S of 66.4 %. Demers Bonin et al. (2014) studied the self-weight consolidation behavior of thickened tailings at 68 % S (e0= 1.30). Since publication of their study, further tests have been performed
with specimens prepared by drying and rehomogenizing with distilled water at the following solids content (% S): 50 %, 55 %, 60 %, 65 %, and 72 %, with corresponding e0= 2.76, 2.27,
1.87, 1.49, and 1.07, respectively (considering the degree of saturation equal to 100 % and the specific gravity, Gs, equal to 2.76). In terms of solids contents only, the upper limit (72 % S) studied herein is higher than what is usually found for hard rock mine TT (McPhail et al., 2004;Oxenford and Lord, 2006;Bussière, 2007;Jones and Boger, 2012), while specimens prepared at 50 % S, 55 % S, and 60 % S are closer to the lower limits. The yield stress values and the segregation threshold observed in the settling columns tests suggest that specimens prepared at those solids contents are characteristics of slurry tailings. For each solids content, tests were performed in triplicates, except for the specimen at 72 % S, for which only duplicates were tested. The specimen at 72 % S had the same initial and final
experimental conditions and led to nearly the same settlement and pore water pressure values as the others.
SETTLING COLUMN EXPERIMENTAL SETUP
Self-weight consolidation experiments were conducted in the same settling column used by Demers Bonin et al. (2014), to which two supplemental features were added. One trans-ducer was placed 0.05 m above the bottom of the column, and a paper-thin measuring scale was fixed to the interior wall of the column (Fig. 3). The pressure transmitters and the experimental procedure are described by Demers Bonin et al. (2014). The column is 300 mm high and has an internal diameter of 101.6 mm (Fig. 3). This height was chosen because it is fairly close to field conditions. In fact, tailings are deposited hydraulically from the facility perimeter over various amounts of time depending on the storage capacity of the facility or the deposition scheme or both. The tailings lift thickness can reach 0.3 m to 1.0 m in several tailings storage facilities (TSFs) depending on several factors such as the duration of the deposition periods, the area of the TSF, and the distance from the spigot location. From an experimental perspective, several practical reasons warrant the use of a 300-mm-high column such that it eases manipulations in the laboratory and it allows a good spatial distribution of pore water pressure transducers over the entire height, i.e., 0.05 m to 0.10 m between each sensor in this case. It was assumed that the diameter does not result in wall friction because it is greater than 100 mm (Elder, 1985; Migniot, 1989). Direct average density measurements were made only for the whole column using the graduated measuring scale. Discretized measurements of density were not taken.
As described by Demers Bonin et al. (2014), once the porous stones had been satu-rated, the column was emptied and each transducer reading was set to zero on the data logging system. Tailings were thoroughly mixed using a grout mixer attached to an electric drill to ensure homogeneity in the water content and void ratio. Tailings slurries were then poured with a funnel and a plastic pipe to an initial height (H0) of 300 mm. Because the
bottom of the column is sealed, pore water dissipated only upward, reproducing the ex-pected behavior under field conditions. The setup of this column was chosen to reproduce TABLE 1
Characteristics of the studied gold mine tailings (Demers Bonin et al. 2014).
Characteristics ASTM Standard Gold Mine Tailings
Specific gravity, Gs ASTMD854-10a 2.76
Liquid limit, WL, % ASTMD4318-10b 29d
Plastic limit, WP, % 25e Plasticity index, IP, % 4 Sand> 75 μm, % ASTMD422-63c 8 Silt, % 81 Clay-sized particles< 2 μm, % 11 D10, mm 0.0018 D60, mm 0.021 Uniformity coefficient, CU 12 USCS classification ML Yield stress, Pa 0.78 (66 % S)c3.30 (68.5 % S)f
Note:aASTMD854-10, Standard Test Methods for Specific Gravity of Soil Solids by Water Pycnometer;bASTMD4318-10, Standard Test Methods for Liquid Limit, Plastic Limit, and Plasticity Index of Soils;cASTMD422-63, Standard Test Method for Particle-Size Analysis of Soils;dDetermined with the Swedish cone method;eBased on one (1) specimen; fThe error on the test results is greater than 1 % because of nonlinearity in the equipment’s torque spring for yield stresses below 20 Pa.
the expected behavior in the tailings facility where the samples were collected. This tailings facility is built over low permeability native soils in a wet climate that results in a tailings stack that remains saturated over most of its thickness. The hydraulic conductivity of sa-turated and consolidated tailings is lower than freshly deposited tailings that undergo sed-imentation or self-weight consolidation or both. Hence, far from the peripheral starter berms, the hydraulic gradients are expected to be mostly upward. Total pore water pres-sure (u) data started being recorded after the mixer was removed from the specimen. Sedimentation or self-weight consolidation or both caused a reduction of the height (H) of the tailings, while dissipated water formed a supernatant layer. The tailings–water interface displacement was recorded automatically with a digital camera focused on a pa-per-thin measuring scale fixed to the interior wall of the column; a similar setup was adopted by Pedroni (2011). Care was taken to make sure the digital camera was always at the same level of the moving interface. The accuracy of this measuring method has been assumed to be half of the lowest graduation, hence 0.5 mm.
After completion of sedimentation or self-weight consolidation or both (i.e., once ue
had been completely dissipated), the final tailings height (Hf) was recorded and the
super-natant water was weighed. The value of uewas calculated by subtracting the hydrostatic
pressure (uh) from the total pore water pressure (u).
CS2 NUMERICAL MODEL
The CS2 model was used in this study to support the examination of the experimental results at 60 % S and 72 % S. Demers Bonin et al. (2014), who presented a summary
mm graduated measuring scale 300 mm 101.6 mm ID 101.6 mm 0.05 m 0.05 m 0.1 m Pressure transmitter at 0 m Pressure transmitters at 0 m, 0.1 m, and 0.2 m Pressure transmitter at 0.05 m Bottom porous stone Saturation chambers with 7 µm embedded porous stones To PC via Handyscope (b) (a) FIG. 3
Empty 300-mm-high settling column (a) and filled 300-mm-high settling column with 65 % S specimen (b).
of the main characteristics of this model, showed that this numerical model reproduced very well experimental results from self-weight consolidation tests. It is important to re-member that its numerical formulation was not designed to consider sedimentation. Despite this, it was used to identify some additional interactions between self-weight con-solidation and sedimentation at 60 % S. The initial code provided by Fox and Berles (1997) was implemented within the Matlab environment (R2011 7.13.0.564) with some additional inputs based on Fox (2000) to cope with the high hydraulic gradients at the bottom of the specimen, particularly at the beginning of the self-weight consolidation simulations. Two constitutive relationships in the form of discrete point functions are used by CS2: the first expresses compressibility as a power law effective stress (σ’v)-dependent function (e=
Aσ’vB), and the second expresses hydraulic conductivities (k) as a power law void ratio
(e)-dependent function (k= CeD). The use of power laws to represent the large strain con-solidation behavior of soft soils through a vertical effective stress-dependent compressibil-ity relationship and a void ratio-dependent hydraulic conductivcompressibil-ity function has been widely reported over the years (Somogyi, 1980; Carrier III, Bromwell, and Somogyi, 1983; McVay, Townsend, and Bloomquist, 1986; Stone et al., 1994; Gjerapic and Znidarcic, 2007;Jeeravipoolvarn, Chalaturnyk, and Scott, 2009). These two constitutive relationships were adjusted by trial and error to provide the best fit to pore water pressure dissipation responses and interface displacement history. Additional inputs needed for the CS2 simulation were as follows: specific gravity, total head at bottom and top, the duration of the analysis, and the initial effective stress associated with the initial void ratio (eo).
Further details of the implementation are provided by Demers Bonin et al. (2014), whereas the original code and the verification problems are reported by Fox and Berles (1997).
Results
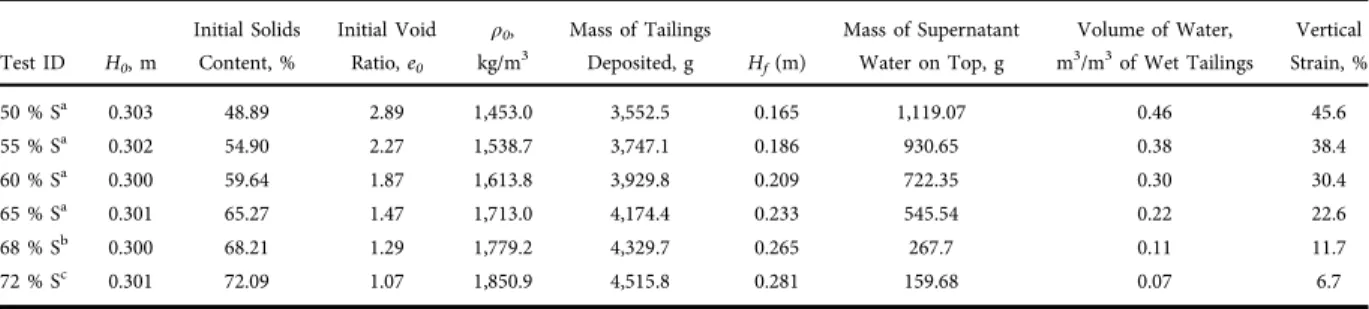
Table 2presents a summary of the test results performed in the 300-mm-high settling
column at various solids contents. Results are analyzed based on interface displacement histories and on the pore water pressure values. As expected, a higher solids content led to less deformation and expelled less water during sedimentation or self-weight consolidation or both. For instance, at 50 % S, the slurry underwent a vertical strain equal to 45.6 % and expelled 1,119 g of water, whereas at 72 % S, the slurry underwent a vertical strain equal to 6.7 % and expelled 160 g of water.
TABLE 2
Summary of test results in the 300-mm-high settling column.
Test ID H0, m Initial Solids Content, % Initial Void Ratio, e0 ρ0, kg/m3 Mass of Tailings Deposited, g Hf(m) Mass of Supernatant Water on Top, g Volume of Water, m3/m3of Wet Tailings Vertical Strain, % 50 % Sa 0.303 48.89 2.89 1,453.0 3,552.5 0.165 1,119.07 0.46 45.6 55 % Sa 0.302 54.90 2.27 1,538.7 3,747.1 0.186 930.65 0.38 38.4 60 % Sa 0.300 59.64 1.87 1,613.8 3,929.8 0.209 722.35 0.30 30.4 65 % Sa 0.301 65.27 1.47 1,713.0 4,174.4 0.233 545.54 0.22 22.6 68 % Sb 0.300 68.21 1.29 1,779.2 4,329.7 0.265 267.7 0.11 11.7 72 % Sc 0.301 72.09 1.07 1,850.9 4,515.8 0.281 159.68 0.07 6.7
Note:aTypical tests between 50 % S and 65 % S had been taken from triplicates;bAverage values based on four nearly similar tests taken from Demers Bonin et al. (2014) for comparison purposes;cThe typical test at 72 % S had been taken from duplicates rather than triplicates.
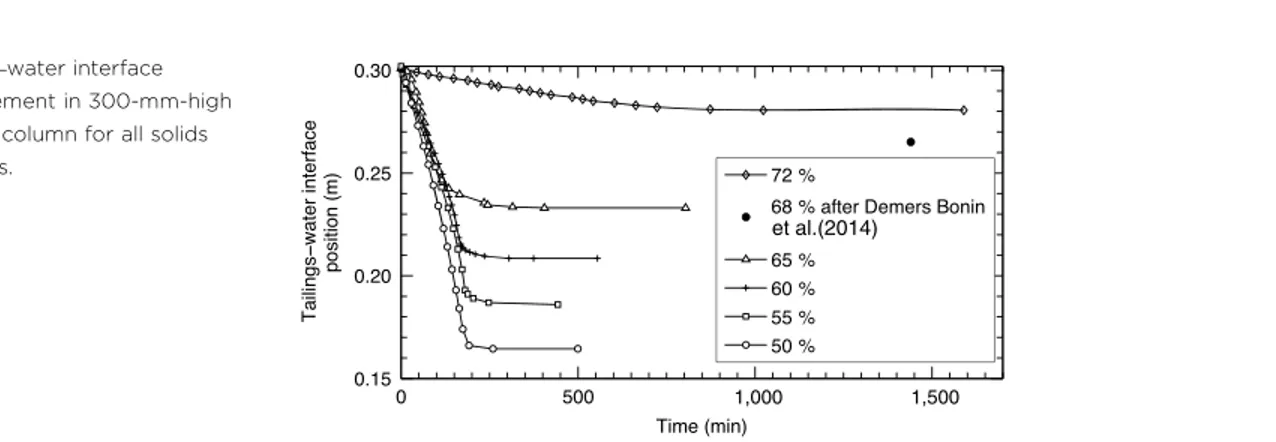
DISPLACEMENTS AT TAILINGS-WATER INTERFACE
Fig. 4shows the values of displacements of the tailings–water interface. Specimens de-posited at 72 % S underwent lower vertical strain and reached equilibrium under their own weight slower than specimens deposited at an initial solids content between 50 % S and 65 % S. Results from specimens deposited at an initial solids content between 50 and 65 % S (Fig. 4) showed that the vertical strain amplitude increased by 7 to 8 % for a decrease of 5 % in the initial solids content (seeTable 2). The results fromFig. 4show that settlement had finished after a short period of time for tests at 50 % S, 55 % S, 60 % S, and 65 % S, albeit with different initial solids contents. Specimens prepared with 72 % S showed self-weight consolidation, while other specimens showed a combination of sedimentation and self-weight consolidation, as examined later using the uehistories. The two distinct
set-tlement behaviors are in accordance with experimental observations found in the technical literature (Imai, 1981;Vesilind and Jones, 1990;Salfate, 2011;Xu et al., 2012). The test with 72 % S resulted in faster dissipation of uethan in the test with 68 % S (Demers Bonin et al., 2014). In fact, the opposite was expected, given the higher density at 72 % S. Channeling is a plausible cause because a few small volcanoes formed at the tailings surface during this test. Channeling was observed in almost every test at 72 % S, in which, typically, small volcanoes are formed at the surface of the slurry. The formation of small volcanoes at the tailings surface was also noted by Salfate (2011).
Fig. 5shows another important aspect of those tailings’ settlement behavior. At 50 %, 55 %, and 60 % S, the settling mode was dominated by an initial constant settling rate until 50 min, 75 min, and 95 min, respectively. Moreover, at 65 % S, the initial settling rate was similar to that of the specimen at 72 % S up to 17 min. From that point, the settling rate started to increase. This could be due to the combined effects of sedimentation and self-weight consolidation, plus some channeling effects.
CS2 SIMULATIONS
Fig. 6shows numerical reproductions of experimental results at 60 % S and 72 % S per-formed with CS2 (Fox and Berles, 1997). The selected constitutive relationships repre-sented by power laws (compressibility, e= Aσ’vB, and hydraulic conductivity, k= CeD)
were calibrated by trial and error to provide the best curve-fitting results (Table 3). The 72 % S interface displacement was satisfactorily modeled by CS2, as was the case of the final settlement at 68 % S reported by Demers Bonin et al. (2014). Despite the fact that CS2 cannot accurately reproduce the combined sedimentation/self-weight
FIG. 4
Tailings–water interface displacement in 300-mm-high settling column for all solids contents.
consolidation, it was used to simulate the 60 % S test in order to allow some additional analysis between both mechanisms. The CS2 simulation pertaining to the 60 % S test be-gins at 40 min when self-weight consolidation starts according to the pore water pressure dissipation analysis. A fairly good match was obtained between the model and the measured interface displacement up to 150 minutes and at the final time.
ESTIMATION OF INITIAL HYDRAULIC CONDUCTIVITY
The interface displacement curves allowed for the calculation of the initial hydraulic con-ductivity of slurry as proposed by Pane and Schiffman (1997).Fig. 7presents hydraulic conductivity as a function of the void ratio. The k values from the interface displacement curve for 50 % to 72 % S specimens were obtained by applying Eq3. The corresponding best-fit curve obtained by regression k= 4.0×10⁻⁷e4.10shows a slight discrepancy in rela-tion to estimated hydraulic conductivities from Eq3, particularly at a high void ratio. Nonetheless, the behavior observed shows a general increase in k with an increasing void
0 500 1,000 1,500 Time (min) 0.20 0.22 0.24 0.26 0.28 0.30 Tailings–water interface position (m) 72 % S 68 % S Demers Bonin et al.(2014) 60 % S CS2 FIG. 6
Tailings–water interface displacement in 300-mm-high settling column: comparison for experimental data and CS2 model for 60 % S, 68 % S, and 72 % S. 0 50 100 Time (min) 0.22 0.24 0.26 0.28 0.30 Tailings–water interface position (m) 72 % 65 % 60 % 55 % 50 %
18 min 40 min 80 min
FIG. 5
Tailings–water interface displacement in 300-mm-high settling column: zoom until 100 min for 50 to 72 % S.
ratio with a marked increase between 65 % S and 60 % S (e0between 1.87 and 1.47).
According to Xu et al. (2012), the range of void ratios for which a marked increase in k would be noted would lie in the range of emvalues for a given soil. However, settlement
and pore water pressure measurements from this study lead to emvalues ranging
approx-imately from 1.3 to 1.45. The constitutive relationships selected to reproduce the exper-imental behavior at 68 % S (Demers Bonin et al., 2014) and 72 % S led to a good reproduction of the experimental k values determined using Eq3. This equation is based on the experimental initial settling velocity of the slurry (vsi), and CS2 reproduces the same
initial k value at 68 % S and 72 % S. This confirmed that the CS2 model reproduced the initial settling stage at 68 % S and 72 % S, as shown inFig. 6. Despite what has been discussed previously, the values of k fall between 6.2× 10⁻⁷and 2.3× 10⁻⁵m/s at 72 % S and 50 % S, respectively.
Finally, it has been argued that Eq3is valid only as long as a slurry remains at e0at the
sediment–water interface, that is, as long as the surface settling rate is constant (Pane and Schiffman, 1997). Although this constant settling rate period has been generally related to sedimentation, evidence from the technical literature tends to indicate that the upper por-tion of the column that is waiting to undergo self-weight consolidapor-tion remains at its initial void ratio, thereby leading to a constant rate settling curve, until the whole column starts the transition to self-weight consolidation. The results of the simulation pertaining to the specimen at 72 % S support the previous phenomenon. For instance, inFig. 8, self-weight consolidation reached 0.15 m after 100 min as shown by the decrease in the void ratio, while the upper part remained at e= 1.07 = e0. Moreover, the CS2 reproduction of the 72
% S displacement curve, shown inFig. 6, clearly demonstrated the initial constant rate period until approximately 400 min. Because CS2 reproduced well the self-weight con-solidation of both the interface displacement and pore water pressure dissipation TABLE 3
Constitutive relationships used in CS2 for 60 % S and 72 % S tests.
Test ID e= Aσ’vBCompressibility k= CeDHydraulic Conductivity
60 % S e= 1.23σ’v−0.078 k= 7.50 × 10⁻⁶e0.70
72 % S e= 0.933σ’v−0.06 k= 5.00 × 10⁻⁷e2.67
et al. FIG. 7
Hydraulic conductivities estimation from Eq3for initial solids content between 50 % and 72 % S, the best fit obtained by regression and comparison with the constitutive
relationships used in CS2 at 68 % S and 72 % S.
(Demers Bonin et al., 2014), the results show that Eq3can be used to provide an estimate of the initial hydraulic conductivity of thickened tailings subjected to sedimentation and self-weight consolidation during the constant settling rate period. The constant settling rate period was historically associated to sedimentation only in the technical literature. The results of the study showed that this period is also observed during self-weight con-solidation or during sedimentation and concomitant self-weight concon-solidation. Moreover, the void ratio seems to remain constant at the beginning of self-weight consolidation. Based on these observations, Eq3still applies to self-weight consolidation or sedimenta-tion and concomitant self-weight consolidasedimenta-tion.
EXCESS PORE WATER PRESSURE HISTORIES
Fig. 9presents the dissipation of excess pore pressure, ue, versus time at four elevations
(bottom, 0.05 m, 0.1 m, and 0.2 m) for the 50 % S test. The uehistories at 0 m, 0.05 m, and
0.1 m showed a nonlinear profile over the whole period. In all cases, ueconverged to nearly
zero after∼300 min. The excess pressure at 0.2 m dissipates more linearly with time up to 150 min; at this time, the slurry–water interface had settled lower than the pressure trans-mitter location (Fig. 4). Also, after 150 min, the uedissipation curves monitored in the
three lower pressure transmitters started to converge. Segregation was also observed dur-ing the experiment as discussed later in the article.
0.85 0.90 0.95 1.00 1.05 1.10 0 0.05 0.10 0.15 0.20 0.25 0.30 Void ratio,e Elevation (m) 1,400 min 1 min 300 min 100 min FIG. 8
Void ratio profiles from a CS2 simulation of the 72 % S test.
0 100 200 300 400 500 Time (min) 0 0.5 1.0 1.5 2.0
Excess pore water pressure
ue (kPa) ue at 0 m (bottom) ue at 0.05 m ue at 0.1 m ue at 0.2 m 50 % S FIG. 9
History ofueversus time from the 300-mm-high settling column with an impervious bottom at 50 % S.
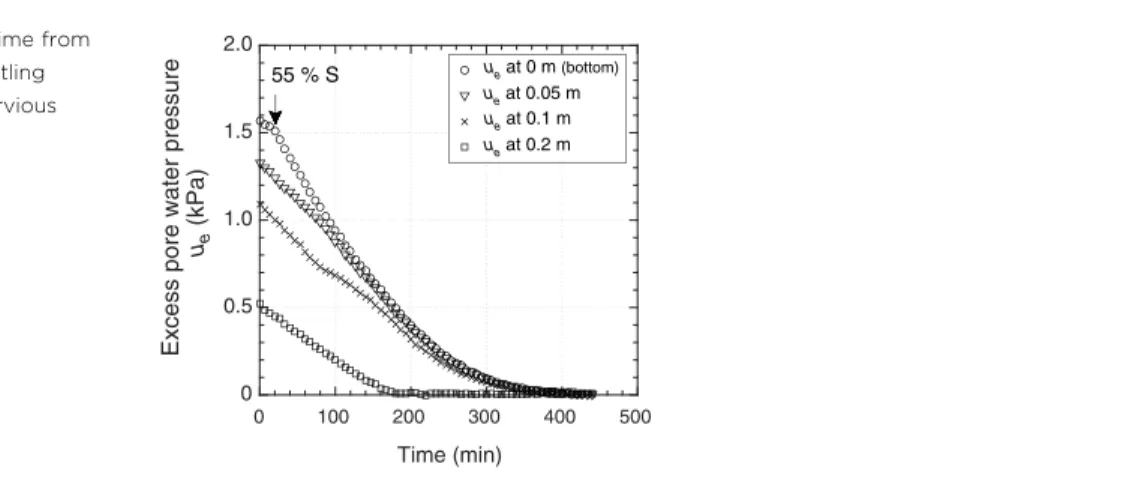
At 55 % S (Fig. 10), the pressure transmitter at 0.2 m also showed a linear decrease from 0 to 180 min, which marks the time the slurry–water interface had settled lower than the pressure transmitter location (Fig. 4). The ue curve obtained at the bottom (0 m)
features a small linear portion up to 18 min (see arrow inFig. 10), with a slope comparable to that of the 0.2-m curve. This behavior is likely related to sedimentation alone. During sedimentation, the slurry remains at its initial solids concentration and the excess pore water pressure ueis solely controlled by the height of buoyant solids in suspension within
the column H. In addition, the pore water pressure dissipation is mainly caused by displacement of the interface, according to Eq4(whereγ’ is the buoyant unit weight):
Δue = γ’ΔHue (4)
The height of the tailing–water interface was monitored for different initial solids contents (see Fig. 5). Based on Eq 4, it is also possible to predict the displacement (ΔHueÞ of the interface by knowing the magnitude of the excess pore pressure dissipation
(Δue) and the initial density of the specimen. If the interface displacement is caused by sedimentation only, then the measured displacement in the column (ΔHt) should be equal
to the displacement calculated by Eq4from the variation in excess pore water pressure (ΔHue) at the end of the linear dissipation stage at 0 m. The verification was performed for
three solids contents and, as shown inTable 4, confirmed that the sedimentation mode was prevalent at 55 % S and 60 % S. Analysis of the specimen at 65 % S is presented later in the article.
Fig. 10indicates that the whole column underwent sedimentation between 0 and
18 min, as shown by the parallel, linear portions of the curves, for all depths. However, the duration of the linear dissipation of the excess pore water pressure varies as a function of depth. The merging of curves at 0.05 m and 0 m occurred after 140 min, while the linear portion of the curve at 0.1 m lasted for 80 minutes.
The second settlement mode observed in the column is self-weight consolidation (Demers Bonin et al., 2014), which also caused a pseudo-linear dissipation of excess pore water pressure with time, albeit at a different rate from that observed for sedimentation. After 18 min, self-weight consolidation started at the bottom (see arrow inFig. 10), which explains the inflexion of the curve at 0 m. Pore water pressure dissipation resulted from
Excess pore water pressure
0 100 200 300 400 500 Time (min) 0 0.5 1.0 1.5 2.0 ue (kPa) u e at 0.2 m ue at 0 m (bottom) ue at 0.05 m ue at 0.1 m 55 % S FIG. 10
History ofueversus time from the 300-mm-high settling column with an impervious bottom at 55 % S.
both the self-weight consolidation at the bottom and sedimentation at the top of the col-umn that exhibits linear curves at 0.05, 0.1, and 0.2 m. Progressively, the self-weight con-solidation front rose to the top of the column, affecting the linearity of the curves in
Fig. 10, at 30 min at 0.05 m and 80 min at 0.1 m. The effect of the superimposition
and transition between those concomitant processes is particularly visible at a depth of 0.1 m around the 80 min mark.
Monitoring of the consolidation front was possible because the deposited denser material showed a darker color (Fig. 11), which is evidence of segregation. This segregation boundary was likely produced by high hydraulic gradients resulting from self-weight con-solidation at the bottom that drive smaller particles upward, leaving coarser particles (darker) below. It was noted that segregation started faster and lower within the column at low solids contents. This moving boundary was presumably the interface between self-weight consolidation (at the bottom) and sedimentation (at the top). The moving front (Fig. 11) reached a depth of 0.05 m at 30 min and 0.1 m at 78 min, which is consistent with the interpretation ofFig. 10regarding the transition from sedimentation to self-weight consolidation.
At 60 % S, the transition from sedimentation to self-weight consolidation likely oc-curred at 40 min (see arrow inFig. 12and seeFig. 5), 60 min and 80 min, respectively, at 0 m, 0.05 m, and 0.1 m. It was observed that the initial linear portions of curves inFig. 12
had the same slopes as those inFig. 10. The same observations drawn fromFig. 10can be applied toFig. 12, i.e., presence of sedimentation at the top of the column, self-weight consolidation occurs at the bottom, and the consolidation front progresses vertically, from the bottom up. However, in the 60 % S test, self-weight consolidation reached 0.2 m at 140 min. The late transition from sedimentation to self-weight consolidation at 60 % S compared with 55 % S could be the result of a lower hydraulic conductivity at 60 % S, as TABLE 4
Comparison ofΔH calculated from tailings–water interface displacement curves and from Δuedata at 0 m. Test ID
Period of First Linear ue Dissipation Rate, t, mina
Initial Buoyant Unit Weight,γ’0, kN/m3
Δue-t, kPa
ΔHuefromΔue-t
at 0 m (Eq4), m ΔHtfromFig. 5, m
55 % S 0–18 5.28 0.056 0.011 0.010
60 % S 0–40 6.02 0.13 0.022 0.017
65 % S 0–80 6.99 0.31 0.044 0.038
Note:aThese times refer to dashed lines inFig. 5.
FIG. 11
Evolution of segregation from the settling column test at 55 % S: (a) 30 min and (b) 78 min following the start-up of the settling test.
shown inFig. 7. Moreover, the variable em, which marks the transition between the
dep-osition modes, could vary with the initial slurry density (Imai, 1981;Liu, 1990) and thus solids content.
A CS2 simulation was carried out to support the interpretation of the transition from sedimentation to self-weight consolidation at different depths in the 60 % S test. The CS2 results were taken from a simulation initialized at 40 min when consolidation starts at the bottom of the column. From 40 min and over, sedimentation and self-weight consolida-tion occur simultaneously, which accelerates pore water pressure dissipaconsolida-tion. The modeled pore water pressure histories at 0.05 m, 0.10 m, and 0.20 m showed a pseudo-linear dis-sipation that is increasingly delayed with height until self-weight consolidation reaches these elevations. The measured pore water pressure at these elevations showed a faster dissipation, which confirms the occurrence of sedimentation. In particular, in the higher pore pressure transducer at 0.20 m, the measured pore water pressure dissipated faster than the CS2 result. The slopes of the pseudo-linear dissipation periods calculated by CS2 at intermediate elevations are similar to the measured slope at 0 m during the initial sedimentation phase between 0 and 40 min. This confirms that the slurry’s void ratio remains close to its initial void ratio during the sedimentation phase and the pseudo-linear dissipation periods.
At 65 % S (Fig. 13), self-weight consolidation occurred sooner than during tests with lower solids contents and thus had a more pronounced influence on the pressure dissi-pation than sedimentation. Channeling was also observed, which accelerated uedissipation
and made it more difficult to observe a clear transition from sedimentation to self-weight consolidation; thus, no CS2 simulation was undertaken to reproduce this test. The initial slower dissipation rate at all depths did not seem to be related to sedimentation only, as suggested by the values presented inTable 4, in whichΔHuecalculated based onΔuedata
differ fromΔHtcalculated fromFig. 5. Self-weight consolidation likely occurs at the
be-ginning of the test, as suggested by the tailings–water interface displacement curve showed inFig. 5.
As shown inFigs. 9–13, settling column tests performed at 50 % S, 55 % S, 60 % S, and 65 % S showed uedissipations that ended between 400 min and 500 min, which were
in agreement with displacement–time responses shown inFig. 4. Different initial slurry densities therefore resulted in a narrow range of equilibrium times. The main driving mechanisms (sedimentation, self-weight consolidation, and segregation) likely occurred
0 100 200 300 400 500 Time (min) 0 0.5 1.0 1.5 2.0
Excess pore water pressure
ue (kPa) ue at 0.2 m ue at 0.05 m ue at 0 m (bottom) ue at 0.1 m CS2 60 % S FIG. 12
History ofueversus time from the 300-mm-high settling column with an impervious bottom at 60 % S and comparisons with the CS2 simulations at 60 % S.
simultaneously. Channeling might have been another driving mechanism but, as indicated previously, seems not to have occurred based on visual observations, except at 65 % S.
Fig. 14shows uehistories of settling column tests initialized at 72 % S. They
corrobo-rate the results obtained by Demers Bonin et al. (2014) for specimens tested with 68 % S, i.e., immediate dissipation at the bottom and increasingly delayed self-weight consolida-tion with height. Self-weight consolidaconsolida-tion was visually estimated to start at 25 min, 175 min, and 450 min at 0.05 m, 0.1 m, and 0.2 m, respectively. Demers Bonin et al. (2014) showed that the slower dissipation of ueat higher elevations comes from self-weight
consolidation at the bottom that caused, in turn, a decrease in slurry height and not because of potential sedimentation. Self-weight consolidation is considered complete at approximately 1,400 min. As shown inFig. 14, CS2 reproduced fairly well the self-weight consolidation in the whole column.
PROFILES OF EXCESS PORE WATER PRESSURE
Figs. 15–19present profiles of excess pore water pressure with elevation. The initial ue
values (black dashed lines) in each figure were calculated using the equation Max
0 100 200 300 400 500 Time (min) 0 0.5 1.0 1.5 2.0 2.5
Excess pore water pressure
ue (kPa) ue at 0 m (bottom) ue at 0.05 m ue at 0.1 m ue at 0.2 m 6 5 % S FIG. 13
History ofueversus time from the 300-mm-high settling column with an impervious bottom at 65 % S. 0 200 400 600 800 1,000 Time (min) 0 0.5 1.0 1.5 2.0 2.5
Excess pore water pressure
ue (kPa) ue at 0 m (bottom) ue at 0.05 m ue at 0.1 m ue at 0.2 m CS2 72 % S FIG. 14
History ofueversus time from the 300-mm-high settling column with an impervious bottom at 72 % S and comparisons with the CS2 simulations at 72 % S.
ue= γ’0H0and using the associated data inTable 2. For instance, the 50 % S (Fig. 15) test
revealed a Max uevalue equal to 1.35 kPa at the bottom using an initial height of 0.303 m
and an initial buoyant weight of 4.44 kN/m3. The light grey dashed lines inFigs. 16and18
refer to the ue-tprofiles at indicated times from ue-t= γ’0Ht, where Htis the position of the
tailings–water interface for corresponding times fromFigs. 4and5. After 15 min, the lower part of the ueprofile started to bend because of local, faster dissipation of pressures
at the bottom of the column. However, the upper part of the profiles (higher than 0.1 m) tended to remain parallel to the initial uedistribution. After 50 min, the values at 0 m and
0.05 m were equal and showed a vertical profile, whereas the same observation can be made for 0.1 m after 200 min.
0 1.0 2.0 0 0.1 0.2 0.3 ue (kPa) Elevation (m) 1 min 15 min 50 min 100 min 200 min 400 min Initial ue 50 % S FIG. 15 Profiles ofueas a function of elevation for the tests performed in the 300-mm-high settling column with an impervious bottom at 50 % S. 0 1.0 2.0 ue (kPa) 0 0.1 0.2 0.3 Elevation (m) 1 min 18 min 50 min 100 min 200 min 300 min 400 min Initial ue ue-t 200 min 55 % S 100 min 50 min 18 min FIG. 16 Profiles ofueas a function of elevation for the tests performed in the 300-mm-high settling column with an impervious bottom at 55 %. Dashed grey lines represent the ue-tprofiles fromue-t= γ’0Ht, wheret refers to the indicated times.
Fig. 16presents the dissipation profiles at 55 % S. At 1 min and 18 min, the ueprofiles
remained nearly the same as the dashed lines showing that the tailings–water interface went down with no significant increase in density. This was also supported by
Fig. 10, which showed the initial linear dissipation between 0 and 18 min. The column was under sedimentation until the material reached emand started to consolidate under its
own weight at the bottom. Concurrently, the uppermost part was still under sedimentation and the tailings–water interface was moving down under the influence of the self-weight consolidation occurring at the bottom. Self-weight consolidation was expressed by the bending of the profiles from 50 min and the increase in the gap between the dashed grey lines and the measured ueprofiles. The ueresults monitored at 60 % S, shown inFig. 17,
had essentially the same patterns as those observed in Fig. 16, except that self-weight
0 1.0 2.0 ue (kPa) 0 0.1 0.2 0.3 Elevation (m) 1 min 40 min 100 min 150 min 200 min 400 min Initial ue CS2 60 % S FIG. 17 Profiles ofueas a function of elevation for the tests performed in the 300-mm-high settling column with an impervious bottom at 60 % S. Solid grey lines represent the CS2 results for indicated times.
0 1.0 2.0 ue (kPa) 0 0.1 0.2 0.3 Elevation (m) 1 min 50 min 100 min 200 min 300 min 500 min Initial ue ue-t 50 min 65 % S 100 min 200 min FIG. 18 Profiles ofueas a function of elevation for the tests performed in the 300-mm-high settling column with an impervious bottom at 65 % S. Dashed grey lines represent the ue-tprofiles fromue-t= γ’0Ht, wheret refers to the indicated times.
consolidation started at 40 min. The interaction between sedimentation and self-weight consolidation accelerated pore water pressure dissipation higher in the column as shown by the faster dissipation in measured ueprofiles from 100 min and over in comparison to
the CS2 profiles (solid light grey lines).
The results of the column test at 65 % S presented inFig. 18are consistent with those ofFig. 13in that the dissipation regime seemed to combine sedimentation, self-weight consolidation, and possibly segregation and channeling. While the self-weight consolida-tion mode was predominant (see settlement curves inFigs. 4and5), the uedissipation was
accelerated by sedimentation on one hand, and channeling and segregation at the bottom of the column on the other. At 50 min, a change in void ratio likely occurred at both ends in the column, as expressed by the bending of the measured profile in comparison to the ueprofile if only sedimentation had been undergoing (light grey dashed line). The gap
between the measured profiles and the dashed grey ueprofiles increased with time.
It is concluded from the examination of ueprofiles at 50 % S, 55 % S, 60 % S, and 65 %
S that the coexistence of sedimentation and self-weight consolidation produced a faster dissipation within the column for slurries having the same thickness at the onset of the tests. This was clearly visible in the uppermost part of the column, where a∼0-kPa reading was observed at the 0.2-m-high pressure transmitter much earlier than at the other transmitters.
The deposition results for the specimen prepared with 72 % S, which are presented in
Fig. 19, are typical of situations where self-weight consolidation is the only settling mecha-nism. The parabolic portion of the curves at a depth lower than 0.1 m show the self-weight consolidation, while the upper part is pseudo-linear until the down-moving interface reached the up-moving self-weight consolidation front (Sills, 1998;Bartholomeeusen et al., 2002). By that time, the whole column underwent self-weight consolidation and the profiles were parabolic over the whole height. It was noted that the 0.2-m-high pressure transmitter reached 0 kPa almost at the same time as the whole column; this was contrary to what was observed for tests carried out at lower solids contents, for which sedimentation preceded self-weight consolidation. 0 1.0 2.0 ue (kPa) 0 0.1 0.2 0.3 Elevation (m) 1 min 100 min 200 min 400 min 600 min 800 min 1,400 min CS2 72 % S FIG. 19 Profiles ofueas a function of elevation for the tests performed in the 300-mm-high settling column with an impervious bottom at 72 % S. Solid grey lines represent the CS2 results for indicated times.
The results of CS2 presented inFig. 19show that the model successfully reproduced the experimental results when self-weight consolidation was the only mechanism occur-ring. A similar observation was made by Demers Bonin et al. (2014) for specimens prepared at 68 % S.
Practical Implications and Conclusion
In addition to typical rheological parameters that influence the deposition of thickened tail-ings, knowledge of their settlement behavior remains a key point for the design and oper-ation of thickened TSF. Indeed, settlement behavior controls the storage capacity of the site. Despite the fact that this study only evaluated one-dimensional settlement, these results may be of great help when managing or assessing the settlement behavior of thickened tailings beaches and the amount of water released. This study provides a better understanding of the influence of the initial solids content on settlement and on the evolution of density and pore water pressure dissipation. The lower solids contents studied in this article (50 % S to 60 % S) are characteristics of slurry tailings as suggested by the yield stress values and the segregation threshold of those tailings. They were included in order to study a wide range of excess pore water pressure dissipation and settlement behaviors.
The following key observations arose from this study: (1) the greater the initial solids content, the lower the vertical strain undergone by the materials and the amount of water released during sedimentation or self-weight consolidation or both. (2) Sedimentation and self-weight consolidation can be concurrent at high void ratios or low solids contents. (3) The superimposition of these two settlement processes accelerates uedissipation. (4) Coexistence
of sedimentation and self-weight consolidation only occurs for solids contents lower than 65 to 68 %, as initially suggested by Demers Bonin et al. (2014). (5) Segregation may occur at high initial void ratios (within the lower solids content range from 50 % S to 60 % S). Because TT are generally classified as nonsegregating tailings (Li, 2015), this lower range of solids contents is associated to slurry tailings rather than TT, as suggested by the yield stress values. It is worth noting that this material did not exhibit segregation in the TSF for solids contents between 58 % S and 64 % S. (6) Experimental observations seem to indicate that segregation occurs at the very beginning in tests performed with samples at 50 % S, whereas for spec-imens at 55 % S and 60 % S, it occurred only after self-weight consolidation had started. The extent of segregation depends on the uniformity of the grain-size distribution. In the par-ticular case of the material tested herein (very uniform, with silt-sized particles), segregation occurred at low solids contents. Based on the results of this study, it is not possible, to assess if a well-graded slurry would or would not undergo segregation. (7) The coexistence of sed-imentation and self-weight consolidation results in high hydraulic gradients at the bottom that drive smaller particles up and leave a coarser matrix at the bottom, thereby leading to segregation. (8) The combination of all the settlement mechanisms led to the conclusion that equilibrium was reached within a narrow time range despite the wide range of initial slurry solids contents between 50 % S and 65 % S. This led the authors to conclude that varying deposition solids contents within this solids content range would not lead to a great disparity of dissipation times for slurries having the same thickness at the onset of the settling mech-anisms. However, the solids contents have a significant influence on the vertical deformation, the final density distribution, and the amount of released water. For instance,Table 2shows that a cubic meter of wet tailings deposited at 50 % S would release more than twice the amount of water than a cubic meter of tailings initially deposited at 65 % S.
This study also confirmed that settling columns are a good method to assess the initial hydraulic conductivity of suspensions, even when specimens undergo self-weight consoli-dation only. Nonetheless, the initial hydraulic conductivity is greatly influenced by the initial slurry density itself (Tan et al., 1990).
The authors pretend that the transition from sedimentation to self-weight consoli-dation can be well identified by visual observations of the uedissipation history with an
accurate pore water pressure sensor located at the bottom of the settling column. The change in slope to a steeper rate of dissipation at the bottom is indicative of the specific time at which the slurry undergoes a transition from sedimentation to self-weight con-solidation at this specific location. This transition occurs at a later time higher up in the column. Profiles of uecould also be used to track this transition over the deposition height,
but numerous sensors would be needed at different locations along the column wall to make sure the transition from linear to nonlinear profiles would be well captured. Identification of the transition by means of the changing slope of the uedissipation history,
as measured with accurate pore water pressure sensors, has proven reliable for the case of silt-sized mine tailings. It is speculated that this methodology may also apply to low plas-ticity or nonplastic materials such as hard rock mine tailings that do not undergo much segregation or channeling. The latter mechanisms might alter the uedissipation history to
a point that it is no longer possible to observe the transition. Further works would be needed to assess the extent of the accuracy of visual observation of the ue dissipation
history using pore water pressure sensors for other types of materials.
This research also confirmed that the CS2 model reproduced well the one-dimen-sional process of self-weight consolidation that seemed to be the sole settlement mecha-nism at 72 % S. CS2 also proved to be a good tool in supporting additional explanations regarding the interaction between sedimentation and self-weight consolidation at 60 % S. The transition from sedimentation to self-consolidation was examined through tail-ings–water interface–time responses and was further supported by uedissipation histories.
The use of a numerical tool, such as the model of Li and Williams (1995a), Burger and Concha (1998), or Jeeravipoolvarn, Chalaturnyk, and Scott (2009), would allow additional parameters, such as density, to be studied in further detail. This would introduce new elements for the influence of segregation (and possibly channeling) to the simultaneous process of sedimentation and self-weight consolidation.
ACKNOWLEDGMENTS
The authors thank Jean-Guy Lemelin and Valérie Dumoulin, technicians in the Department of Civil Engineering at the Université de Sherbrooke, for their contribution as well as Anne-Marie-Dagenais from Golder Associés Ltée and Mayana Kissiova and for their support. This study has been partly funded by the Natural Sciences and Engineering Research Council of Canada.
References
Alexis, A., Le Bras, G., and Thomas, P., 2004,“Experimental Bench for Study of Settling-Consolidation Soil Formation,”Geotech. Test. J., Vol. 27, No. 6, pp. 557–567,https:// doi.org/10.1520/GTJ11582
Barbour, S. L., Wilson, G. W., Salvas, R. J., St. Arnaud, L., and Bordin, D., 1993,“Aspects of Environmental Protection Provided by Thickened Tailings Disposal,” presented at the
International Congress on Mine Design, Kingston, Canada, A. A. Balkema, Rotterdam, the Netherlands, pp. 725–736.
Bartholomeeusen, G., Sills, G. C., Znidarči´c, D., Van Kesteren, W., Merckelbach, L. M., Pyke, R., Carrier, W. D., Lin, H., Penumadu, D., Winterwerp, H., Masala, S., and Chan, D., 2002,“Sidere: Numerical Prediction of Large-Strain Consolidation,”Géotechnique, Vol. 52, No. 9, pp. 639–648,https://doi.org/10.1680/geot.2002.52.9.639
Been, K. and Sills, G. C., 1981,“Self-Weight Consolidation of Soft Soils: An Experimental and Theoretical Study,”Géotechnique, Vol. 31, No. 4, pp. 519–535,https://doi.org/10. 1680/geot.1981.31.4.519
Boger, D. V., 2011, “Paste and Thickened Tailings - The Way Forward for a More Sustainable Mine Waste Management,” Aust. Inst. Min. Metall. Bull., No. 5, pp. 70–73. Burger, R. and Concha, F., 1998, “Mathematical Model and Numerical Simulation of the Settling of Flocculated Suspensions,” Int. J. Multiphase Flow, Vol. 24, No. 6, pp. 1005–1023,https://doi.org/10.1016/S0301-9322(98)00026-3
Bussière, B., 2007,“Colloquium 2004: Hydrogeotechnical Properties of Hard Rock Tailings from Metal Mines and Emerging Geoenvironmental Disposal Approaches,” Can. Geotech. J., Vol. 44, No. 9, pp. 1019–1052,https://doi.org/10.1139/T07-040
Carrier, W. D., III, Bromwell, L. G., and Somogyi, F., 1983,“Design Capacity of Slurried Mineral Waste Ponds,”J. Geotech. Eng., Vol. 109, No. 5, pp. 699–716,https://doi.org/ 10.1061/(ASCE)0733-9410(1983)109:5(699)
Daliri, F., Simms, P., and Sivathayalan, S., 2016, “Shear and Dewatering Behaviour of Densified Gold Tailings in a Laboratory Simulation of Multi-Layer Deposition,”
Can. Geotech. J., Vol. 53, No. 8, pp. 1246–1257,https://doi.org/10.1139/cgj-2014-0411
Daliri, F., Kim, H., Simms, P., and Sivathayalan, S., 2014, “Impact of Desiccation on Monotonic and Cyclic Shear Strength of Thickened Gold Tailings,” J. Geotech. Geoenviron. Eng., Vol. 140, No. 9, 04014048, https://doi.org/10.1061/(ASCE)GT. 1943-5606.0001147
de Oliveira-Filho, W. L. and van Zyl, D., 2006,“Modeling Discharge of Interstitial Water from Tailings Following Deposition. Part 2: Application,” Solos e Rochas, Vol. 29, No. 2, pp. 211–221.
Demers Bonin, M., Nuth, M., Dagenais, A.-M., and Cabral, A. R., 2014,“Experimental Study and Numerical Reproduction of Self-Weight Consolidation Behavior of Thickened Tailings,” J. Geotech. Geoenviron. Eng., Vol. 140, No. 12, 04014068,
https://doi.org/10.1061/(ASCE)GT.1943-5606.0001179
Fourie, A., 2012,“Paste and Thickened Tailings: Has the Promise Been Fulfilled?” pre-sented at the GeoCongress 2012, Oakland, CA, American Society of Civil Engineering, Reston, VA, pp. 4126–4135.
Fox, P. J., 2000, “CS4: A Large Strain Consolidation Model for Accreting Soil Layers,” Geotechnics of High Water Content Materials, ASTM STP1374, T. B. Edil and P. J. Fox, Eds., ASTM International, West Conshohocken, PA, pp. 29–47,https://doi. org/10.1520/STP14357S
Fox, P. J. and Berles, J. D., 1997, “CS2: A Piecewise-Linear Model for Large Strain Consolidation,”Int. J. Numer. Anal. Methods Geomech., Vol. 21, No. 7, pp. 453–475, https://doi.org/10.1002/(SICI)1096-9853(199707)21:7<453::AID-NAG887>3.0.CO;2-B
Gibson, R. E., England, G. L., and Hussey, M. J. L., 1967,“The Theory of One-Dimensional Consolidation of Saturated Clays: I. Finite Non-Linear Consolidation of Thin Homogeneous Layers,” Géotechnique, Vol. 17, No. 3, pp. 261–273, https://doi.org/ 10.1680/geot.1967.17.3.261
Gjerapic, G. and Znidarcic, D., 2007,“A Mass-Conservative Numerical Solution for Finite-Strain Consolidation during Continuous Soil Deposition,” presented at the Geo-Denver 2007 Congress on Computer Applications in Geotechnical Engineering, Denver, CO, American Society of Civil Engineering, Reston, VA, pp. 1–10.
Holdich, R. G. and Butt, G., 1997, “Experimental and Numerical Analysis of a Sedimentation Forming Compressible Compacts,” Sep. Sci. Technol., Vol. 32, No. 13, pp. 2149–2171,https://doi.org/10.1080/01496399708000761
Imai, G., 1981, “Experimental Studies on Sedimentation Mechanism and Sediment Formation of Clay Materials,” Soils Found., Vol. 21, No. 1, pp. 7–20, https://doi. org/10.3208/sandf1972.21.7
Jeeravipoolvarn, S., Chalaturnyk, R. J., and Scott, J. D., 2009, “Sedimentation-Consolidation Modeling with an Interaction Coefficient,” Comput. Geotech., Vol. 36, No. 5, pp. 751–761,https://doi.org/10.1016/j.compgeo.2008.12.007
Jewell, R. J. and Fourie, A. B., 2006,“Chapter 2,” Paste and Thickened Tailings - A Guide, Australian Centre for Geomechanics, Crawley, Australia, p. 257.
Jones, H. and Boger, D. V., 2012,“Sustainability and Waste Management in the Resource Industries,”Ind. Eng. Chem. Res., Vol. 51, No. 30, pp. 10057–10065,https://doi.org/10. 1021/ie202963z
Kynch, G. J., 1952, “A Theory of Sedimentation,” Trans. Faraday Soc., Vol. 48, pp. 166–176,https://doi.org/10.1039/tf9524800166
Lamb, H., 1932, Hydrodynamics, 6th ed., Dover Publications, New York, NY, 738p. Landriault, D. A., 2000,“What is Thickened Tailings and What Is Paste?” presented at the
Paste Technology 2000- An International Seminar on the Production and Disposal of Thickened/Paste Tailings for Mine Backfill or on the Surface, Perth, Australia, Australian Centre for Geomechanics, Crawley, Western Australia, Australia, pp. 1–17.
Li, A. L., 2015, “Tailings Subaerial and Subaqueous Deposition and Beach Slope Modeling,” J. Geotech. Geoenviron. Eng., Vol. 141, No. 1, 04014089,https://doi.org/ 10.1061/(ASCE)GT.1943-5606.0001208
Li, H. and Williams, D. J., 1995a,“Numerical Modelling of Combined Sedimentation and Self-Weight Consolidation of an Accreting Coal Mine Tailings Slurry,” presented at the 1995 International Symposium on Compression and Consolidation of Clayey Soils, Hiroshima, Japan, A. A. Balkema, Rotterdam, the Netherlands, pp. 441–446. Li, H. and Williams, D. J., 1995b, “Sedimentation and Self-Weight Consolidation
Behaviour of Coal Mine Tailings,” presented at the 1995 International Symposium on Compression and Consolidation of Clayey Soils, Hiroshima, Japan, A. A. Balkema, Rotterdam, the Netherlands, pp. 117–122.
Liu, J.-C., 1990,“Determination of Soft Soil Characteristics,” Ph.D. thesis, University of Colorado, Boulder, CO.
McPhail, G., Noble, A., Papageorgiou, G., and Wilkinson, D., 2004,“Development and Implementation of Thickened Tailings Discharge at Osborne Mine, Queensland, Australia,” presented at the 2004 International Seminar on Paste and Thickened Tailings, Cape Town, South Africa, Paterson & Cooke Consulting Engineers (Pty) Ltd., School of Civil and Environmental Engineering, University of Witwatersrand, Johannesburg, South Africa, pp. 1–32.
McRoberts, E. C. and Nixon, J. F., 1976,“A Theory of Soil Sedimentation,”Can. Geotech. J., Vol. 13, No. 3, pp. 294–310,https://doi.org/10.1139/t76-031
McVay, M., Townsend, F., and Bloomquist, D., 1986, “Quiescent Consolidation of Phosphatic Waste Clays,” J. Geotech. Eng., Vol. 112, No. 11, pp. 1033–1049,https:// doi.org/10.1061/(ASCE)0733-9410(1986)112:11(1033)
Michaels, A. S. and Bolger, J. C., 1962,“Settling Rates and Sediment Volumes of Flocculated Kaolin Suspensions,”Ind. Eng. Chem. Fundam., Vol. 1, No. 1, pp. 24–33,https://doi.org/ 10.1021/i160001a004
Oxenford, J. and Lord, E. R., 2006,“Canadian Experience in the Application of Paste and Thickened Tailings for Surface Disposal,” presented at the Ninth International Seminar on Paste and Thickened Tailings (Paste 2006), Limerick, Ireland, Australian Centre for Geomechanics, Crawley, Australia, pp. 93–105.
Pane, V. and Schiffman, R. L., 1985, “Note on Sedimentation and Consolidation,”
Géotechnique, Vol. 35, No. 1, pp. 69–72,https://doi.org/10.1680/geot.1985.35.1.69
Pane, V. and Schiffman, R. L., 1997, “The Permeability of Clay Suspensions,”
Géotechnique, Vol. 47, No. 2, pp. 273–288,https://doi.org/10.1680/geot.1997.47.2.273
Pedroni, L. 2011,“Étude expérimentale et numérique de la sédimentation et de la con-solidation des boues de traitement des eaux acides,” Ph.D. thesis, École Polytechnique de Montréal, Montréal, Canada.
Richardson, J. F. and Zaki, W. N., 1954,“Sedimentation and Fluidization: Part I,” Trans. Inst. Chem. Eng., Vol. 32, pp. 35–53.
Robinsky, E. I., 1975, “Thickened Discharge—A New Approach to Tailings Disposal,” CIM Bull., Vol. 68, No. 764, pp. 47–53.
Salfate, E. R., 2011,“Predicting Void Ratio For Surface Paste Tailings Deposited in Thin Layers,” M.A. Sc. thesis, University of British Columbia, Vancouver, Canada. Sills, G. C., 1998,“Development of Structure in Sedimenting Soils,”Philos. Trans. R. Soc.,
Ser. A, Vol. 356, No. 1747, pp. 2515–2534,https://doi.org/10.1098/rsta.1998.0284
Simms, P., 2017,“2013 Colloquium of the Canadian Geotechnical Society: Geotechnical and Geoenvironmental Behaviour of High-Density Tailings,”Can. Geotech. J., Vol. 54, No. 4, pp. 455–468,https://doi.org/10.1139/cgj-2015-0533
Somogyi, F., 1980,“Large-Strain Consolidation of Fine-Grained Slurries,” presented at the Canadian Society for Civil Engineering Annual Conference, Canadian Society for Civil Engineering, Montreal, Canada, pp. 1–16.
Stone, K. J. L., Randolph, M. F., Toh, S., and Sales, A. A., 1994, “Evaluation of Consolidation Behavior of Mine Tailings,” J. Geotech. Eng., Vol. 120, No. 3, pp. 473–490,https://doi.org/10.1061/(ASCE)0733-9410(1994)120:3(473)
Tan, T. S., Yong, K. Y., Leong, E. C., and Lee, S. L., 1990,“Sedimentation of Clayey Slurry,”
J. Geotech. Eng., Vol. 116, No. 6, pp. 885–898, https://doi.org/10.1061/(ASCE)0733-9410(1990)116:6(885)
Toorman, E. A., 1999, “Sedimentation and Self-Weight Consolidation: Constitutive Equations and Numerical Modelling,” Géotechnique, Vol. 49, No. 6, pp. 709–726,
https://doi.org/10.1680/geot.1999.49.6.709
Vesilind, P. A. and Jones, G. N., 1990,“A Reeexamination of the Batch-Thickening Curve,” Res. J. Water Pollut. Control Fed., Vol. 62, No. 7, pp. 887–893.
Williams, M. P. A. and Ennis, P. C., 1996,“Suitability of the Central Thickened Discharge Method for Nickel Tailings Disposal in Western Australia,” presented at the 1996 Nickel Conference, Kalgoorlie, Australia, Australian Institute of Mining and Metallurgy, Carlton, Australia, pp. 275–284.
Winterwerp, J. C. and van Kesteren, W. G. M., 2004, Introduction to the Physics of Cohesive Sediment in the Marine Environment, Elsevier B.V., Amsterdam, the Netherlands, 576p.
Xu, G.-Z., Gao, Y.-F., Hong, Z.-S., and Ding, J.-W., 2012,“Sedimentation Behavior of Four Dredged Slurries in China,”Mar. Georesour. Geotechnol., Vol. 30, No. 2, pp. 143–156,