Publisher’s version / Version de l'éditeur:
Vous avez des questions? Nous pouvons vous aider. Pour communiquer directement avec un auteur, consultez la première page de la revue dans laquelle son article a été publié afin de trouver ses coordonnées. Si vous n’arrivez pas à les repérer, communiquez avec nous à PublicationsArchive-ArchivesPublications@nrc-cnrc.gc.ca.
Questions? Contact the NRC Publications Archive team at
PublicationsArchive-ArchivesPublications@nrc-cnrc.gc.ca. If you wish to email the authors directly, please see the first page of the publication for their contact information.
https://publications-cnrc.canada.ca/fra/droits
L’accès à ce site Web et l’utilisation de son contenu sont assujettis aux conditions présentées dans le site LISEZ CES CONDITIONS ATTENTIVEMENT AVANT D’UTILISER CE SITE WEB.
IOP Conference Series: Materials Science and Engineering, 609, 2019-09-01
READ THESE TERMS AND CONDITIONS CAREFULLY BEFORE USING THIS WEBSITE.
https://nrc-publications.canada.ca/eng/copyright
NRC Publications Archive Record / Notice des Archives des publications du CNRC :
https://nrc-publications.canada.ca/eng/view/object/?id=399a5457-3669-4cdc-bfc7-a9eb1c6831b7 https://publications-cnrc.canada.ca/fra/voir/objet/?id=399a5457-3669-4cdc-bfc7-a9eb1c6831b7
NRC Publications Archive
Archives des publications du CNRC
This publication could be one of several versions: author’s original, accepted manuscript or the publisher’s version. / La version de cette publication peut être l’une des suivantes : la version prépublication de l’auteur, la version acceptée du manuscrit ou la version de l’éditeur.
For the publisher’s version, please access the DOI link below./ Pour consulter la version de l’éditeur, utilisez le lien DOI ci-dessous.
https://doi.org/10.1088/1757-899X/609/4/042028
Access and use of this website and the material on it are subject to the Terms and Conditions set forth at
Bayesian inference of thermal comfort: evaluating the effect of
“well-being” on perceived thermal comfort in open plan offices
Crosby, Sarah; Newsham, Guy; Veitch, Jennifer; Rogak, Steven; Rysanek,
Adam
IOP Conference Series: Materials Science and Engineering
PAPER • OPEN ACCESS
Bayesian inference of thermal comfort: evaluating the effect of
“well-being” on perceived thermal comfort in open plan offices
To cite this article: Sarah Crosby et al 2019 IOP Conf. Ser.: Mater. Sci. Eng. 609 042028
View the article online for updates and enhancements.
Content from this work may be used under the terms of theCreative Commons Attribution 3.0 licence. Any further distribution of this work must maintain attribution to the author(s) and the title of the work, journal citation and DOI.
Published under licence by IOP Publishing Ltd
IAQVEC
IOP Conf. Series: Materials Science and Engineering 609 (2019) 042028
IOP Publishing doi:10.1088/1757-899X/609/4/042028
1
Bayesian inference of thermal comfort: evaluating the effect of
“well-being” on perceived thermal comfort in open plan
offices
Sarah Crosby1,*, Guy Newsham 2, Jennifer Veitch 2, Steven Rogak 1, and Adam Rysanek 1, 3 1 Department of Mechanical Engineering, University of British Columbia, BC, Canada.
2 Construction Research Centre, National Research Council Canada, Ottawa, ON, Canada.
3 School of Architecture and Landscape Architecture, University of British Columbia, BC, Canada. * sarah.crosby@mech.ubc.ca
Abstract. The judgment of thermal comfort is a cognitive process which is influenced by physical, psychological and other factors. Prior studies have shown that occupants, who are generally satisfied with many non-thermal conditions of indoor environmental quality, are more likely to be satisfied with thermal conditions as well. This paper presents a novel approach that considers the effect of non-thermal building environmental design conditions, such as indoor air quality and noise levels, on perceived thermal comfort in open-plan offices. The methodology involves the use of Bayesian inference to relate the occupant’s thermal dissatisfaction in a building not only to thermal conditions and occupant metabolic factors (i.e., parameters of the original Fanger model), but also to measurable non-thermal metrics of indoor environmental quality. A Bayesian logistic regression approach is presented in this paper. The experimental context regards a prior indoor environmental quality measurement and evaluation study of 779 occupants of open-plan offices throughout Canada and the US. We present revised PMV-PPD curves for real-world offices that take into account both thermal and wellbeing IEQ parameters. The Bayesian inference analysis reveals that the occupant’s thermal dissatisfaction is influenced by many non-thermal IEQ conditions, such as indoor CO2 concentrations and the satisfaction with the office lighting intensity.
1. Introduction
Today, dissatisfaction with indoor thermal conditions is known to be one of the most common sources of complaints by occupants of commercial buildings with respect to indoor environmental quality (IEQ) [1]. These complaints are not without merit, either. When building occupants are found to be dissatisfied with their thermal environment, it has been observed that their overall health, productivity, well-being, and satisfaction with the workplace are adversely affected [2-6].
This study aims to fill a prevailing research gap with respect to standard models of thermal comfort in that models have not always accurately predicted true thermal comfort observations from field studies [15]. As salient models such as the Fanger PMV-PPD model or Adaptive Comfort model only take into account thermal factors when predicting thermal comfort, the increasing awareness of the interdependencies between perceived thermal comfort and overall IEQ, as observed in the papers cited above, suggests that correlating thermal comfort prediction to non-thermal metrics of IEQ may be beneficial. It is therefore the objective of this paper to evaluate the effect of non-thermal IEQ parameters, such as lighting intensity, acoustic performance, and indoor air quality, on the perceived thermal comfort within office spaces.
IAQVEC
IOP Conf. Series: Materials Science and Engineering 609 (2019) 042028
IOP Publishing doi:10.1088/1757-899X/609/4/042028
2
1.1. Well-being IEQ factors affecting overall comfort
ASHRAE defines thermal comfort as “the condition of the mind in which satisfaction is expressed with the thermal environment” [7]. While there does not appear to be a dispute in literature whether thermal comfort can be attributed to thermo-physical parameters of the human body, as defined by Fanger’s PMV model, it is nevertheless increasingly accepted that thermal comfort can be influenced by personal differences in mood, culture and other individual and social factors [6,8].
Until recently, systematic performance criteria for IEQ, which takes into account both psychological and physical indicators of IEQ, have not been explicitly expressed in prevailing building codes and standards. However, in 2014, the International WELL Building Institute launched the WELL building standard, a building performance accreditation scheme focusing solely on the health, comfort and wellness of building occupants [9]. The emergence of the WELL standard occurred in tandem with recent research exploring the interdependencies between thermal comfort, IEQ, and building design. For instance, Wagner et al. [10] conducted a field study on occupant’s thermal comfort and their general satisfaction with the workplace (which included satisfaction with air quality, noise and daylight) in office buildings. They found that occupants who are generally satisfied with many non-thermal metrics of IEQ are more likely to be satisfied with thermal conditions as well. In previous studies by Huang et al., Rupp et al., Al Horr et al., and Kamaruzzaman et al. [11-14]; the authors found that acoustic and visual comfort, biophilia, indoor air quality and office layout can affect overall occupant comfort and satisfaction. Jamrozik et al. [6]studied the effect of six well-being factors on the occupant’s satisfaction in a living lab experimental setup. They found that the perceptions of environmental conditions which were not varied were also affected. This finding suggests that building occupants’ perceptions of environmental conditions may be holistic: dissatisfaction with one set of environmental conditions may affect occupants’ perception of the whole environment and result in dissatisfaction with a physically unrelated set of environmental conditions.
1.2. Bayesian modelling of Thermal Comfort
Bayesian processing, which refers to the computational modelling of Bayesian problems, has been used effectively in recent years to improve the characterization of thermal comfort probability distributions using new observational data. They incorporate previous knowledge on thermal comfort distributions from past research into the current estimation of model parameters and provide a robust manner of updating these parameters as more data becomes available. For example, Langevin et al. [15] developed an updated curve for the PMV-PPD relationship using Bayesian analysis on datasets from both laboratory and field settings using Fanger lab-based raw data as a prior for the field-based ASHRAE RP-884 datasets [16]. Jensen et al., [4] developed a model which correlates the indoor temperature with the mental performance of office employees using a Bayesian Network approach. They used data from RP-884 to build a correlation between thermal sensation votes and indoor air temperature.
2. A Novel Mathematical Bayesian Framework of Thermal Comfort
This paper seeks to quantify the effect of non-thermal IEQ conditions, such as indoor lighting levels, and CO2, on metrics of perceived thermal comfort. The research underlying this paper proposes a novel Bayesian framework for the instantaneous evaluation of occupant thermal dissatisfaction, taking into account measurements of non-thermal and thermal IEQ conditions. One incarnation of the framework is specifically proposed and evaluated: an expansion of the Fanger PMV model in a manner that allows for the probability of thermal dissatisfaction, p(D) or ‘PPD’ in the PMV model’s terminology, to be related not only to the original Fanger model terms, 𝜃𝜃 = {𝑇𝑇, 𝑅𝑅𝑅𝑅, 𝑀𝑀𝑅𝑅𝑇𝑇, 𝑉𝑉, 𝑚𝑚𝑚𝑚𝑚𝑚, 𝑐𝑐𝑐𝑐𝑐𝑐}, but also to several non-thermal IEQ parameters defined by separate set of terms, WELL. For the Fanger: T = air temperature (ºC), RH = relative humidity (%), MRT = mean radiant temperature (ºC), V = air velocity (m/s), met = the Fanger metric of metabolic rate, and clo = the Fanger metric of clothing insulation levels. In the Bayesian framework, posterior predictions of thermal dissatisfaction can be determined as follows:
IAQVEC
IOP Conf. Series: Materials Science and Engineering 609 (2019) 042028
IOP Publishing doi:10.1088/1757-899X/609/4/042028
3
2.1. Field data source
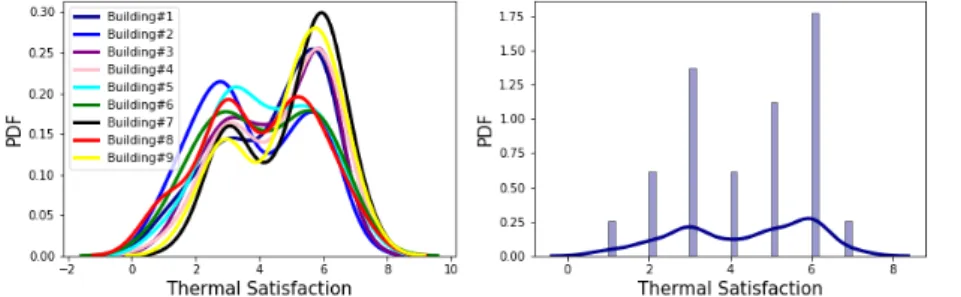
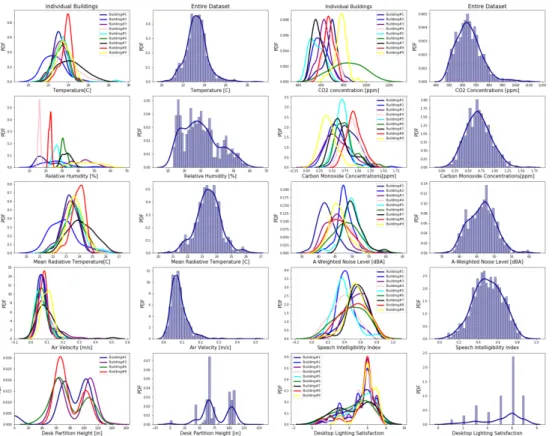
Field IEQ data are drawn from the Cost-effective Open-Plan Environment (COPE) field study database made available for this research by the National Research Council of Canada (NRC). The database consists of IEQ data collected from 779 workstations and their occupants in nine buildings between 2000 and 2002 across Canada and the United States [17]. The IEQ data consists of over 4 physical measurements of thermal conditions, such as temperature and relative humidity, and additionally 12 measurements of non-thermal conditions, such as noise levels and CO2 concentrations. A measurement for all parameters was made at each workstation in parallel to an occupant questionnaire that evaluated occupants’ instantaneous satisfaction with some thermal and non-thermal conditions. For this study, a broad set of non-thermal measurements and questionnaire answers are used to characterize conditions of air quality, lighting, acoustics, and interior design. These are defined by the set 𝑊𝑊𝑊𝑊𝑊𝑊𝑊𝑊 = {𝐶𝐶𝐶𝐶2, 𝐶𝐶𝐶𝐶, 𝑁𝑁, 𝑆𝑆𝑆𝑆𝑆𝑆, 𝐷𝐷𝑅𝑅, 𝑊𝑊𝑆𝑆}, where CO2 = indoor air CO2 concentrations (ppm), CO = indoor air CO concentrations (ppm), N = A-weighted indoor noise levels (dBA), SII = speech intelligibility index, DH = workstation partition desk height (m), LS = surveyed occupant satisfaction with indoor light levels (a Likert scale from 1 to 7). In addition, the COPE dataset also contains occupant responses to the question of thermal satisfaction, TS, measured on a Likert scale from 1, ‘very dissatisfied’, to 7 ‘very satisfied’. Distributions of TS data per building and for the entire COPE database are shown in figure 1. Figure 2 illustrates data for all 𝜃𝜃 and WELL parameters, as derived from the COPE dataset. Distributions of each metric per building in the COPE dataset are also shown. The probability density functions of each parameter are only generated for the purposes of comparison in figure 2 and are not used further in this study.
Figure 1. Probability Distributions of thermal satisfaction across all buildings
2.2. Bayesian logistic regression
Logistic regression belongs to a class of Generalized Linear Models (GLMs) that can be used to predict the relationship between one non-continuous dichotomous (binary) dependent variable and one or more independent variables. In this paper, a Bayesian logistic regression model is developed to represent eq (1) and is applied to the COPE database. The model predicts the linear relationship between thermal dissatisfaction (D), Fanger thermal conditions (𝜃𝜃) and non-thermal parameters (WELL) drawn from the dataset. By considering 𝛽𝛽 as a set of regression model coefficients, p(𝐷𝐷| 𝜃𝜃, 𝑊𝑊𝑊𝑊𝑊𝑊𝑊𝑊) is estimated as: 𝑝𝑝(𝐷𝐷| 𝜃𝜃, 𝑊𝑊𝑊𝑊𝑊𝑊𝑊𝑊) = 1 + 𝑒𝑒 − �∑ �𝛽𝛽𝜃𝜃 ∙𝜃𝜃�+∑𝜃𝜃 𝑊𝑊𝑊𝑊𝑊𝑊𝑊𝑊1 �𝛽𝛽𝑊𝑊𝑊𝑊𝑊𝑊𝑊𝑊 ∙𝑊𝑊𝑊𝑊𝑊𝑊𝑊𝑊�+𝛽𝛽� (2) The probability of dissatisfaction, p(D), is modelled as a dichotomous dependent variable and the 10 WELL and 𝜃𝜃 parameters are modelled as continuous independent variables. Observed data for p(D) is inferred from the COPE dataset by assuming that for each survey response, i:
𝐷𝐷𝑖𝑖 = � 1 or dissatisfied if 𝑇𝑇𝑆𝑆 < 40 or satisfied if 𝑇𝑇𝑆𝑆 ≥ 4 (3)
2.3. Model descriptions
Two different logistic models are generated in this study. First, the conditional probabilities of thermal dissatisfaction given thermal and non-thermal IEQ parameters are regressed using ten IEQ variables drawn from the COPE database, such that posterior distributions of p(D|𝜃𝜃, WELL) are inferred.
IAQVEC
IOP Conf. Series: Materials Science and Engineering 609 (2019) 042028
IOP Publishing doi:10.1088/1757-899X/609/4/042028
4
Figure 2. Probability distributions of Fanger and WELL parameters across all buildings The second model seeks to update the relationship between thermal dissatisfaction and predicted mean vote (PMV) by inferring posterior distributions of p(D|𝑃𝑃𝑀𝑀𝑉𝑉, WELL). For this case, PMV is calculated from measured values of values of 𝜃𝜃 and recommended values of ‘clo’ and ‘met’ for office spaces as per ANSI/ASHRAE 55 Standard- table 5.2.2.A and table 5.2.1.2 respectively [7].
2.4. Sampling of posterior distributions
The Bayesian statistics Python library, PyMC3, is used to infer the posterior probability of occupant’s dissatisfaction for all the models presented. 5000 samples are drawn from the posteriors using the NUTS sampler, a type of Markov Chain Monte Carlo (MCMC) sampling method.
Weakly informative priors for the model regression parameters 𝛽𝛽 are used, as recommended by Gelman et al. [18]. The following model parameters are modelled as having a first order linear relationship with p(D): T, RH, MRT and CO2. The following parameters are modelled as having a quadratic relationship with p(D): V, 𝐶𝐶𝐶𝐶, 𝑁𝑁, 𝑆𝑆𝑆𝑆𝑆𝑆, 𝐷𝐷𝑅𝑅, 𝑊𝑊𝑆𝑆 The order of the correlations has been determined by trial and error.
3. Results and Discussion
3.1. Relationship between occupant’s thermal dissatisfaction and non-thermal well-being IEQ
Figure 3 shows the results from the first set of logistic regression models that predicts the correlations between thermal dissatisfaction p(D) given a fixed set of Fanger thermal conditions, 𝜃𝜃0, (equivalent to
PMV ≈ 0) and WELL parameters. 𝜃𝜃0= {𝑇𝑇 = 24 °C, 𝑅𝑅𝑅𝑅 = 25%, 𝑀𝑀𝑅𝑅𝑇𝑇 = 23.5 °C, 𝑉𝑉 = 0.05 m/s}, and
PMV (𝜃𝜃0, 𝑚𝑚𝑚𝑚𝑚𝑚 = 1, 𝑐𝑐𝑐𝑐𝑐𝑐 = 1)= 0. The results yield an observable relationship between surveyed thermal
dissatisfaction and several WELL parameters. For example, it is observed that indoor air CO2 and thermal dissatisfaction are positively correlated; more occupants are thermally dissatisfied at higher indoor CO2 concentrations than at lower indoor CO2 concentrations.
Similarly, it is shown in figure 3 that when the qualitative satisfaction with desktop lighting is higher, the dissatisfaction with the thermal conditions decreases significantly. The A- weighted noise levels and speech intelligibility index are also showing a positive and negative correlation respectively,
IAQVEC
IOP Conf. Series: Materials Science and Engineering 609 (2019) 042028
IOP Publishing doi:10.1088/1757-899X/609/4/042028
5
which mean that occupants experiencing higher noise levels would tend to be less satisfied with thermal conditions as well. The desktop partition height also observes an apparently high positive correlation with the probability of dissatisfaction, as shown in figure 3. One of the more interesting parameters is that of indoor air carbon monoxide concentrations, which show an inverse correlation with p(D).
Figure 3. Probability p(D | 𝜃𝜃0, WELL), where 𝜃𝜃0= {𝑇𝑇 = 24 °C, 𝑅𝑅𝑅𝑅 = 25%, 𝑀𝑀𝑅𝑅𝑇𝑇 = 23.5 °C, 𝑉𝑉 =
0.05 m/s} and PMV (𝜃𝜃0, 𝑚𝑚𝑚𝑚𝑚𝑚 = 1, 𝑐𝑐𝑐𝑐𝑐𝑐 = 1) =0. Solid green lines indicate mean predicted value from
all samples, with shaded green bands indicated the standard error.
The significance of these results suggests further analysis of the COPE dataset, and similar future datasets capturing non-thermal IEQ data, are warranted. The observable correlation between metrics such as desk partition height, carbon monoxide levels, and thermal dissatisfaction are striking, and not altogether easy to comprehend. On one hand, in defence of the model’s robustness, sensor measurements of CO in the COPE dataset are distributed relatively evenly across the surveyed buildings in the COPE dataset, but it is not wholly clear if CO concentrations may be an indicator of a primary issue driving its observed impact on perceived thermal dissatisfaction. Without identifying the source of CO concentrations, one cannot wholly conclude that thermal discomfort is correlated directly to CO. A similar view must be taken for all considered parameters, suggesting that in a future work, the interdependency of WELL parameters will be examined.
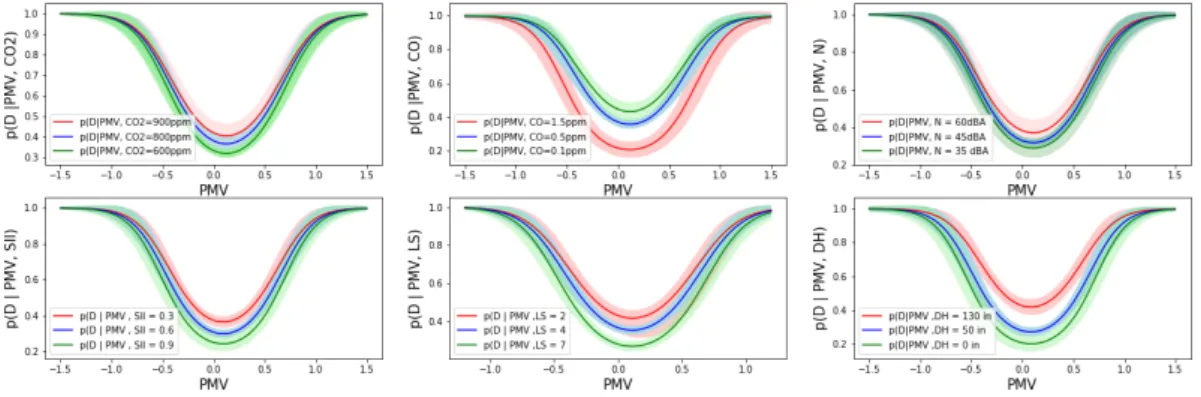
3.2. WELL-adjusted relationship between PMV and thermal dissatisfaction p(D)
Figure 4 shows the results from the second set of modelling which predicts an adjusted relationship between estimated PMV and the thermal dissatisfaction given non-thermal WELL parameters, p(D | PMV, WELL). It is seen from the results that at PMV= 0, non-thermal parameters do appear to disrupt perceived thermal satisfaction. For example, at PMV = 0, the likelihood of thermal dissatisfaction increases from 0.3 to over 0.4 if the CO2 levels increases from 600 to 900 ppm. If these observations are found to be repeatable in other contexts, the implications of such correlations are significant. If, in the future, it is possible to directly affect thermal satisfaction through improvement of non-thermal conditions in indoor spaces, it will encourage new thinking in regard to how to most cost-effectively deliver heating and cooling services in the built environment.
4. Conclusion
This paper presented a novel methodology for the evaluation of thermal comfort which includes not only thermal IEQ parameters, but also non-thermal indoor building design conditions. Bayesian logistic regression is applied to a prior field experimental IEQ data in order to predict the relationships between occupant thermal dissatisfaction and 10 thermal and non-thermal IEQ parameters.
The models’ results revealed an observable correlation between thermal dissatisfaction, as experienced by occupants of open-plan office spaces, and non-thermal IEQ parameters such as CO2 concentrations, lighting, noise and speech levels and also the height of the desktop partition. Our exploration of the relationship between PMV and thermal dissatisfaction, analogous to the classic PPD-PMV relationship of the Fanger model, reveal a potentially important finding, that occupant thermal satisfaction may be measurably improved by improving ‘well-being’-related conditions in the built environment. As has been discussed, however, a deeper analysis of these findings is warranted and will
IAQVEC
IOP Conf. Series: Materials Science and Engineering 609 (2019) 042028
IOP Publishing doi:10.1088/1757-899X/609/4/042028
6
continue in the future, particularly to investigate whether there are underlying primary causes for the correlations presented. The results will be used to inform a future sensor and survey measurement process of office spaces at the University of British Columbia, which will take place across 2019 and 2020.
Figure 4. WELL-adjusted relationship between PMV and thermal dissatisfaction p(D) Acknowledgements
The authors would like to thank the National Research Council of Canada (NRC) for making the Cost-effective Open-Plan Environment (COPE) field study dataset available for this research.
References
[1] De Dear R and Brager G 1998 ASHRAE Transactions 104 1–18
[2] Ferreira P, Ruano A, Silva S and Conceição E 2012 Energy and Buildings 55 238–251 [3] Vischer J 2008 Architecture Science Review 51 97-108
[4] Jensen K, Toftum J and Friis-Hansen, P 2009 44 456–462 [5] Int-Hout, D 2013 ASHRAE Journal 55 96
[6] Jamrozik A, Ramos C, Zhao J, Bernau J, Clements N, Vetting Wolf and Bauer B. 2018 Building
and Environment 130 190–199
[7] ASHRAE Standard 55 2013 Atlanta Thermal environmental conditions for human occupancy [8] Djongyang N, Tchinda R and Njomo D 2010 Renewable and Sustainable Energy Reviews 14
2626–2640
[9] The WELL Building Standard 2014
[10] Wagner A, Gossauer E, Moosmann C, Gropp T and Leonhart R 2007 Energy and Buildings 39 758–769
[11] Huang L, Zhu Y, Ouyang Q and Cao B 2012 Building and Environment 49 304–309 [12] Rupp R, Vásquez N and Lamberts R 2015 Energy and Buildings 105 178–205
[13] Al Horr Y, Arif M, Kaushik A, Mazroei A, Elsarrag E and Mishra S. 2017 International Journal
of Sustainable Built Environment 6 476–490
[14] Kamaruzzaman S, Egbu C, Zawawi E, Ali A and Che-Ani A 2011 Energy and Buildings 43 407–413.
[15] Langevin J, Wen J and Gurian P 2013 Building and Environment 69 206–226 [16] De Dear R 1998 ASHRAE Transactions 104
[17] Newsham G, Veitch J and Charles K 2008 Indoor Air 18 271–282