Geothermal potential assessment of the Nevado del Ruiz volcano based on rock thermal conductivity measurements and numerical modeling of heat transfer Maria Isabel Vélez, Daniela Blessent, Sebastián Córdoba, Jacqueline López-Sánchez, Jasmin Raymond, Eduardo Parra-Palacio
PII: S0895-9811(17)30178-5 DOI: 10.1016/j.jsames.2017.11.011 Reference: SAMES 1833
To appear in: Journal of South American Earth Sciences
Received Date: 27 April 2017 Revised Date: 10 November 2017 Accepted Date: 14 November 2017
Please cite this article as: Vélez, M.I., Blessent, D., Córdoba, Sebastiá., López-Sánchez, J., Raymond, J., Parra-Palacio, E., Geothermal potential assessment of the Nevado del Ruiz volcano based on rock thermal conductivity measurements and numerical modeling of heat transfer, Journal of South American Earth Sciences (2017), doi: 10.1016/j.jsames.2017.11.011.
This is a PDF file of an unedited manuscript that has been accepted for publication. As a service to our customers we are providing this early version of the manuscript. The manuscript will undergo copyediting, typesetting, and review of the resulting proof before it is published in its final form. Please note that during the production process errors may be discovered which could affect the content, and all legal disclaimers that apply to the journal pertain.
M
AN
US
CR
IP
T
AC
CE
PT
ED
1Geothermal potential assessment of the Nevado del Ruiz volcano based on rock thermal conductivity measurements and numerical modeling of heat transfer
Maria Isabel Véleza, Daniela Blessentb, Sebastián Córdobab, Jacqueline López-Sánchezb, Jasmin Raymonda, Eduardo Parra-Palaciob
a
Institut national de la recherche scientifique, Centre Eau Terre Environnement, Québec, Qc, Canada
b
M
AN
US
CR
IP
T
AC
CE
PT
ED
2 AbstractThis work presents an estimation of the geothermal potential of the Nevado del Ruiz (NDR) volcano, bridging the knowledge gap to develop geothermal energy in Colombia and improve resource estimates in South America. Field work, laboratory measurements, geological interpretations, 2D numerical modeling, and uncertainty analysis were conducted to the northwest of the NDR to assess temperature at depth and define thermal energy content. About 60 rock samples were collected at outcrops to measure thermal conductivity with a needle probe. A 2D numerical model, built from an inferred geological cross-section, was developed with the software OpenGeoSys to simulate the underground temperature distribution and then estimate the geothermal potential of a 1 km2 area with sufficient temperature, assuming a recovery factor equal to 2.4% and a 30 years exploitation time. Coupled groundwater flow and heat transfer were simulated in steady-state considering two different thermal conductivity scenarios. Results show that the average estimated potential is 1.5 x 10- 2 MWt m
-1
of the reservoir thickness, considering temperatures greater than 150 °C located at a depth of approximately 2 km, in a selected area situated outside of the Los Nevados National Natural Park (NNP), to avoid any direct intervention on this protected area. According to a Monte Carlo analysis considering pessimist and optimist scenarios of thermal conductivity, the estimated geothermal power was 1.54 x 10⁻² MW/m(σ = 2.91 x 10⁻³ MW/m)and 1.88 x 10⁻² MW/m(σ = 2.91 x 10⁻³ MW/m)for the two modeling scenario considered.
Keywords:
M
AN
US
CR
IP
T
AC
CE
PT
ED
3 1. Introduction 1Estimation of the worldwide geothermal potential is a challenging task, with pitfalls due to
2
uncertainties and knowledge gaps (Bertani, 2009). This worldwide potential is usually determined
3
by adding up the estimates for individual countries or regions, but the task is difficult, since the
4
geothermal energy potential is unknown in many countries (Stefánsson, 1998; Fridleifsson, 2003;
5
Stefánsson, 2005). This lack of information is particularly important for developing countries of
6
Latin America such as Colombia, where field data are sparse, if not non-existent. In the recent
7
report published by Bertani (2016), Colombia is indicated as a country where there is no geothermal
8
development yet and no additional information is provided. This situation is not unique to Colombia
9
but common to South America where untapped geothermal resources still need to be defined.
10
Recent studies on the estimation of the geothermal potential have been conducted in few countries
11
of South America, where there are no operating geothermal power plants. Aravena et al. (2016)
12
estimated the geothermal potential of high enthalpy geothermal areas of Chile to 659 MWe,
13
applying numerical methods and including inferred resources. Invernizzi et al. (2014) described a
14
preliminary assessment of the geothermal potential of Rosario de la Frontera area to the northwest
15
of Argentina, indicating 5.6x10¹⁸ J of heat stored in the rock and 0.8x10¹⁸ J in the geothermal fluids.
16
Ongoing exploration has taken place in Bolivia at the Laguna Colorado Field, while an estimation
17
of 150 MWe has been indicated for two geothermal fields in Peru (Bertani, 2016).
18
Such geothermal resource assessment depends on a variety of aspects that can be grouped as
19
follows: geological, physical, technological, and economical (Muffler and Cataldi, 1978). The
20
choice of a method for reservoir assessment depends on the available data, the purposes of the
21
assessment and the accuracy needed (Barylo, 2000). Muffler and Cataldi (1978) grouped the
22
methods for geothermal resource assessment in four categories: 1) surface heat flux method, 2)
23
volume method, 3) planar fracture method, and 4) magmatic budget method. The volumetric
24
method is commonly used for geothermal potential estimation at the early stage of geothermal
25
resource assessment. This method can be used when there are no or not enough exploratory wells
M
AN
US
CR
IP
T
AC
CE
PT
ED
4nor permeability data and is thus a preferred option for early stage assessment. A recovery factor is
27
considered by the volumetric method to calculate the static heat reserve in the reservoir and
28
estimates the extractable energy (Barylo, 2000). Stochastic simulations and risk analysis are
29
frequently used in conjunction with the volume method to estimate the range and the probable
30
distribution of stored heat reserves and exploitable energy. These analyses have been borrowed
31
from the oil industry, where they have been used for a long time to estimate probabilistic
32
hydrocarbon-in-place and oil and gas reserves in sedimentary basins (Ofwona, 2008). Such
33
stochastic simulations, commonly based on the Monte Carlo method, are particularly beneficial
34
where data is scanty and uncertainties high (Ofwona, 2008).
35
This work is an attempt to bridge the knowledge gap in Colombia and South America by describing
36
the geothermal potential assessment of an area of the Nevado del Ruiz (NDR) volcano located in
37
the Colombian Central Cordillera. Similar geological settings can be expected for geothermal fields
38
of the Colombian Central Cordillera, where the described method could be applied. The geothermal
39
resource assessment of the NDR volcano was actually based on 1) thermal conductivity laboratory
40
measurements on rock samples collected at outcrops, 2) an inferred geological cross-section, 3)
41
coupled groundwater flow and heat transfer numerical modeling with the OpenGeoSys software
42
(Böttcher et al., 2016), 4) volumetric resource estimation method, and 5) uncertainty analysis
43
conducted with the @RISK software (Ofwona, 2008; Walsh, 2013; Yang et al., 2015). The NDR
44
volcano is the best known geothermal area of Colombia, where the interest of several entities
45
converge (Alfaro, 2015). However, geothermal development in Colombia is incipient in comparison
46
with other Latin America countries with similar volcanic environments (Bertani, 2016). This case
47
study of the NDR area contributes to fill this lack of information and to help develop the geothermal
48
potential in Colombia.
49 50 51
M
AN
US
CR
IP
T
AC
CE
PT
ED
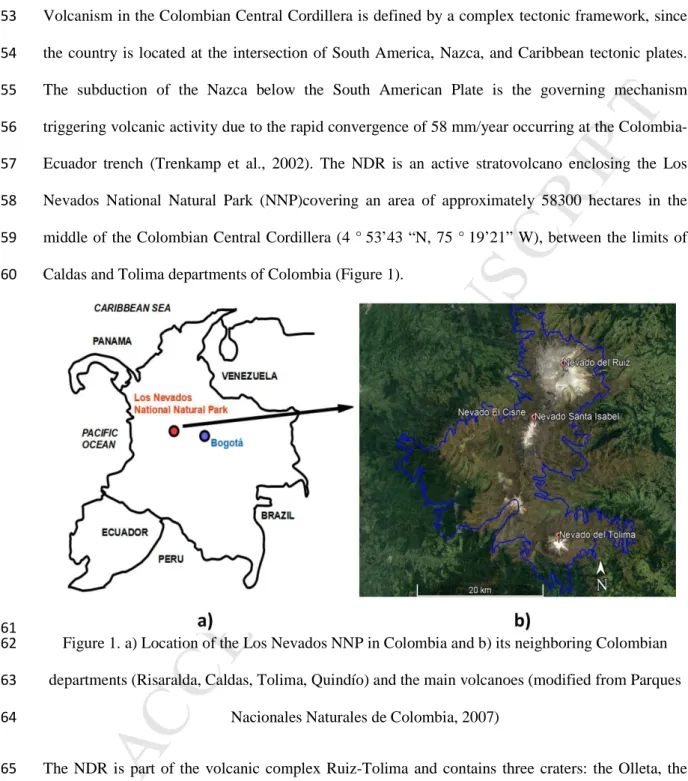
5 2. Geological settings 52Volcanism in the Colombian Central Cordillera is defined by a complex tectonic framework, since
53
the country is located at the intersection of South America, Nazca, and Caribbean tectonic plates.
54
The subduction of the Nazca below the South American Plate is the governing mechanism
55
triggering volcanic activity due to the rapid convergence of 58 mm/year occurring at the
Colombia-56
Ecuador trench (Trenkamp et al., 2002). The NDR is an active stratovolcano enclosing the Los
57
Nevados National Natural Park (NNP)covering an area of approximately 58300 hectares in the
58
middle of the Colombian Central Cordillera (4 ° 53’43 “N, 75 ° 19’21” W), between the limits of
59
Caldas and Tolima departments of Colombia (Figure 1).
60
61
Figure 1. a) Location of the Los Nevados NNP in Colombia and b) its neighboring Colombian
62
departments (Risaralda, Caldas, Tolima, Quindío) and the main volcanoes (modified from Parques
63
Nacionales Naturales de Colombia, 2007)
64
The NDR is part of the volcanic complex Ruiz-Tolima and contains three craters: the Olleta, the
65
Piraña, and the Arenas. The Arenas crater has been the source of the most recent activity: an
66
explosive eruption occurred in November 1985 (Naranjo et al., 1986), while variations in the
M
AN
US
CR
IP
T
AC
CE
PT
ED
6volcanic activity and ash emissions have been registered since October 2010 until these days1.
68
Based on seismicity, geochemistry and geology of the volcano, Londoño and Sudo (2002) presented
69
a conceptual model of its activity, identifying three heat sources located at different depths: the first
70
one from 2 to 3 km, the second one from 5 to 10 km, and the deepest zone from 10 to 15 km. Stix et
71
al. (2003) presented a conceptual view of magma ascent through a plexus of cracks in the crust,
72
from the source main reservoir located at depth comprised between 9 and 15 km.
73
The geological situation of the Ruiz region is featured by several Tertiary and Quaternary volcanic
74
edifices and by a number of thermal springs. The reconstruction of the stratigraphic sequences is
75
difficult because the oldest metamorphic and sedimentary rocks located at the base of the volcanic
76
complex are often crossed or covered by igneous rocks that obliterate contacts (Arango et al., 1970).
77
Among all geological units described by González (2001), those that are identified in the inferred
78
geological cross-section described later, are the Cajamarca metamorphic complex (Pes), the
79
Quebradagrande Complex (Kvc and Ksc), the Andesite unit (NgQa), pyroclastic rocks (Qto), glacial
80
deposits (Qg), volcanic mud flows or lahars (Qfl), and recent alluvial deposits (Qar). The
81
Cajamarca metamorphic complex, which makes up the regional basement of the Colombian Andes,
82
encloses a wide range of lithological types. The pelitic complex (Pes) includes phyllites, sericite,
83
and mica schists. There is evidence that this complex has undergone a greenschists facies
84
metamorphism, while, locally, some rocks belonging to the amphibolites facies can be observed.
85
The Quebradagrande Complex is composed of sedimentary rocks (Ksc), such as black shales,
86
sandstones, conglomerates, limestones, with dynamic metamorphism and occasionally fossils.
87
Volcanic rocks (Kvc), such as basalts, pyroclastic flows and diabasic dykes, have undergone
88
prehnite-pumpellyite facies metamorphism. The Andesite unit (NgQa) has a composition ranging
89
from andesitic to dacitic, and basaltic at fewer locations. The andesitic flows are macroscopically
90
homogenous and have a porphyritic texture. The lahars or volcanic mud flows (Qfl) include blocks
91
of andesitic-dacitic lava with variable diameter from few centimeters to more than 5 m. The
92
1
M
AN
US
CR
IP
T
AC
CE
PT
ED
7pyroclastic rocks (Qto) may reach a thickness of 30 m. The recent alluvial deposits (Qar) cover
93
older rocks close to rivers and creeks and have a variable thickness, which is generally less than
94
20 m. The glacial deposits (Qg) are associated to the Pleistocene glaciations that covered the
95
Colombian Central Cordillera above 3000 m a.s.l.
96 97
3. Previous studies on the Nevado del Ruiz geothermal resources
98
The first geothermal study on the Nevado del Ruiz site was conducted towards the end of the 1960s
99
by the Italian company ENEL (Ente Nazionale per la Energia Elettrica) in collaboration with the
100
CHEC (Central Hidroeléctrica de Caldas) and described litho-stratigraphic features, volcanology,
101
structural events and hydrogeology of the NDR complex (Arango et al., 1970). Based on isotopic
102
analysis, Arango et al. (1970) proposed a first tentative hypothesis of a shallow hydrothermal
103
system clearly separated from a deep regional system. They identified the presence of a thick
104
caprock, formed by the upper part of the metamorphic complex and separating the two major
105
circulation-systems to the west, northwest and north of the Ruiz edifice. CHEC subsequently
106
published a technical report describing the geological context of the NDR with details about the
107
volcanology, geochemistry and geophysical characteristics of the area (CHEC et al., 1983). Two
108
years after, the NDR volcano erupted during November 1985 (Melson et al., 1990; Thouret, 1990;
109
Vatin-Pérignon et al., 1990), causing the Armero tragedy with about 25 000 casualties and leaving
110
aside the geothermal explorations.
111
Field work restarted only in 1997 when the only deep geothermal exploration well in Colombia
112
(Las Nereidas well) was drilled to a depth of 1466 m on the western side of the NDR, at 3450 m
113
a.s.l.. In this borehole, seven lithological units with hydrothermal alteration were identified. The
114
measured bottom hole temperature was about 200 °C (Monsalve et al., 1998). Recent studies were
115
conducted from 2011 to 2013: Rayo-Rocha and Zuluaga (2011) indicated, through petrographic and
116
geochemical analysis of lava samples, the existence of a deep magmatic chamber feeding a
117
shallower chamber. Rojas (2012) presented the temperature profiles measured in three 300 m deep
M
AN
US
CR
IP
T
AC
CE
PT
ED
8wells that were drilled in 2011 with the objective to measure the geothermal gradient. Forero (2012)
119
provided a characterization of hydrothermal alteration to the northwest of the volcano that led to a
120
simple conceptual model of the geothermal reservoir. Almaguer (2013) presented the results from a
121
magnetotelluric study conducted to the North of the volcano, where high electrical conductivity
122
areas confined by sections of moderated resistivity were interpreted as a possible reservoir and
123
caprock, respectively. After this renewed interested, the Colombian ISAGEN company then applied
124
for an environmental license following the realization of the environmental impact study to drill the
125
first of five planned exploratory wells on the western flank of the NDR volcano (Alfaro, 2015).
126
González-Garcia and Jessell (2016) published a first 3D geological model for the Ruiz-Tolima
127
volcanic massif, using the Monte Carlo method to characterize geological uncertainty. Their model
128
represents the probability of occurrence of geological units, suggesting where future exploratory
129
work should be conducted.
130 131
4. Material and methods
132
4.1 Rock sampling and geological cross-section
133
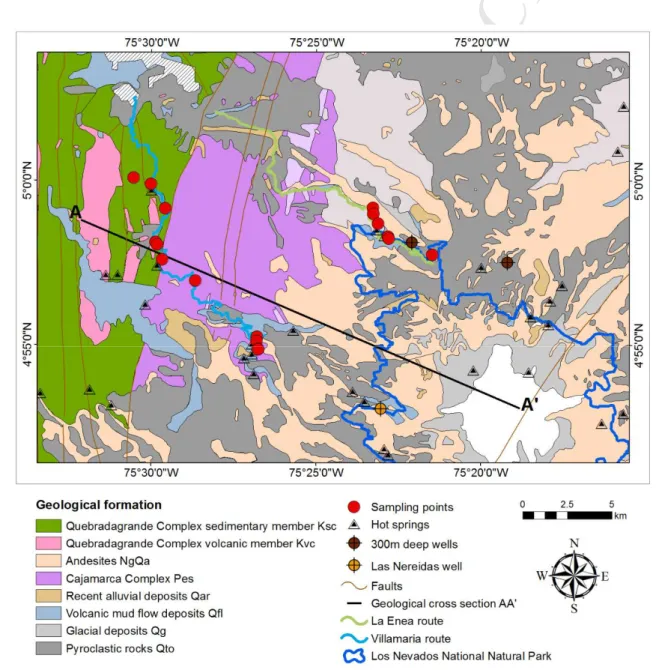
Field work was conducted in November 2014 over two itineraries with an approximate length of
134
26 km (Villamaria and Enea route) outside of the Los Nevados NNP (Figure 2). The objective of
135
rock sampling was to collect the main lithologies characterizing the study area. Three rock samples
136
were collected at each sampling locations (Table 1). The geological cross-section AA’ (Figure 2)
137
starts from the NDR peak (A’) and goes up to the outcrops of the Quebradagrande Complex (Ksc
138
and Kvc), located on the northwest of the NDR peak. The cross-section is drawn close to the
139
sampling points and hot springs located along the Villamaria route and crosses the Cajamarca
140
Complex (Pes), which is one of the lithologies of most interest, because this metamorphic complex
141
might be part of a potential geothermal reservoir (Almaguer, 2013), together with the
142
Quebradagrande Complex (CHEC, 1983). Although this hydrothermal system has been studied
143
since the seventies, the location of a porous reservoir is not publicly known, but it is suggested that
M
AN
US
CR
IP
T
AC
CE
PT
ED
9faults provide structural control of the hydrothermal flow (González-Garcia et al., 2015).
145
Geological observations indicate that the primary porosity of potential reservoir units is low and the
146
potential to find natural hydrothermal systems is related to secondary porosity. However, faults
147
were not considered in this work since the objective is to provide a quantitative methodology to
148
estimate the geothermal resource potential based on heat stored in the basement rock. Fault zones
149
shall be considered in further studies as structural geology information becomes available together
150
with 3D geological models to provide a more accurate estimation of this geothermal potential.
151 152
153
Figure 2. Geological map of the study area showing the sampled outcrops. Simplified from
M
AN
US
CR
IP
T
AC
CE
PT
ED
10INGEOMINAS geological maps sheet Nos. 206 and 225 (Mosquera et al., 1998a; Mosquera et al.,
155
1998b).
156
4.2 Thermal conductivity measurements
157
Thermal conductivity measurements were made at the Institut national de la recherche scientifique
158
Centre Eau Terre Environnement (INRS-ETE) in Québec City (Canada), following the ASTM
159
methodology (ASTM, 2008). Thermal conductivity was measured inserting the KD2 Pro transient
160
needle probe RK- 1 (Decagon Devices Inc., 2008) in a 3.9 mm diameter hole previously drilled in
161
each rock sample that has been previously saturated when having visible porosity. The hole,
162
approximately 6 cm deep, was drilled with a rotary hammer in the middle of a flat side of each rock
163
sample, to ensure uniform heat transfer in every direction in the sample during the measurement.
164
The space between the needle and the hole was filled with thermal grease to ensure thermal contact.
165
The heating needle had a temperature sensor. Heat was injected through the needle for 5 minutes,
166
while temperature was monitored, and a 5 minutes recovery period was considered after the heating
167
pulse. The thermal conductivity was determined from the analysis of the temperature increment ∆T,
168
which depends on the distance r from the source and on the time t, according to the infinite line
169
source equation (Carslaw and Jaeger, 1947):
170 2 ( , ) 4 i 4 q r T r t E t πλ α − − ∆ = (1) 171
where q (W m-1) is the heat input per unit length, α (m2 s-1) is the thermal diffusivity, r (m) is the
172
needle radius, Ei is the exponential integral that can be developed as a Taylor series, λ (W m -1
K-1) is
173
the thermal conductivity of the rock sample, and t (s) is the time. From Eq. 1, the temperature can
174
be approximated to a linear equation in a semi-logarithmic plot, where the slope is related to the
175 thermal conductivity λ: 176
( )
ln( ) 4 q T t t C πλ ≈ + (2) 177M
AN
US
CR
IP
T
AC
CE
PT
ED
11Thermal conductivity measurements were performed automatically at time intervals of 1 hour to
178
ensure that temperature returned to the equilibrium before doing a new measurement. Before and
179
after each measurement, calibration was required to determine the correction factor CF (Eq. 3),
180
which compares the thermal conductivity of a known material (λmaterial), a standard plastic cylinder 181
supplied with the KD2 Pro thermal properties analyzer, with the one obtained experimentally
182
(λmeasured), to adjust the measured thermal conductivity (ASTM, 2008): 183 material measured CF λ λ = (3) 184
4.3 Heat capacity estimation
185
Heat capacity was estimated according to the mesoscopic characterization of each rock sample
186
based on the values provided by Waples and Waples (2004). Although approximate, this estimation
187
is suitable since heat capacity does not show large variation within different rock types. The great
188
majority of the specific heat capacities of minerals at ±20 °C is between 600 to 900 (J kg-1 K-1), with
189
a strong preference for values between 800 and 900 (J kg-1 K-1).
190 191
4.4 Numerical modeling
192
To provide an estimation of the geothermal potential for the study area, numerical modeling was
193
performed, since analytical methods can difficultly cope with irregular topography. It has long been
194
recognized that topography affects heat flow and topographic correction has been based on
195
identification of valleys and hills (Westaway and Younger, 2013). Nevertheless, the topography of
196
the geological cross-section AA’ has a saw-tooth like profile (Figure 3) rather than a valley or a hill.
197
Therefore, numerical modeling allowed considering almost the real topography in the simulated
198
domain. The software OpenGeoSys (OGS), a scientific open-source initiative for numerical
199
simulation of thermo-hydro-mechanical/chemical processes in porous and fractured media
200
(Böttcher et al., 2016), was used to build a numerical model to estimate underground temperature
201
and quantify geothermal resources. The GMSH mesh generator (Geuzaine and Remacle, 2009) and
M
AN
US
CR
IP
T
AC
CE
PT
ED
12the Tecplot software were used to build the mesh and to visualize the numerical results,
203
respectively. Fully saturated steady-state groundwater flow and heat transfer were the physical
204
processes considered. Governing equations and specifications for modeling of geothermal processes
205
were presented in detail by Böttcher et al. (2016) and therefore are not repeated here.
206 207
4.5 Geothermal resources evaluation
208
The quantification of geothermal resources was achieved for an area characterized by a temperature
209
greater than 150 °C located outside of the Los Nevados NNP, at a depth between 2 and 3 km, and at
210
a distance of 14 to 15 km from the left-hand side of the geological cross-section AA’ (Figure 3). An
211
area of 1 km2 was considered for the estimation of the geothermal potential, since the reservoir
212
spatial delimitation is currently uncertain and needs further field investigations, such as geophysical
213
surveys, to better identify permeable formations. Both temperature (150 °C) and depth (3 km) are
214
the recommended values based on economic feasibility of geothermal exploration in Colombia
215
(Bernal et al., 2000). The temperature of 150 °C can also be used to define high enthalpy systems
216
according to Lee (1996).
217
Subsurface heat stored was evaluated in the zone of interest (Figure 3) with the following equation:
218 0 (T T ) r d Q= ⋅ ⋅ ⋅ −ρ C A (4) 219 where Qr (J m -1
) is the available subsurface heat per unit width of the reservoir, ρ (Kg m-3) is the
220
rock density, C (J Kg-1 K-1) is the rock heat capacity, A (m2) is the area surrounding each selected
221
point in the zone of interest, Td (K) is the temperature at depth in the zone of interest and T0 (K) is 222
the temperature at the surface. Eq. (5) gives the total accumulated heat stored in the subsurface, but
223
only a part of this quantity can be actually extracted. Therefore, the geothermal potential was
224
estimated considering a recovery factor R, which is related to the available and exploitable energy
225
(Calcagno et al., 2014) and depends on the porosity and on the permeability of the lithological
226
formations of the geothermal reservoir (Walsh, 2013). The geothermal potential PG (W) was finally 227
calculated considering resource exploitation for a time t equals to 30 years:
M
AN
US
CR
IP
T
AC
CE
PT
ED
13 r G Q P R t = ⋅ (5) 229In this case study, the geothermal potential was calculated using a recovery factor R = 2.4%, which
230
was reported by Calcagno et al. (2014) as the minimum recovery factor for fractured aquifers, as the
231
potential NDR reservoir is hosted in low permeability basement rocks crossed by regional faults.
232
Faults are expected to have an impact on the circulation of hydrothermal fluids in the NDR
233
geothermal reservoir (Mejía et al., 2012). Further studies will consider the effect of faults, which do
234
not cross the zone of interest selected in this work based on outcrops visited during field work.
235
Conductive and advective heat transfer through the low-permeability rock matrix are the main
236
processes considered in this study to provide a first estimate of the heat content in order to calculate
237
geothermal resources.
238
Uncertainty analysis was conducted with Monte Carlo simulations using the @RISK software. The
239
variables considered for uncertainty analysis were the temperature at depth Td and the recovery 240
factor R. Td depends on the thermal conductivity and on the heat flow according to steady-state heat 241
transfer that is conduction dominated in the numerical model.
242 243 5 Results 244 5.1 Laboratory measurements 245
The lithologic units identified at the 18 sampling locations (Table 1) were the Quebradagrande
246
sedimentary Complex (Ksc), the Cajamarca Complex (Pes), the Andesite unit (NgQa) and the
247
volcanic mud flow or lahars (Qfl). The Quebradagrande volcanic complex (Kvc) was not collected
248
in the field since the access route did not lead to its outcrop (Figure 2).
249
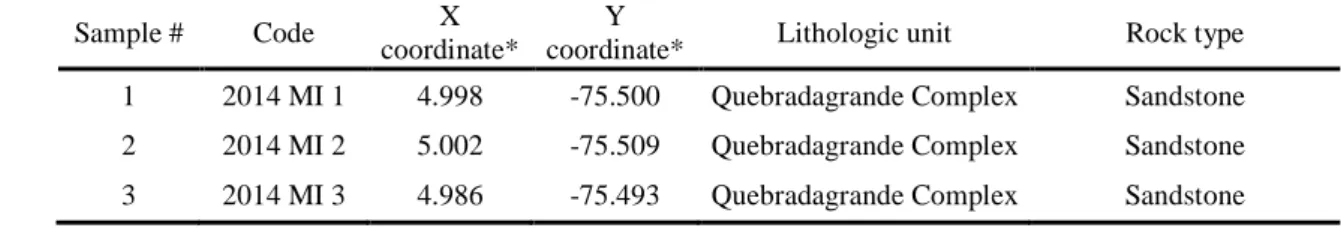
Table 1: Sampling points coordinates and mesoscopic characterization
250
Sample # Code X
coordinate*
Y
coordinate* Lithologic unit Rock type
1 2014 MI 1 4.998 -75.500 Quebradagrande Complex Sandstone
2 2014 MI 2 5.002 -75.509 Quebradagrande Complex Sandstone
M
AN
US
CR
IP
T
AC
CE
PT
ED
144 2014 MI 4 4.969 -75.498 Quebradagrande Complex Schist
5 2014 MI 5 4.968 -75.497 Quebradagrande Complex Schist
6 2014 MI 6 4.968 -75.497 Cajamarca Complex Quartz phyllite
7 2014 MI 7 4.960 -75.495 Cajamarca Complex Schist
8 2014 MI 8 4.986 -75.388 Andesite unit Andesitic lava flows
9 2014 MI 12 4.972 -75.380 Andesite unit Andesite
10 2014 MI 13 4.972 -75.380 Andesite unit Andesite
11 2014 MI 14 4.972 -75.380 Volcanic mud flow Volcanic mud flows
deposits
12 2014 MI 15 4.971 -75.380 Volcanic mud flow Volcanic mud flows
deposits
13 2014 MI 16 4.963 -75.358 Andesite unit Andesite
14 2014 MI 17 4.949 -75.478 Cajamarca Complex Quartz phyllite
15 2014 MI 18 4.921 -75.446 Andesite unit Andesite
16 2014 MI 19 4.919 -75.447 Andesite unit Andesite
17 2014 MI 20 4.915 -75.446 Cajamarca Complex Schist
18 2014 MI 21 4.915 -75.446 Cajamarca Complex Schist
* WGS84 coordinate system 251
252
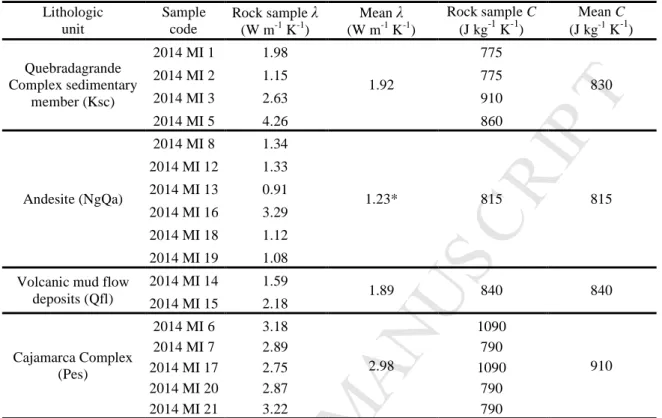
The thermal conductivity and the specific heat capacity (Table 2) associated to each lithology were
253
calculated as the mean of the values obtained for all the samples belonging to the same unit, except
254
for the thermal conductivity of the Andesite (NgQa). The thermal conductivity of sample 2014
255
MI 16 was higher than the other samples taken at the same location and the mean would be
256
significantly affected by this extreme value. Then, the median was used because it was considered
257
to better represent the thermal conductivity of this lithologic unit. Sample 5 of the Quebradagrande
258
Complex (λ = 4.26 W m-1 K-1) was further excluded from the determination of the mean thermal
259
conductivity because it was taken in a fault zone that did not represent the general characteristics of
260
this geological complex.
261
The thermal conductivity values obtained for the Quebradagrande Complex and volcanic mudslides
262
did not show significant variation since most of the values were close to 2.0 W m-1 K-1. The
263
Andesite unit showed the lowest thermal conductivity value (1.2 W m-1 K-1), while the Cajamarca
264
Complex showed the highest value (2.9 W m-1 K-1). Inferred heat capacity ranges from 815 to
265
1140 J Kg-1 K-1.
M
AN
US
CR
IP
T
AC
CE
PT
ED
15Table 2: Measured thermal conductivity λ and heat capacity C estimated from Waples and Waples
267
(2004)
268
*Thermal conductivity of the andesite unit was calculated as the median of the sample values. 269
270
5.2 Geological cross-section
271
The thickness of the lithologic units in the geological cross-section AA’ was based on a previous
272
cross-section of the NDR volcano published by Central Hidroelectrica de Caldas (CHEC et al.,
273
1983). Outcrops of the Quebradagrande and Cajamarca complexes are shown on this inferred
274
geological cross-section (Figure 3). The Andesite unit is approximately 500 m thick (CHEC et al.,
275
1983) and lies above the Cajamarca Complex. It is possible to see the different superficial deposits
276
(Qto, Qar, Qg, Qfl) produced by the volcanic activity during the Quaternary period. The two
277
members of the Quebradagrande Complex (Ksc y Kvc) are located on the west end of the
cross-278
section and are dipping to the East.
279 280 Lithologic unit Sample code Rock sample λ (W m-1 K-1) Mean λ (W m-1 K-1) Rock sample C (J kg-1 K-1) Mean C (J kg-1 K-1) Quebradagrande Complex sedimentary member (Ksc) 2014 MI 1 1.98 1.92 775 830 2014 MI 2 1.15 775 2014 MI 3 2.63 910 2014 MI 5 4.26 860 Andesite (NgQa) 2014 MI 8 1.34 1.23* 815 815 2014 MI 12 1.33 2014 MI 13 0.91 2014 MI 16 3.29 2014 MI 18 1.12 2014 MI 19 1.08
Volcanic mud flow deposits (Qfl) 2014 MI 14 1.59 1.89 840 840 2014 MI 15 2.18 Cajamarca Complex (Pes) 2014 MI 6 3.18 2.98 1090 910 2014 MI 7 2.89 790 2014 MI 17 2.75 1090 2014 MI 20 2.87 790 2014 MI 21 3.22 790
M
AN
US
CR
IP
T
AC
CE
PT
ED
16 281Figure 3. Inferred geological cross-section AA’ and thermal properties evaluated for lithological
282
units Pes, NgQa, Qfl, Ksc. Geological map simplified from INGEOMINAS geological maps sheet
283
Nos. 206 and 225 (Mosquera et al., 1998a; Mosquera et al., 1998b).
284
285
5.3 Underground temperature model
286
The simulated domain was based on the inferred geological cross-section AA’ (Figure 3), where
287
superficial geological deposits (Qar, Qfl, Qg, and Qto) were neglected, since their thickness was
288
small enough to have a negligible influence on the underground temperature (Figure 4) due to their
289
limited spatial extent. The zone of interest to quantify geothermal resources was delimited
290
considering temperatures > 150°C and depth < 3 km, although groundwater flow and heat transfer
291
was simulated over the whole cross section.
292
The triangular mesh built with GMSH has 4179 elements, which were refined close to the top of the
293
domain to properly capture the topographic variations. Groundwater flow boundary conditions were
M
AN
US
CR
IP
T
AC
CE
PT
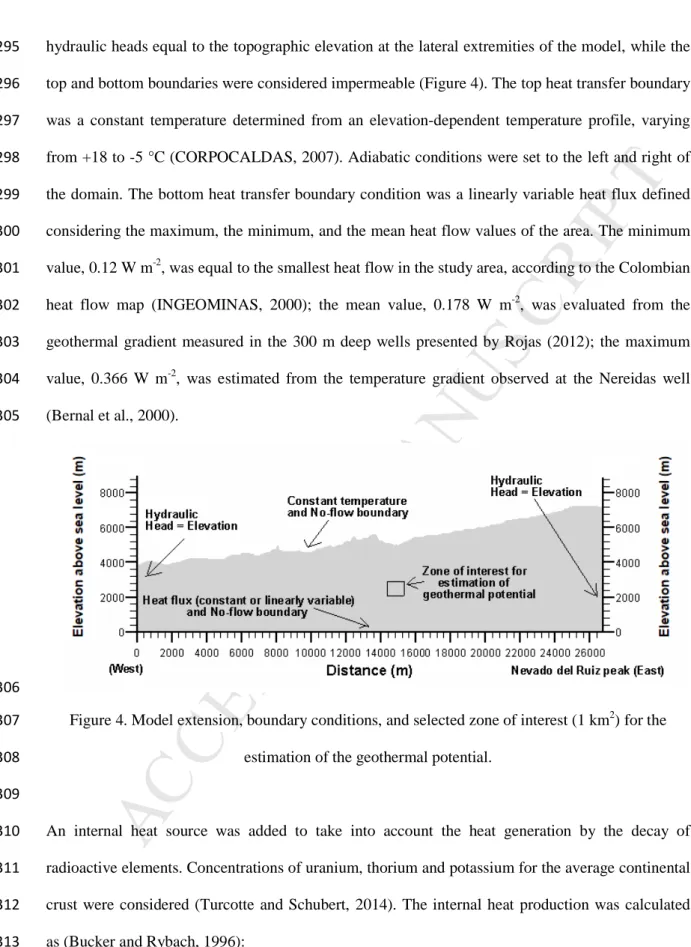
ED
17hydraulic heads equal to the topographic elevation at the lateral extremities of the model, while the
295
top and bottom boundaries were considered impermeable (Figure 4). The top heat transfer boundary
296
was a constant temperature determined from an elevation-dependent temperature profile, varying
297
from +18 to -5 °C (CORPOCALDAS, 2007). Adiabatic conditions were set to the left and right of
298
the domain. The bottom heat transfer boundary condition was a linearly variable heat flux defined
299
considering the maximum, the minimum, and the mean heat flow values of the area. The minimum
300
value, 0.12 W m-2, was equal to the smallest heat flow in the study area, according to the Colombian
301
heat flow map (INGEOMINAS, 2000); the mean value, 0.178 W m-2, was evaluated from the
302
geothermal gradient measured in the 300 m deep wells presented by Rojas (2012); the maximum
303
value, 0.366 W m-2, was estimated from the temperature gradient observed at the Nereidas well
304
(Bernal et al., 2000).
305
306
Figure 4. Model extension, boundary conditions, and selected zone of interest (1 km2) for the
307
estimation of the geothermal potential.
308 309
An internal heat source was added to take into account the heat generation by the decay of
310
radioactive elements. Concentrations of uranium, thorium and potassium for the average continental
311
crust were considered (Turcotte and Schubert, 2014). The internal heat production was calculated
312
as (Bucker and Rybach, 1996):
M
AN
US
CR
IP
T
AC
CE
PT
ED
18 A = 10-5 ·ρ· (9.52[U] + 2.56[Th] +3.48 [K]) (6) 314where A (µW m-3) is the internal heat production, ρ (kg m-3) is the average rock density, [U] (ppm)
315
is the concentration of uranium, [Th] (ppm) is the concentration of thorium, [K] (%) is the
316
concentration of potassium. The value calculated for the average continental crust was 0.866 µWm
-317 3
, which was comprised within the range of common values for this parameter (Bédard et al., 2016).
318
A sensitivity analysis was conducted to define proper values for domain depth and mesh size. The
319
domain depth has an impact because the heat transfer under the simulated conditions is dominantly
320
vertical and affected by the irregular topography. For example, if the depth is lower, the heat source
321
is closer to the surface, affecting the simulated temperature and the final geothermal potential
322
estimation. The domain depth was defined on the right-hand side of the cross-section, where is
323
located the NDR peak (Figure 3). Depths of 3, 5, 7, 10, 12, 14, and 18 km were considered in the
324
sensitivity analysis. Mesh resolution was varied from 200 m to 600 m; since mesh is always
325
automatically refined close to the topography, these resolutions represent the average element size.
326
The criterion to choose the appropriate values was based on the variation of the simulated
327
temperature between two successive simulation results with varying depth or mesh resolution. The
328
final depth and mesh resolution were chosen when the minimum temperature variation was
329
observed between simulations. The selected model was 7 km deep and had an average mesh
330
element size of 400 m.
331
The thermal properties of the main geological units inferred from the field characterization and
332
hydraulic properties estimated according to Freeze and Cherry (1979) were used as inputs for the
333
numerical simulations (Table 4). Since samples were not available for the Kvc volcanic complex,
334
values equal to those of Ksc were assumed. The Kvc formation is, however, located on the left-hand
335
side of the geological cross-section and was believed to have a small effect on the simulated
336
temperature in the area of interest, which is located approximately 14 km away (Figure 4). This was
337
in fact verified by additional simulations whose results are not presented here.
338 339
M
AN
US
CR
IP
T
AC
CE
PT
ED
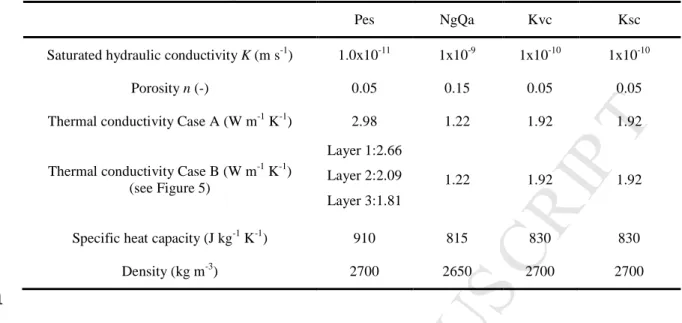
19Table 4. Properties of material used for numerical simulations
340
Pes NgQa Kvc Ksc
Saturated hydraulic conductivity K (m s-1) 1.0x10⁻¹¹ 1x10⁻⁹ 1x10⁻¹⁰ 1x10⁻¹⁰
Porosity n (-) 0.05 0.15 0.05 0.05
Thermal conductivity Case A (W m-1 K-1) 2.98 1.22 1.92 1.92
Thermal conductivity Case B (W m-1 K-1)
(see Figure 5)
Layer 1:2.66 Layer 2:2.09 Layer 3:1.81
1.22 1.92 1.92
Specific heat capacity (J kg-1 K-1) 910 815 830 830
Density (kg m-3) 2700 2650 2700 2700
341
Two modeling scenarios were considered (Table 5) to compare a case characterized by constant
342
thermal conductivity in the Cajamarca Complex Pes (Case A), with another case characterized by a
343
temperature dependent thermal conductivity (Case B). Three sub-layers were defined in the
344
Cajamarca Complex for Case B (Figure 5), based on the temperature dependent thermal
345
conductivity calculated with the relation proposed by Clauser (2014):
346 0 800 (7) 350 B A C T C T λ= + ° ≤ ≤ ° + 347
where A (W m-1K-1) = 0.75 and B (W m-1) = 705 for metamorphic rocks.
348
Eq.(7) was applied to the simulated temperatures from Case A to define three regions with different
349
thermal conductivity in the metamorphic Cajamarca Complex, since a temperature dependent
350
thermal conductivity was not available in OpenGeoSys. This approach allowed investigating the
351
effect of temperature on thermal conductivity, although it is approximate.
M
AN
US
CR
IP
T
AC
CE
PT
ED
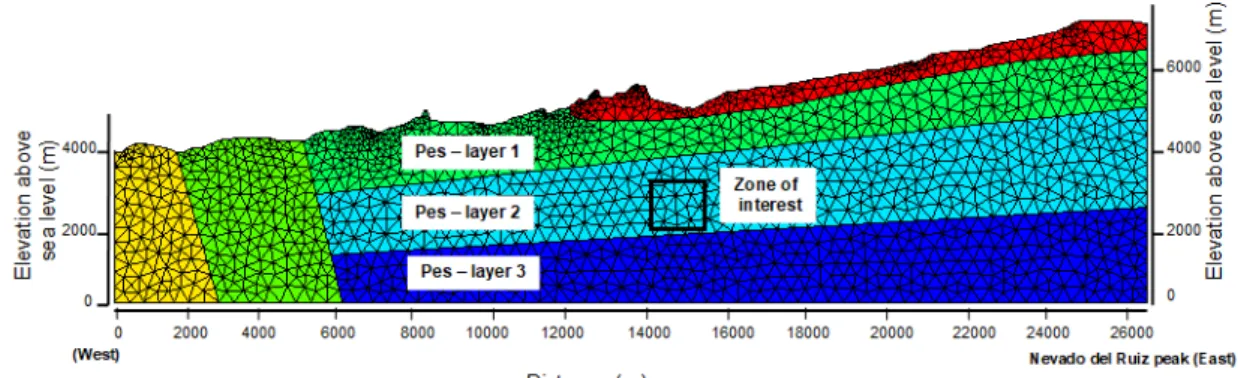
20 353Figure 5. Triangular mesh and sub-layers 1, 2, and 3 in the Cajamarca metamorphic complex (Pes)
354
close to the zone of interest, for simulation scenario Case B.
355
356
Table 5. Modeling scenarios considered
357
Scenario Description
Case A Constant thermal conductivity for the Cajamarca Complex (Pes)
Case B Temperature dependent thermal conductivity for the Cajamarca Complex (Pes)
358 359
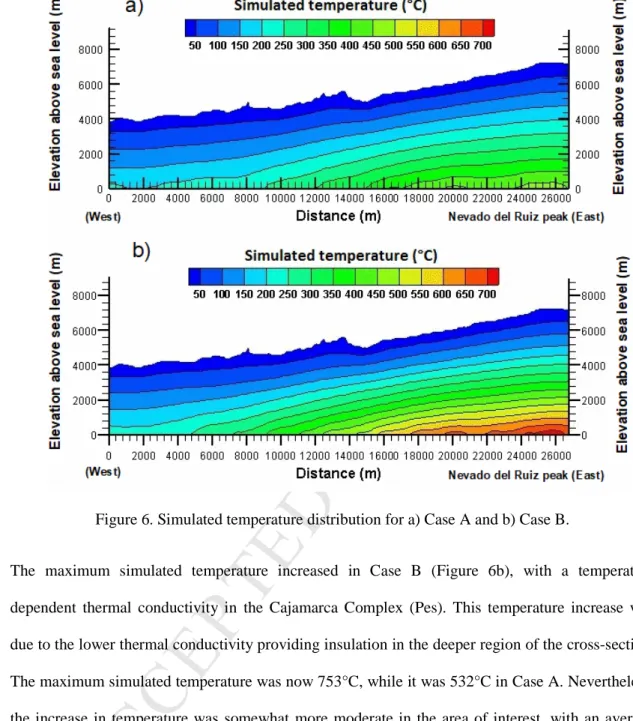
The maximum temperature simulated for Case A was 532 °C at the bottom right-hand side of the
360
profile, where the largest heat flux (0.366 W m-2) was applied as a bottom boundary condition
361
(Figure 6a). The temperature was greater than 150°C in the area of interest at a distance of 14–15
362
km and at a depth of 2-3 km, indicating that high-enthalpy geothermal resources (Lee, 1996) are
363
located outside of the Los Nevados NNP, where they may be exploited.
M
AN
US
CR
IP
T
AC
CE
PT
ED
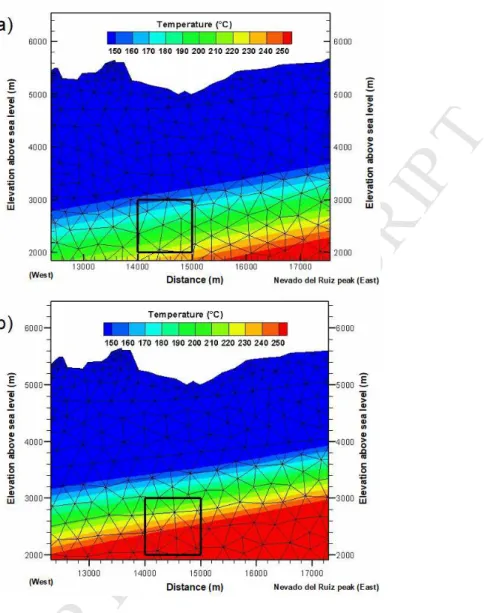
21 365Figure 6. Simulated temperature distribution for a) Case A and b) Case B.
366
The maximum simulated temperature increased in Case B (Figure 6b), with a temperature
367
dependent thermal conductivity in the Cajamarca Complex (Pes). This temperature increase was
368
due to the lower thermal conductivity providing insulation in the deeper region of the cross-section.
369
The maximum simulated temperature was now 753°C, while it was 532°C in Case A. Nevertheless,
370
the increase in temperature was somewhat more moderate in the area of interest, with an average
371
increase of 45°C. Simulated temperatures were now greater than 200°C in almost all the area of
372
interest. This scenario was considered as more realistic, since it takes into account the decreasing of
373
thermal conductivity with temperature, although still approximate.
M
AN
US
CR
IP
T
AC
CE
PT
ED
22The influence of the internal heat production due to the radioactive decay appeared not be
375
significant since a small value of internal heat generation was calculated (0.866 µW m-3), compared
376
to the heat flux applied to the bottom boundary (mean value of 0.2 W m-3).
377 378
5.4 Geothermal resource evaluation
379
In order to quantify the influence of the temperature at depth Td and the recovery factor R on the 380
geothermal resources evaluation, Case A and Case B were considered. The simulated temperatures
381
in the area of interest for simulation scenarios Case A and Case B are shown in Figure 7, where the
382
triangular mesh is also illustrated. Using Eq.(4), the available subsurface heat QR was estimated, 383
exporting the simulated temperature at points uniformly distributed over the area of interest along
384
five 1000 m high vertical segments (from a depth of 2000 m to 3000 m) located 200 m apart. Since
385
each segment had 10 points along its height, the area A associated with each point is 22,000 m2
386
(200 m x 110 m): the density and heat capacity of the Cajamarca Complex (Table 4) were
387
considered to calculate with Eq.(5) the geothermal potential PG for a 30 y exploitation period with 388
R=2.4% as recovery factor (Table 6). The geothermal potential was larger for Case B, since higher
389
temperatures were obtained using a temperature dependent thermal conductivity, for the same heat
390
flux bottom boundary condition. Nevertheless, both geothermal power resources were on the same
391
order of magnitude (1.36 x 10⁻² and 1.67 x 10⁻² MWt m -1
).
M
AN
US
CR
IP
T
AC
CE
PT
ED
23 393Figure 7. Simulated temperatures and triangular mesh in the zone of interest for a) Case A and b)
394
for Case B
395
396
Table 6. Geothermal resource evaluation per km2 of potential reservoir section
397 Scenario QR Total energy (J m-1) (Eq.4) PG Geothermal power (MWt m-1) (Eq.5) Case A 5.38 x 10¹⁴ 1.36 x 10⁻² Case B 6.60 x 10¹⁴ 1.67 x 10⁻² 398
M
AN
US
CR
IP
T
AC
CE
PT
ED
24 5.5 Uncertainty analysis 399Uncertainty analysis of the geothermal potential was conducted for the area of interest (Figure 4),
400
using the temperature variation ∆T and the recovery factor R as input variables with 10000 Monte
401
Carlo iterations. Uniform distributions were used to define the variation of the parameters.
402
Recovery factor varied from 2.4% to 3% and the temperature variation from 160.5 °C to 235°C.
403
The temperature intervals between 156 °C and 239 °C and between 183°C and 301°C were obtained
404
for the two scenarios, Case A and Case B, respectively. The mean thermal energy for Case A,
405
considering homogenous thermal conductivity in the Cajamarca Complex, was 1.54 × 10⁻² MWt m-1 406
with a standard deviation of 2.1 × 10⁻³ MWt m-1 (Figure 8). The minimum and maximum values 407
were 1.08 × 10⁻² MWt m-1 and 2.06 x 10⁻² MWt m-1, respectively. For an approximate reservoir 408
width of 5 km, the mean estimated geothermal potential was 77 MWt, while the minimum and 409
maximum values were 54 MWt and 103 MWt. This reservoir width corresponds to the average 410
outcrop width of the Cajamarca Complex, as it can be observed in the geological map (Figure 2).
411
The mean thermal energy for Case B, considering temperature dependent thermal conductivity in
412
the Cajamarca Complex, was 1.88 × 10⁻² MWt m -1
with a standard deviation of 2.91 × 10⁻³ MWt m -413
1
. The minimum and maximum values were 1.28 × 10⁻² MWt m -1
and 2.59 × 10⁻² MWt m -1
,
414
respectively (Figure 8). Considering the same reservoir width of 5 km, the mean estimated
415
geothermal potential was now 94 MWt, while the minimum and maximum values were 64 MWt and 416
130 MWt, respectively. 417
M
AN
US
CR
IP
T
AC
CE
PT
ED
25 418 419Figure 8. Geothermal power uncertainty analysis conducted with RISK.
420 421
6 Discussion
422
This paper presented an estimation of the geothermal potential of an area of approximately 1 km2 to
423
the northwest of the Nevado Del Ruiz (NDR) volcano (Colombia). The work consisted in collecting
424
rock samples in surface outcrops, measuring thermal conductivity of the rock samples with a needle
425
probe in the laboratory, estimating heat capacity based on mesoscopic description of rock type,
426
inferring a geological cross-section, simulating temperature at depth with numerical modeling of
427
steady-state groundwater flow and heat transfer and conducting an uncertainty analysis using
428
Montel Carlo simulations.
429
Numerical modeling based on the finite element method is recommended for the estimation of
430
geothermal potential (Aravena et al., 2016), since it provides a rigorous way to evaluate and
431
understand conceptual models and the system heat transfer mechanisms. Similarly,
González-432
Garcia and Jessell (2016) stated that numerical modeling of heat and mass transfer in a
433
hydrothermal system is a proper tool to provide a quantitative estimate of geothermal resources, as
434
well as to aid in the sustainable management of these resources. Therefore, numerical modeling was
435
used here as a tool helping to deal with topography and thermal conductivity distribution
436
constrained by the inferred geology, to provide an estimation of the geothermal resources in the
437
study area. Modeling results indicated that the Cajamarca Complex, characterized by a thermal
M
AN
US
CR
IP
T
AC
CE
PT
ED
26conductivity of 2.9 W m-1 K-1 can host potential basement reservoirs, as also suggested by
439
Almaguer (2013), where the presence of secondary porosity will allow water circulation since the
440
rock matrix has a low primary porosity. The Andesite unit, characterized by low thermal
441
conductivity of 1.2 W m-1 K-1, can provide insulation or thermal blanketing effect.
442
The average thermal power estimated with Monte Carlo simulations was 1.54 x 10⁻² MWt m -1 443
(homogenous thermal conductivity) and 1.88 x 10⁻² MWt m-1 (temperature dependent thermal 444
conductivity) per meter of thickness of the potential reservoir and for an area of 1 km2 located
445
outside the Los Nevados NNP. This estimation is based on thermal conductivity measurements in
446
surface samples and on the simulation of the geothermal gradient with a numerical model to
447
anticipate temperature up to a depth of 2 km. The use of these variables and the hypothesis selected
448
to estimate the temperature at depth can obviously affect the resources evaluation. However there is
449
currently a lack of information about the behavior of the rock thermal conductivity at depth that
450
could be obtained in the future from deep wells to further constrain temperature observations and
451
calibrate the numerical model. Nevertheless, with available information in the study area facing
452
early exploration stage, the estimated geothermal resource is thought to be representative of the
453
current state of knowledge that will be improved as exploration proceeds to verify additional
454
hypothesis that can influence heat transfer mechanisms at depth.
455
A utilization efficiency factor was used to evaluate the electrical generation potential. This factor
456
depends on the geothermal fluid temperature (Williams et al., 2008) and is calculated by comparing
457
the actual power output to the maximum theoretical power that could be produced from the given
458
geothermal fluid (DiPippo, 2012). An efficiency of 0.4 has been reported for systems of high
459
temperature (above 150 °C; Muffler and Cataldi, 1978; Williams et al., 2008).
460
Further research steps shall consider the heterogeneity of the lithologic units, in other to identify
461
and collect samples of the different type of rocks constituting the formations and estimate its
462
thermal conductivity distribution. This additional work is important for the highly heterogeneous
463
formations like the Quebradagrande and the Cajamarca complexes. Additional thermal conductivity
M
AN
US
CR
IP
T
AC
CE
PT
ED
27measurements will further help to take into account the impact of heterogeneity in the Monte Carlo
465
simulations and quantify its effect for the resource estimation. Only temperature at depth and
466
recovery factor were included in this work for the uncertainty analysis. Petrophysical properties
467
could be taken into account to help scale up thermal properties and better define their distribution in
468
next research steps, when further deep well data becomes available, to finally refine Monte Carlo
469
analysis of geothermal resources.
470 471
7 Conclusions
472
The thermal power estimated in this study can be compared to the electric power of 50 MWe 473
mentioned by Mejía et al. (2014), assuming a utilization factor of 0.4 and a reservoir width of 5 km.
474
The electric power would consequently be comprised within the range 30–40MWe for the potential 475
reservoir considering both scenarios (Case A and B), thus close to the estimation mentioned by
476
Mejía et al. (2014). Nevertheless, the current study provides a more detailed analysis of the NDR
477
geothermal resource potential by describing the complete methodology to obtain the final power
478
estimates.
479
The uncertainty analysis allowed identifying the influence of the reservoir temperature and the
480
recovery factor as input variables on the geothermal power estimate. A change in the reservoir
481
temperature has a greater effect on the estimated thermal power than a change in the possible
482
recovery factor.
483
An accurate measurement of the heat flow over the study area, with continuous downhole
484
temperature profiles and thermal conductivity measurements on core samples, will help to better
485
estimate and model the temperature at depth to reduce resource uncertainty in the future. 3D
486
geomodeling combined with new deep exploratory wells will further improve the inferred
487
geological cross-section to the benefit of the geothermal potential estimation. Geomodeling will be
488
particularly useful to better characterize the geological contact between the Cajamarca Complex,
489
potential fractured reservoirs and the Andesite unit since this contact is a key factor to evaluate the
M
AN
US
CR
IP
T
AC
CE
PT
ED
28temperature at depth. Additionally, since the Cajamarca Complex is highly heterogeneous, detailed
491
field investigations are required to improve its description. Further work will focus on the
492
characterization of fault systems associated with hot springs and on the numerical simulation of
493
reservoir exploitation with production and injection wells. Such logical steps are needed to move
494
forward with the development of geothermal energy in Colombia, providing critical knowledge to
495
support energy decisions.
496
This work is a valuable contribution to geothermal resource assessment that can be applied to
497
eventually evaluate the total resource in Colombia. Geothermal resources still has to be defined at
498
the Tufiño-Chiles-Cerro Negro geothermal system at the Colombia-Ecuador border, the Azufral,
499
Purace, and Galeras volcanoes, and the Paipa and San Diego areas, which are the regions where
500
exploration studies have been conducted or hydrothermal systems have been observed (Alfaro,
501
2015). The same methodology can be useful for other countries of South America. Several countries
502
such as Bolivia, Argentina, Ecuador and Peru are looking for geothermal resources exploitation
503
although no geothermal capacity was installed in this region up to 2015 (Bertani, 2016). The first
504
geothermal power plant in South America started delivering electricity to the interconnected grid
505
deserving northern Chile in March 20172, highlighting and important step in the history of
506
geothermal energy in South America. Geothermal resource assessment studies are required to
507
support the development of such projects.
508 509
8 Acknowledgments
510
This work was conducted in the context of a research project funded by the Universidad de
511
Medellín (Medellín, Colombia) in collaboration with the Institut national de la recherche
512
scientifique (Québec, Canada). Thanks to the Canadian Department of Foreign Affairs, Trade and
513
Development who assigned the Emerging Leaders in the Americas Program scholarships to Maria
514
2
M
AN
US
CR
IP
T
AC
CE
PT
ED
29Isabel Vélez and Sebastian Cordoba in 2015. Thanks to Thomas Kalbacher for his help with the
515
software OpenGeoSys and to two anonymous reviewers contributing to the improvement of the
516
original paper.
517
The IGCP, UNESCO, and IUGS are finally acknowledged since this work is part of the project
518
“IGCP 636-Unifying international research forces to unlock and strengthen geothermal exploitation
519
of the Americas and Europe”, currently funded by UNESCO (United Nations Educational,
520
Scientific and Cultural Organization) and IUGS (International Union of Geological Sciences)
521
within the International Geoscience Programme (IGCP).
522 523
References
524
Alfaro, C. 2015. Improvement of perception of the geothermal energy as a potential source of
525
electrical energy in Colombia, country update. Paper presented at the World Geothermal Congress,
526
Melbourne, Australia. 15 pp.
527
Almaguer, J.L. 2013. Estudios magnetotelúrico con fines de interés geotérmico en sector Norte del
528
Nevado del Ruíz, Colombia. MSc thesis, Universidad Nacional Autónoma de México. 139 pp.
529
ASTM - American Society for Testing and Materials. 2008. Standard test method for determination
530
of thermal conductivity of soil and soft rock by thermal needle probe procedure (Vol. D5334 - 08),
531
9 pp.
532
Arango, E.E., Buitrago, A.J., Cataldi, R., Ferrara, G.C., Panichi, C., Villegas, V.J. 1970.
533
Preliminary study on the Ruiz geothermal project (Colombia). Geothermics, 2, Part 1: 43-56. doi:
534
10.1016/0375-6505 (70)90005-2.
535
Aravena, D., Muñoz, M., Morata, D., Lahsen, A., Parada, M. Á., Dobson, P. 2016. Assessment of
536
high enthalpy geothermal resources and promising areas of Chile. Geothermics, 59, Part A: 1-13.
537
doi: 10.1016/j.geothermics.2015.09.001.
538
Barylo, A. 2000. Assesment of the energy potential of the Beregovsky geothermal system, Ukraine
539
Geothermal Training Programme. Iceland: 29-42.
540
Bédard, K., Comeau, F.-A. Millet, E., Raymond, J., Malo, M., Gloaguen, E. 2016. Évaluation des
541
ressources géothermiques du bassin des Basses-Terres du Saint-Laurent. Research Report 1659.
542
Institut national de la recherche scientifique - Centre Eau Terre Environnement. 100 pp.
543
Bernal N.F., Ramirez G., Alfaro C.V. 2000. Mapa geotérmico de Colombia. Versión 1.0. Escala
544
1:1’500.000. Memoria explicativa. Exploración y Evaluación de Recursos Geotérmicos. Instituto de
545
investigación e información geocientífica, minero-ambiental y nuclea INGEOMINAS. 51 pp.
M
AN
US
CR
IP
T
AC
CE
PT
ED
30Bertani, R. 2009. Geothermal energy: an overview on resources and potential. Proceedings of the
547
International Conference on National Development of Geothermal Energy Use and International
548
Course/EGEC Business Seminar on organization of successful development of a geothermal
549
project, k. Popovski, A.Vranovska, S. Popovska Vasilevska, Editors. 19 pp.
550
Bertani, R. 2016. Geothermal power generation in the world 2010-2014 update report. Geothermics,
551
60: 31-43. doi:http://dx.doi.org/10.1016/j.geothermics.2015.11.003.
552
Böttcher, N., Watanabe, N., Görke, U.-J., Kolditz, O. 2016. Geoenergy Modeling I. Geothermal
553
Processes in Fractured Porous Media. SpringerBriefs in Energy. Computational Modeling of
554
Energy Systems. 117 pp.
555
Bucker, C., Rybach, L. 1996. A simple method to determine heat production from gamma-ray logs.
556
Marine and Petroleum Geology, 13(4): 373–375.
557
Calcagno, P., Baujard, C., Guillou-Frottier, L., Dagallier, A., Genter, A. 2014. Estimation of the
558
deep geothermal potential within the Tertiary Limagne basin (French Massif Central): An integrated
559
3D geological and thermal approach. Geothermics, 51(0): 496-508. doi:
560
http://dx.doi.org/10.1016/j.geothermics.2014.02.002. 561
Carslaw, H. S., & Jaeger, J. C. (1947). Conduction of Heat in Solids. Oxford,UK: Oxford
562
University Press.
563
CHEC - Central Hidroeléctrica de Caldas, Instituto Colombiano de Energía Eléctrica, Consultoría
564
Técnica Colombiana Ltda, Geotérmica Italiana. 1983. Investigación Geotérmica Macizo Volcánico
565
del Ruíz. Fase II, Etapa A (Vol. II, III). Bogotá.
566
Clauser, C. 2014. Thermal Storage and Transport Properties of Rocks, II: Thermal Conductivity and
567
Diffusivity. Encyclopedia of Solid Earth Geophysics. Part of the series Encyclopedia of Earth
568
Sciences Series. Springer Netherlands. Editors: Harsh K. Gupta. pp. 1431-1448.
569
CORPOCALDAS 2007. Plan de manejo de los páramos del departamento de Caldas. Technical
570
report. 133 pp.
571
Decagon Devices Inc. 2008. KD2 Pro Thermal properties analyzer operator’s manual version 12.
572
Decagon Devices, Inc. 72 pp.
573
DiPippo, R. 2012. Geothermal power plants: principles, applications, case studies and
574
environmental impact (3 ed.). Massachusetts, UE: Butterworth-Heinemann. 624 pp.
575
Forero, J.A. 2012. Caracterización de las alteraciones hidrotermales en el flanco Noroccidental del
576
Volcán Nevado del Ruiz, Colombia. MSc thesis, Universidad Nacional de Colombia, Bogotá. 121
577
pp.
578
Freeze, A.R., Cherry, J.A. 1979. Groundwater. Prentice-Hall. 604 pp.
579
Fridleifsson, I. B. 2003. Status of geothermal energy amongst the world’s energy sources.
580
Geothermics, 32(4–6): 379–388. doi:http://dx.doi.org/10.1016/j.geothermics.2003.07.004.
M
AN
US
CR
IP
T
AC
CE
PT
ED
31Geuzaine, C., Remacle, J-F. 2009. A three-dimensional finite element mesh generator with built-in
582
pre- and post-processing facilities. International Journal for Numerical Methods in
583
Engineering 79(11): 1309-1331.
584
González-Garcia, J., Jessell M. 2016. A 3D geological model for the Ruiz-Tolima Volcanic Massif
585
(Colombia): Assessment of geological uncertainty using a stochastic approach based on Bézier
586
curve design. Tectonophysics 687 (26): 139–157.
587
González-Garcia J., Hauser J., Annetts D., Franco J., Vallejo E., Regenauer-Lieb K. 2015.
588
Nevado Del Ruiz Volcano (Colombia): A 3D Model Combining Geological and
589
Geophysical Information. Proceedings World Geothermal Congress, Melbourne, Australia.
590 591
González, H. 2001. Geología de las planchas 206 Manizales y 225 Nevado del Ruíz. Memoria
592
explicativa. Instituto de investigación e información geocientífica, minero-ambiental y nuclear,
593
INGEOMINAS, Bogotá. 93 pp.
594
INGEOMINAS 2000. Mapa de flujos de calor-
595
Invernizzi, C., Pierantoni P.P., Chiodi A., Maffucci R., Corrado S., Baez W., Tassi F., Giordano G.,
596
Viramonte J., 2014. Preliminary assessment of the geothermal potential of Rosario de la Frontera
597
area (Salta, NW Argentina): Insight from hydro-geological, hydro-geochemical and structural
598
investigations. Journal of South American Earth Sciences 54: 20–36.
599
Lee, K.C. 1996. Classification of geothermal resources – an engineering approach. Proceedings,
600
Twenty-First Workshop on Geothermal Reservoir Engineering, Standford University, Stanford,
601
California, January 22–24. SGP-TR-151, 8 pp.
602
Londoño, J. M., Sudo, Y. 2002. Velocity structure and a seismic model for Nevado del Ruiz
603
Volcano (Colombia). Journal of Volcanology and Geothermal Research, 119 (1-4): 61-87. doi:
604
http://dx.doi.org/10.1016/S0377-0273 (02)00306-2.
605
Mejía, E., Rayo, L., Méndez, J., Echeverri, J. 2014. Geothermal development in Colombia. Short
606
Course VI on Utilization of Low- and Medium-Enthalpy Geothermal Resources and Financial
607
Aspects of Utilization, Santa Tecla, El Salvador. 7 pp.
608
Mejía, E., Velandia, F., Zuluaga, C.A., López, J.A., Cramer, T. 2012. Análisis estructural al noreste
609
del Volcán Nevado de Ruíz Colombia – Aporte a la Exploración Geotérmica. Boletín de Geología,
610
34(1): 27-41.
611
Melson, W.G., Allan, J.F., Jerez, D.R., Nelen, J., Calvache, M.L., Williams, S.N., Fournelle J.,
612
Perfit, M. 1990. Water contents, temperatures and diversity of the magmas of the catastrophic
613
eruption of Nevado del Ruiz, Colombia, November 13, 1985. Journal of Volcanology and
614
Geothermal Research, 41 (1): 97-126. doi:http://dx.doi.org/10.1016/0377-0273 (90)90085-T.
615
Monsalve, M.L., Rodriguez, G.I., Mendez, R.A., Bernal, N.F. 1998. Geology of the Well Nereidas
616
1, Nevado Del Ruiz Volcano, Colombia Geothermal Resources Council 22, 6 pp.