an author's
http://oatao.univ-toulouse.fr/21985
https://doi.org/10.1016/j.compind.2018.10.006
Bahi, Jacques and Elghazel, Wiem and Guyeux, Christophe and Hakem, Mourad and Medjaher, Kamal and Zerhouni,
Noureddine Reliable diagnostics using wireless sensor networks. (2019) Computers in Industry, 104. 103-115. ISSN
0166-3615
Reliable
diagnostics
using
wireless
sensor
networks
Jacques
Bahi,
Wiem
Elghazel,
Christophe
Guyeux
*
,
Mourad
Hakem,
Kamal
Medjaher,
Noureddine
Zerhouni
Femto-STInstitute,UMR6174CNRS,UniversitédeBourgogneFranche-Comté,France
ABSTRACT
Monitoringactivitiesinindustrymayrequiretheuseofwirelesssensornetworks,forinstancedueto difficultaccessorhostileenvironment.Butitiswellknownthatthistypeofnetworkshasvarious limitationsliketheamountofdisposableenergy.Indeed,onceasensornodeexhaustsitsresources,itwill bedroppedfromthenetwork,stoppingsotoforwardinformationaboutmayberelevantfeaturestowards the sink.This willresult in brokenlinksanddata losswhichimpactsthe diagnostic accuracy atthe sink level. Itisthereforeimportanttokeepthenetwork'smonitoringserviceaslongaspossiblebypreservingthe energyheldbythenodes.Aspackettransferconsumesthehighestamountofenergycomparingtoother activitiesinthenetwork,varioustopologiesareusuallyimplementedinwirelesssensornetworksto increasethenetworklifetime.Inthispaper,weemphasizethatitismoredifficulttoperformagood diagnosticwhendataaregatheredbyawirelesssensornetworkinsteadofawiredone,duetobrokenlinks anddatalossontheonehand,anddeployednetworktopologiesontheotherhand.Threestrategiesare consideredtoreducepackettransfers:(1)sensornodessenddirectlytheirdatatothesink,(2)nodesare dividedbyclusters,andtheclusterheadssendtheaverageoftheirclustersdirectlytothesink,and(3) averageddataaresentfromclusterheadstoclusterheadsinahop-by-hopmode,leadingtoanavalancheof averages.Their impact onthediagnosticaccuracyisthenevaluated.Weshowthattheuseofrandomforests isrelevantfordiagnosticswhendataareaggregatedthroughthenetworkandwhensensorsstopto transmittheirvalueswhentheirbatteriesareemptied.Thisrelevanceisdiscussedqualitativelyand evaluatednumericallybycomparingtherandomforestsperformancetostate-of-the-artPHMapproaches, namely:basicbaggingofdecisiontrees,supportvectormachine,multinomialnaiveBayes,AdaBoost,and GradientBoosting.Finally,awaytocouplethetwobestmethods,namelytherandomforestsandthe gradientboosting,isproposedbyfindingthebesthyperparametersoftheformerbyusingthelatter.
1. Introduction
During their life cycle, industrial systems are subjected to failures,whichcanbeirreversibleorhaveundesirableoutcomes varyingfromminortosevere.Fromthiscontext,itisimportantto monitor a system, assess its health, and plan maintenance activities.Overthepastyears,researchinPrognosticandHealth Management(PHM)fieldhasgainedagreatdealofattention.PHM aimsatdefiningamaintenancescheduleandpreventingsystem shutdown.Yet,ifthepredictionmodelandtheprovided measure-mentsarenotaccurate,itispossiblethatthemaintenanceactivity willbeperformedeithertoosoonortoolate.
HealthassessmentisakeystepforRemainingUsefulLife(RUL) estimation.Basedontheanalysisandthepredefinedthresholds,
themachine/component'shealthstateisidentified.Sensorydata isreportedperiodicallytomonitorcriticalcomponents.Thisdata corresponds tomeasurementsof monitoringparametersand is useful to assess the machine/component's condition. Each monitoringparameterhasathreshold;oncereached,thesystem isconsideredtobeinthecorrespondingstate.Reliablehealthstate estimations depend on accurate measurements and fast data processing. The information in question is often gathered by means of individual sensor nodes or via a wired network of sensors.Nevertheless,forsomeapplications,theuseofaWireless SensorNetwork(WSN)canbearequirementratherthanachoice. For example, due to accessibility or extra weight issues, connecting the sensors through physical wires is not feasible. WSNsaredesignedforanefficienteventdetection.Theyconsistof alargenumberofsensornodesdeployedinasurveillanceareato detect the occurrence of possible events. Such an activity necessitates efficiency, which is hard to achieve with the constraintsofWSNs[9].
* Correspondingauthor.
AvailableenergyisabiglimitationtoWSNcapabilities.Infact, sensor nodesaresmallsizeddevices, resultingin tinyand non-refillable batteries asenergy supply [5].Therefore, tokeep the networkrunningforaslongaspossible,weneedtopreservethe available energy. As reducing packet transfer distance and frequencyhelpsconsumelessenergy,apossiblesolutionwould becombiningdataintoonepacketandforwardalltheinformation atoncetothebasestation:thisiscalleddataaggregation.
DatagatheringinWSNscanbeeitherperiodicorevent-driven. In periodic applications, data is gathered periodicallywhile in event-drivenapplicationsgatheringdependsontheoccurrenceof someevents.Inbothcases,thegoalfromaggregationisreducing energy dissipationbyholdingpackets foraslongaspossiblein intermediatenodes.Allpacketswillbecombinedtogetherthen forwardedinthenetwork.Itisobvioustoseethatadecreasein energyconsumptionleadstoanincreaseintheoveralldelay,and viceversa.Areliablesolutionwouldaimatfindinganacceptable tradeoffbetweenenergyconsumptionanddelayinWSNs[23].
Packettransferconsumesthehighestamountofenergyinthe network.Thehigherthedistanceoftransfergets,themoreenergy isconsumed.Itisthereforepreferablethatthesensors communi-catewithintheshortestradiorangepossible.Severalsolutionsto preserve thenetwork'senergyhavebeeninvestigated,and they includethestudyofthetopology.Inthispaper,wecompareseveral networktopologiesandstudytheirimpactonthequalityofhealth assessment.
Themachine/component'shealthstategoesthroughdifferent classes varying from healthy to degraded. Health assessment consists in identifying the class corresponding to the current health state. In this article, the use of random forests (RF) is proposedforindustrialfunctioninghealthassessment,particularly in the context of devices being monitored using a WSN. A prerequisiteinprognosticsand healthmanagement(PHM)isto considerthatdataprovidedbysensorsiseitherflawlessorsimply noisy. WSNs monitoring is somehow unique in the sense that sensorstooaresubjectedtofailuresorenergyexhaustion,leading toachangeinthenetworktopology.Thus,themonitoringquality is variabletooanditdepends onbothtimeandlocationonthe device.Tosaythisdifferently,toextendthelifeofWSNnodeswill increase the monitoring duration, but it may decrease the diagnosticperformanceduetostrategiesdeployedinthenetwork (aggregation,scheduling,etc.)thatenlargesnoiseinacertainway. Ouraimistoshowtheeffectsofsuchstrategiesonthecompromise between monitoring duration and quality, and to propose a diagnosticapproachthatiscompatiblewithsuchstrategies.
Indeed,variousstrategiescanbedeployedonthenetworkto achievefaulttoleranceortoextendtheWSN'slifetime,likenodes schedulingordataaggregation.However,thediagnosticprocesses mustbecompatiblewiththesestrategies,andwithacoverageofa changingquality[1,11].Theobjectiveofthisresearchworkisto showthatRFsachieveagoodcompromiseinthatsituation,being compatiblewithanumberofsensorswhichmaybevariableover time,someofthembeingsusceptibletoerrors.Moreprecisely,we willexplainwhyrandommethodsarerelevanttoachieveaccurate diagnosticsofanindustrialdevicebeingmonitoredusingaWSN. Algorithmswillbeprovided, andanillustration ona simulated WSNwillfinallybedetailed.
Thecontributionsofthisarticlecanbesummarizedasfollows. The functioningofRFis recalledandappliedin themonitoring context, when data are gatheredby a wireless sensor network insteadofawiredone.Weshowthatdiagnosticismoredifficultin such networks, due to broken links, data loss, and deployed network topologies. To do so, three aggregation strategies to reducepackettransfersareconsidered,andtheirimpactonthe diagnostic accuracy is discussed qualitatively. It is evaluated numerically by comparing the random forests performance to
state-of-the-artPHMapproaches.Finally,ahybridationofthetwo bestmethods(randomforestsandgradientboosting)isproposed, toachievethebestRFhyperparametersselectionbyusinggradient boosting.
Theremainderofthispaperisorganizedasfollows.InSection2 we give the state of the art. Section 3 presents the proposed algorithmforWSNbaseddiagnostics,namelytherandomforests. Itsperformanceonvarioussensortopologiesisshowninthenext section, while the RF-based diagnostic is compared to other machine learning methods in Section5. Thisarticle ends by a conclusionsection,inwhichthecontributionissummarizedand intendedfutureworkisoutlined.
2.State-of-the-artreview
To perform a periodic data gathering in a wireless sensor network, data aggregation is achieved through organizing the network according to a logical structure, mainly a tree or a clustering[28].Whenatreeisused,aggregatorsaretheinternal nodesinthetreeroutedatthesink.Withclusteringstructures, aggregators arethe Cluster Heads (CH).In [14,19], theauthors prove that clustering methods provide better results for data aggregation, as they consume less energy. Defining a specific clusterandchoosingtheCH(aggregatornodeinthecluster)have animportantimpactonaggregationqualityandenergy consump-tion. Besides, structured approaches incur high maintenance overheadin eventbased applications.In fact,thesourcenodes change when a new event occurs. In other words, when the network starts running, the structure is fixed based on the positionsofnodessensingtheevent(sourcenodes).Forthenext round,theeventmayoccursomewheredifferentinthenetwork, whichresultsinachangeinsourcenodes.Consequently,thefixed structurewillperformpoorly[34].
Several WSN topologies were used in existing monitoring applications,seeTable1.In[21],Kaitetal.proposeaWSN-based paddygrowthmonitoringsystem.Sensornodesgatherandsend fielddata,such astemperature, periodicallytotheBaseStation (BS). This is done by using multi-hop routing which is not consideredenergyefficient.Sensornodestransmitdatathrough the nearest neighbor which might lead to the longest path. Moreover,thisroutingprotocoldoesnotconsidertheenergylevel of the sensor nodes to generate transmission path. Another interesting study by Yoo et al. [33] proposes a precision and intelligence agricultural system referred to as the Automated AgricultureSystem. The goal of this system is tomonitor and controlthegrowingprocessofmelonandcabbageinagreenhouse. Inthesystem,sensornodesareorganizedinaparent-childtree structure.Thenodesjoin thenetwork bybroadcastinga parent search packet.Furthermore,the nodes transmit datato theBS usingthreegatewaynodes.However,thetreestructurehasasingle pointoffailure.Yangetal.[32]developedanintensiveWSN-based
Table1
Comparison of WSN based monitoring. Note that none of them provide a
monitoringimpactmeasurementoftheWSNembeddedprotocol.
Reference Context Routingprotocol WSNdrawback
Kaitetal.[21] Paddygrowth Multi-hoprooting Inefficientenergy
tonearestneighbor protocol
Yooetal.[33] Growingprocessof Parent-childtree Singlepoint
melonandcabbage failure
Yangetal.[32] Irrigation Through(widely Inefficientenergy
separated)clusters protocol
Chitietal.[7] Agro-food Dynamicflooding Inefficientenergy
production protocol
Kabashi[20] Agriculture Shortestpathgraph Sensingholes
CNS[17] Agriculture Treestructure Singlepoint
irrigation monitoring system. Sensor nodes are placed by this systeminwidelyseparatedclusters.Thus,sensornodesconsume much energy for transmitting data to remote nodes in other clusters.
Chiti et al. [7] propose next generation firm for Agro-food productions.ThissystemusesAmbientIntelligenceandWSNs.The proposedsystemprovidesfeedbackandadaptability toincrease productions in Agro-food. However, the deployed WSNuses a dynamicfloodinginefficient-energyroutingprotocol.Thisisdueto thefactthatalargenumberofmessagesarebroadcasted.Village eScience for Life [20] is a WSN-based agriculture project. It is implementedin developingregionsin Africaanduses dynamic zone-basedtopology.Thisprojectinitiallydeployssensornodes intozonesinsuchawaythateachsensornoderemainswithinthe transmissionrange ofthenodesof atleasttwo zonesand each nodebelongingtoa zoneelectsnodes in neighboringzones to whichitcanconnectwithaminimumtransceiverpower.Hence, severalgraphsaregeneratedand thegraphrequiringminimum transmissionpowerisselectedforrouting.However,thisrouting protocoldoesnotguaranteetoeliminatesensingholes. COMMON-SenseNet(CNS)[17]isanotherWSN-basedagriculturemonitoring projectdeveloped for semiaridregionsin developing countries. The routing protocol of CNS uses tree structure which is not reliablesincealinkfailureorsensornodefailurecanmakeother nodes unreachable to BS. Unlike the earlier works that focus mainly on the WSN-based monitoring applications, recent research [6] has significantly considered studying the actual structureofWSNthroughgraphtheory.Inparticular,geometric graphsareusedinWSNs[22]tomodeltherelationshipbetweena sensornodeanditsneighboringsensornodes[13,24].Tosumup, eachofthestate-of-the-artalgorithmscontainsWSNdrawbacks, andnoneofthemprovideamonitoringimpactmeasurementof theWSNembeddedprotocol.
BeforestudyingWSNnetwork dependability, wefocused on findinganalgorithmthatisabletoproducegooddiagnosticswith incompletemonitoringdata[2].AssummarizedinFig.1, mainte-nancestrategiesevolvedthroughtimeandbecamepredictiveand conditionbased.
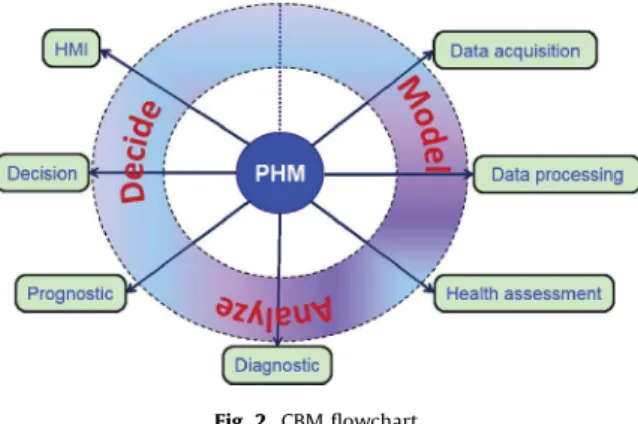
Condition-basedmaintenance(CBM)isaproactiveprocessfor maintenancescheduling,basedonreal-timeobservations.Itaims atassessingmachine'shealththroughconditionmeasurements.As any maintenance strategy, CBM aims at increasing the system reliabilityandavailability.Thebenefitsofthisparticularstrategy includeavoidingunnecessarymaintenancetasksandcosts,aswell asnotinterruptingnormalmachineoperations[15].Inordertobe efficient,aCBMprogramneedstogothroughthefollowingsteps [18],asillustratedinFig.2.
Inthisstudy,welimitourworktodiagnostics.Sensorydataare reportedperiodicallytomonitorcriticalcomponents.Thesedata correspondtomeasurementsofparameters(pressure, tempera-ture,moisture...),andareusefultoassessthemachine'scondition. Thresholdsrelatedtothemonitoredparametersarefixed.Oncea
threshold is reached, the system is considered to be in the correspondingstate.InFig.3,thesuccessivestepsofadiagnostic processareillustrated.
! Fault detection is used to report an anomaly in the system behavior.
! Faultisolationischargedofdeterminingandlocatingthecause (orsource)oftheproblem.Itidentifiesexactlywhich compo-nentisresponsibleofthefailure.
! Fault identification aims at determining the current failure modeandhowfastitcanspread.
Thediagnosticsofasystem'sstateofhealthistheequivalentof aclassificationproblem.Inmachinelearning,classificationrefers toidentifyingtheclasstowhichanewobservationbelongs,onthe basis of a training set and quantifiableobservations,knownas properties.Inensemblelearning,theclassifiersarecombinedto solve a particular computational intelligence problem. Many researchpapersencourageadaptingthissolutiontoimprovethe performanceof amodel,or reducethelikelihood ofselectinga weakclassifier.Forinstance,Diettericharguedthataveragingthe classifiers’outputsguaranteesabetterperformancethantheworst classifier [8]. This claim was theoretically proven correct by Fumera and Roli [12]. In additiontothis, and underparticular hypotheses, the fusion of multiple classifiers can improve the performanceofthebestindividualclassifier[30].
TwooftheearlyexamplesofensembleclassifiersareBoosting andBagging. InBoostingalgorithm [26],thedistributionof the trainingsetchangesadaptivelybasedontheerrorsgeneratedby thepreviousclassifiers.In fact,ateach step,ahigherdegreeof
Fig.1.Historyofmaintenancestrategies.
Fig.2. CBMflowchart.
importanceisaccordedtothemisclassifiedinstances.Attheendof thetraining,aweightisaccordedtoeachclassifier,regardingits individual performance, indicating itsimportance inthe voting process. As for Bagging [3], thedistribution of thetraining set changes stochastically and equal votes are accorded to the classifiers.Forbothclassifiers,theerrorratedecreaseswhenthe sizeofthecommitteeincreases.
In a comparison made by Tsymbaland Puuronen [29],it is shown that Bagging is moreconsistentbut unabletotakeinto accounttheheterogeneityoftheinstancespace.Inthehighlightof this conclusion, the authors emphasize the importance of classifiers’integration.Combiningvarioustechniquescanprovide moreaccurateresultsasdifferentclassifierswillnotbehaveinthe same mannerfaced tosome particularities in the training set. Nevertheless,iftheclassifiersgivedifferentresults,a confusion maybeinduced.Itisnoteasytoensurereasonableresultswhile combining the classifiers. In this context, the use of random methods could be beneficial. Instead of combining different classifiers,arandommethodusesthesameclassifieroverdifferent distributionsofthetrainingset.Amajorityvoteisthenemployed toidentifytheclass.
In thisarticle,theuseofrandomforests(RF)isproposedfor industrial functioning diagnostics,particularly in thecontextof devicesbeingmonitoredusingaWSN.Uptonow,aprerequisitein diagnosticsistoconsiderthatdataprovidedbysensorsareeither flawlessorsimplynoisy.Thisprerequisitemustberelaxedincase wheresenseddatacomefromawirelesssensornetwork,asdata aggregation, node scheduling, and other energy optimization strategiesinpossiblyhostileenvironmentsleadtoincompleteor totallyerroneoussensedvalues.WewillshowthatRF,detailedin the nextsection, cangetaround theseproblems,leading toan accurate diagnostics even in WSN harsh conditions, and even withoutfeatureselection.
Finally,astheotherensemblelearningmethods,RFcanindicate the importance weights of predictors, which is a significant advantagesofsuchapproachesinthedeterminationofthefailure origin.
3. Proposedtechniques 3.1.Theresearchframework
Asmentionedearlierinthisarticle,theobjectiveistostudythe possibility of using random forests for prognostic and health management purposes. The latterhave several advantages that make their use interesting in this context, such as their compatibility with time-varying feature vectors (which can happen, for example,when thesensors are on battery power: some batteries run out over time, and the associated feature thereforedisappearswhenthebatteryisempty).
Our framework therefore consists of an industrialdeviceon which predictive maintenance is deployed based on a wireless sensornetwork.Eachsensorsends,aslongasitcancommunicate (i.e.,aslong as itstill has battery), itsmeasurementperiodicallyto the sink.Thesemeasurementsarepotentiallynoisy:typically,wewant todeploymanysensors,thereforeofpoor quality,andinapotentially hostileenvironment(highorverylowtemperature,etc.)Andsince batteriescanbedrainedorschedulingdevicescanbeputinplaceto extendthelifeofthenetwork,wethereforepotentiallyhavefeatures missingovertime.Finally,WSN-basedPHMusuallydeploysdata aggregationtechniques, alwaysinorderto extendthenetwork's lifetime,andthisoperationcorrespondstofeatureaggregation.
Featureselectiontechniquesareobviouslytobeimplemented atthesinklevelinthecasewheretheindustrialsystemislarge, leading toa largenetwork ofsensors (andtherefore toa large numberoffeatures).Thisselectioncanbedoneinvariousways,e.g.
univariatefeatureselectionorbyusingthesparenessassociated with‘1normstopreprocessthefeatures.However,improvingthis featureselectionstepisnottheobjectiveofthisarticle,andagreat dealofworkhasalreadybeenproducedonthistheme.
Finally, based on a pre-established basis of knowledge, our frameworkconsistsindeployingrandomforestsatthesinklevel, in order to be able to predict the RUL of the device under surveillance.ThisRF-basedpredictionisthencomparedtoother toolstraditionallyusedinPHM,andincludesaphaseofdiscovery ofthebesthyperparametersofeachtechnique.Thesealgorithms arethe SupportVector Machines(SVM), the ClassificationAnd Regression Trees (CART), AdaBoost, Gradient Boosting, and multinomialNaiveBayes.
3.2.Theproposal
TheRFalgorithmismainlythecombinationofBagging[3]and randomsubspace[16]algorithms,andwasdefinedbyLeoBreiman asacombinationoftreepredictorssuchthateachtreedependson thevaluesofarandomvectorsampledindependentlyandwiththe samedistributionforalltreesintheforest[4].Thismethodresulted fromanumberofimprovementsintreeclassifiers’accuracy.
Thisclassifiermaximizesthevariancebyinjectingrandomness invariableselection,andminimizesthebiasbygrowingthetreeto amaximumdepth(nopruning).Forthesakeofcompleteness,the stepsofconstructingtheforestarerecalledinAlgorithm1.
Algorithm1.Randomforestalgorithm
Input:LabeledtrainingsetS,NumberoftreesT,NumberoffeaturesF.
Output:LearnedrandomforestRF.
initializeRFasempty
foriin1..Tdo
S0
i bootstrap(S)
initializetherootoftreei
repeat
ifcurrentnodeisterminalthen
affectaclass
gotothenextunvisitednodeifany
else
selectthebestfeaturef*
amongF
sub-tree split(S0
i;f$)
add(leftChild,rightChild)totreei
endif
untilallnodesarevisited
addtreeitotheforest
endfor
In a RF,the rootof a treeicontains theinstances fromthe trainingsubsetS0
i,sortedbytheircorrespondingclasses.Anodeis
terminalifitcontainsinstancesofonesingleclass,orifthenumber ofinstancesrepresentingeachclassisequal.Inthealternativecase, itneedstobefurtherdeveloped(nopruning).Forthispurpose,at eachnode,thefeaturethatguaranteesthebestsplitisselectedas follows.
The information acquired by choosing a feature can be computed through either thewell-known entropy of Shannon, whichmeasuresthequantityofinformation,orthereputedGini index,whichmeasuresthedispersionina population.Thebest splitisthenchosenbycomputingthegainofinformation from growingthetreeatgivenposition,correspondingtoeachfeatureas follows:
Gainðp;tÞ¼fðpÞ(X
n j¼1
Pj)fðpjÞ ð1Þ
wherepcorrespondstothepositioninthetree,tdenotesthetest atbranchn,Pjistheproportionofelementsatpositionpandthat
gotopositionpj,f(p)correspondstoeitherEntropy(p)orGini(p). ThefeaturethatprovidesthehigherGainisselectedtosplitthe node.
4.Experimentalresults 4.1.Proposedprotocol
Inordertoillustratetheimpactoftopologiesonthequalityof healthestimations,weconsider90sensornodes;30nodesforeach of the monitoring parameters: temperature, pressure, and humidity. The sensors are randomly placed in the simulation window,andareequippedwithbatteriesof100j.Thesinkisalso placedrandomly.Witheverydatatransfer,theenergyofasenderis reducedregardingitsdistancefromtherecipient.
Datasimulation
! Under normal conditions, temperature sensors follow a Gaussian law of parameter (20)(1+0.005t), 1),while these parametersaremappedto(35,1)incaseofamalfunctionofthe industrialdevice.Thesesensorsreturnthevalue0whenthey breakdown.
! ThepressuresensorsproducedatafollowingaGaussianlawof parameter(5)(1+0.01t),0.3) whenthey aresensing a well-functioningarea.Theparameterschangedto(20,2.5)incaseof areafailureinthelocationwherethesensorisplaced,aslongas thepressuresensorsreturn1whentheyarebrokendown. !The Gaussian parameters are (52.5)(1+0.001t),12.5) when
boththeareaandthehumiditysensorsareinnormalconditions. Theseparametersaresetto(80,10)incaseofareafailureinthe rangeofthissensor,whereasmalfunctioninghumiditysensors producethevalue3.
The probability that a failure occurs at time t follows an exponentialdistributionofparameter1–100.
Inotherwords,thepredictorsareconstitutedby30 tempera-turevariables,30pressurevariables,and30humidityones,they areall numerical.The dependentYvariable,for its part,isthe numberoffailures.Notethatthepredictorsarecorrelated(their Gaussianparameterdependsont),andthatthereducednumberof featuresdoesnotrequireaselection.Althoughlow,thisnumberof featureswillstillallowustodemonstratethegoodperformanceof ourapproachinrelationtothestateoftheart.
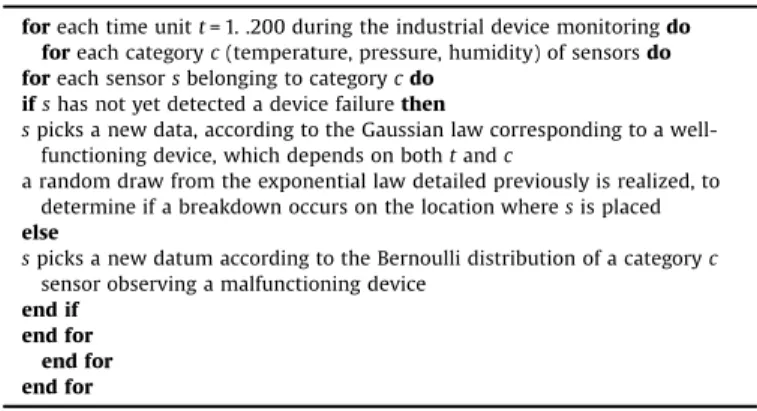
Dataisgeneratedasfollows.
Algorithm2.Datageneration
foreachtimeunitt=1..200duringtheindustrialdevicemonitoringdo
foreachcategoryc(temperature,pressure,humidity)ofsensorsdo
foreachsensorsbelongingtocategorycdo
ifshasnotyetdetectedadevicefailurethen
spicksanewdata,accordingtotheGaussianlawcorrespondingtoa
well-functioningdevice,whichdependsonbothtandc
arandomdrawfromtheexponentiallawdetailedpreviouslyisrealized,to
determineifabreakdownoccursonthelocationwheresisplaced
else
spicksanewdatumaccordingtotheBernoullidistributionofacategoryc
sensorobservingamalfunctioningdevice
endif
endfor
endfor
endfor
Eachsensorreceived100unitsofbattery,and2000unitsfor eachaggregator.Thisenergydecreasesovertime,proportionallyto thetransmissiondistance(forbothsensorsandaggregators),and proportionallytothetimesspenttoperiodicallycollectanewdata (i.e.,computinganewrandomvalueaccordingtotheprobabilistic model)andforaggregating(averaging)acollectionofdata.This durationiscomputedthankstoacalltothetimefunctionbefore andaftertheoperation.Thefinalnumberofpacketscorrespondsto what havebeendefinitivelyreceivedat thesinklevelwhen all nodeshaveemptiedtheirbatteries.
Consideredtopologies
We have considered 3 different topologies during these simulations.
Inthefirstscenario,weconsideradefaulttopology.Whena nodesensesnewdata,itforwardsitdirectlytotheBS.Attheendof each round, the sink will receive 30 different measures of temperature, pressure, and humidity each. The sink will only keeponevalueofeachparameter.Thisisguaranteedbycomputing anaverageusingaGaussiandistribution.
InthesecondscenariodepictedinFig.4(a),9sensorsareadded to the topology. These sensors will be the aggregators (3 per parameter).Therefore,thetopologynowpresents9clustersandin each,nodessendthesenseddatatotheCH.TheCHaggregatesthe datapacketsfromeachroundandsendsthecomputedvalueofthe relativeparametertothesinknode.Itshouldbenotedthatatthis step, the CHs are placed randomly and theirdistance to their clustermembersisnotoptimized.
Inthethirdandlasttopology,wealsoconsidered9clusters.This timeafterallthesensors(CHsandregularnodes)areplaced,each regular nodes finds the closest CH to it by using the K-mean algorithm, and adapts the same type (i.e., parameter). The aggregateddataarethenroutedfromCHstoCHsindirectionto the sink, to reduce the communication cost. This topology is depictedinFig.4(b).
Let usnotice that the firstsituation corresponds towhat is usuallyconsideredin PHM.Conversely,thetwoothercasesare relatedtodatacollectedwithinawirelesssensornetwork,which thusembedsvariousstrategiestoincreasethenetworklifetime, namely the data aggregation in our considered scenarios. Obviously, such aggregation mayimpactdiagnostics, and usual machine learningalgorithmsarenotdesignedtofacesuchdata manipulations.
4.2.Obtainedresults
Wecollectdatainthenetworkusingthetopologiesdescribedin Section 4.1. After data collection step, health assessment is performedthroughtheRFalgorithmdescribedinSection3.Nodes thatcapturenewdatapacketsforwardtheinformation(according to the corresponding network topology) towards the sink for processing.ThedataisthenfedtotheRFalgorithmtoassessthe healthofthemonitoreddevice.
Wevariedthenumberoftreesintheforestfrom1to100,and obtainedintotal18differentforests.Foreachforest,werepeated the simulation 10 times. During the simulation, the sensors communicatethedatageneratedfollowingthelawsdescribedin Section4.1.Thesimulationsaretimed,i.e.,thesimulationdoesnot end when the system fails, but when the simulation time is reached. The decision for each tree is averaged over the 10 simulations, and the final decision is averaged over all the decisions givenbyeach treein theforest.In thefollowing, we showtheaveragenumberoferrorsinhealthestimationforeachof the3proposedtopologies.
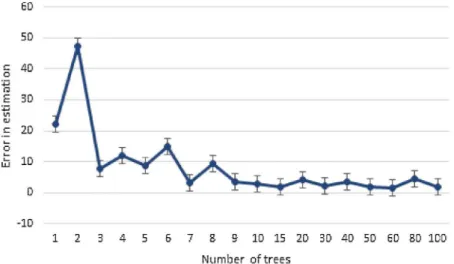
In Fig. 5 weplotted theaverage numberof errors in health estimation, when all nodescan communicate withtheBS. The errorratewasmaintainedbelow50%atalltimes.Withthenumber oftreesincreasingintheforest,theerrorratedecreasesandgets closeto0%.Whenthenumberoftreesintheforestismorethan9, theerrorratebecomesalmostconstant.
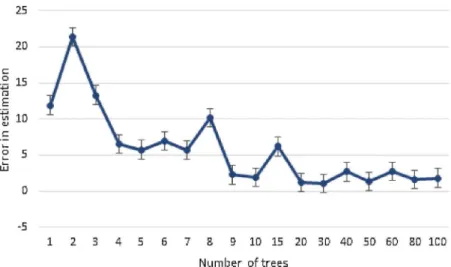
Fig.6showstheaveragenumberoferrorsinhealthestimation, whendataisaggregatedbeforebeingsenttotheBS(asdescribed inSection4.1).Theerrorrate,comparedtotheprevioussimulation,
wasreducedbyhalf,andwasstabilizedwhennumberoftreesis greater than 20. Aggregating data reduces the frequency of transferringpacketsin thenetwork;CHs willreceivedata from nodeswithintheirrange,combinethemtogetherandsendthemas one packet. As a result, the overall activity of sensors will be reduced,and consequently theywillconsumeless energy.This meansthat sensorscan live longer(comparingtothe previous topology)toensuretransferringrelevantdatatotheBSforhealth assessment.Wecanthereforeconcludethatreducingthenumber ofpacketsinthenetworkhelpsimprovethequalityofdiagnostics. In Fig.7 we plottedtheaverage numberof errors in health estimation, when nodes forward their data to the nearest aggregator.Error ratewas reduced by almost a half when the distanceoftransferisreduced,andreached0%whenthenumber oftreesisgreaterthan80.Transferringdataoverashortdistance requireslessenergyfromthesender.Thishelpspreserveenergy for a longer period and ensures that data needed for health assessmentcanbedeliveredtotheBSoverthattimeperiod.
To summarize, aggregating data packets ensures that nodes degrade gracefully (rather than abruptly) and results in more accurateestimations,whichwouldhavenotbeenthecasewhen usingacommonmachinelearningalgorithmusuallyimplemented forPHM(inwiredcase).Also,havingnodestransfertheirdataover a short distance helps topreserve the available energy in the network.Thepointfromwhichtheerrorrateisstabilizedcanbe consideredastheoptimal(orminimum)numberoftreesneeded intheforest.
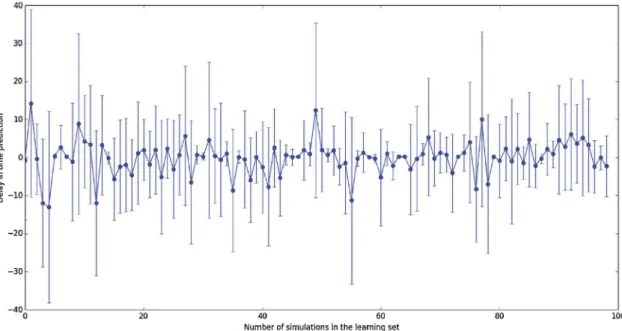
Fig.8presentsthedelaybetweenthetimethesystementersa failuremode and the time ofits detection.This is donein the absenceofcorrelationsbetweenthedifferentfeatures.The0time valueofdelay,thenegativevalues,andpositivevaluesreferto in-timepredictions,earlypredictionsandlatepredictionsoffailures, respectively.Theplottedvaluesaretheaverageresultpernumber ofsimulationswhichvariesfrom1to100.Withtime,sensornodes starttofailinordertosimulatemissingdatapackets.Asaresult, theRFalgorithmwasabletodetect54%ofthefailureseitherin timeorbeforetheiroccurrence.
Foreachofthe100performedsimulations,wecalculatedthe averagenumberoferrorsinfaultdetection,producedbythetrees intheforest.Fig.9showsthatthiserrorrateremainedbelow15% throughthesimulation.Thiserrorrateincludesboth“tooearly” and “too late” detections. When certain sensor nodes stop functioning, this leads to a lack on information, which hasan impact on the quality of predictions; this explains a sudden increaseintheerrorratewithtime.Wecanconcludefromthelow
errorrateintheabsenceofsomedatapacketsthatincreasingthe numberoftreesintheRFhelpsimprovethequalityandaccuracyof predictions.
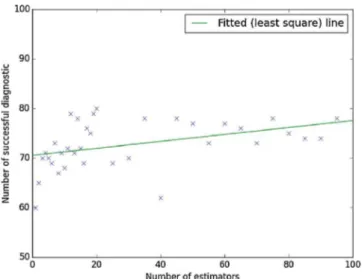
As described in Section 4.1, a correlation was introduced betweenthefeatures.Fig.10showsthenumberofsuccessful fault detection when the number of tree estimators in the forest changes. As shown in this figure, the RF method guarantees a 60% success ratewhen the number of treesis limitedto5.Asthisnumbergrows,theaccuracyofthemethod increasestoreach80%whenthenumberoftreesisaround100. Comparingtothepreviousresults,thecorrelationbetweenthe featureshelpsdecreasetheuncertaintiesinhealthassessment whenthenumberoftreesincreases.Thealgorithmisableto understandtherelationshipbetweentwofeatures.Thus,when somevalues describing a feature are missing,the algorithm can deduct them from the available information about the remainedfeatures.
5.Discussions
Forthesakeofdiscussion,wewillevaluateinthissectionthe RF-baseddiagnosticcomparedtoothermachinelearningmethods.
5.1.Generalcomparison
Findingtheoptimaltrainingofaclassificationproblemismost of the times a real difficultproblem. Treeensembles have the advantageofrunningthealgorithmfromdifferentstartingpoints, andthiscanbetterapproximatethenear-optimalclassifier.Inhis paper,LeoBreimandiscussestheaccuracyofRandomForests.In particular, he gave proof that the generalized error, although differentfromone applicationtoanother, alwayshasanupper boundandsorandomforestsconverge[4].
Theinjectedrandomnesscanimproveaccuracyifitminimizes correlation while maintaining strength. The tree ensembles investigatedbyBreimanuseeitherrandomlyselectedinputsor a combination of inputs at each nodeto grow the tree.These methodshaveinterestingcharacteristicsas:
-TheiraccuracyisatleastasgoodasAdaboost; -Theyarerelativelyrobusttooutliersandnoise; - Theyarefasterthanbaggingorboosting;
-Theygiveinternalestimatesoferror,strength,correlation,and variableimportance;
-Theyaresimpleandthetreescanbegrowninparallel. Therearefourdifferentlevelsofdiversitywhichweredefined in[27],level1beingthebestandlevel4theworst.
!Level1:nomorethanoneclassifieriswrongforeachpattern. !Level2:themajorityvotingisalwayscorrect.
!Level3:atleastoneclassifieriscorrectforeachpattern. !Level4:allclassifiersarewrongforsomepattern.
RF canguarantee that at least level two is reached.In fact, a trained treeisonlyselectedtocontributeinthevotingifitdoesbetterthan random,i.e.,theerrorrategenerated bythecorrespondingtree has to be lessthan0.5, or thetree willbedropped from theforest[4].Finally, in[31],Verikasetal.arguethatthemostpopularclassifierslike SupportVectorMachineprovidetoolittleinsightaboutthevariable importancetothederivedalgorithm.Theycomparedeachofthese methodologiestotherandomforestalgorithmtofindthatinmost casesRFoutperformothertechniquesbyalargemargin.
This general discussion emphasizes that Random Forests shouldbeconsidered inthe contextofPHM based onwireless sensornetworksdata[10],andthat,duetotheirrobustnessand accuracy, they are real alternatives to state-of-the-art PHM algorithms.Toillustratethispointbyanexperimentalcomparison betweenrandomforestsandalgorithmsusuallyusedfordiagnosis
Fig.7.Errorinhealthestimationforclustertopologywithclosestaggregator.
such asAdaboost andSVM, anewseriesofsimulationswillbe conductedinthesectionbelow.
5.2.Experimentalcomparison
Onceagain,weconsiderthatdataaregatheredbythemeanofa wireless sensor networkin which sensor nodes have a limited lifetime, andstrategies are deployedtooptimizethenetwork's lifetimelikedataaggregationandhop-by-hoprouting.Datahave beengeneratedbyoursimulatorasdetailedinSection4.1.Aswe takeplaceinaWSNcontext,weconsideredthatsomenodesofthe network are specifically designed toaggregate data fromtheir neighboringsensor.200terminalnodeshavebeendeployed,and 16 aggregatorshavebeen added.Theyhave beenlinkedtothe closestterminalnodesaccordingtotheK-meanmethod.Ateach
timeanaggregatorreceives3values,itcomputestheiraverageand transmitsittowardsthesink.
Situations2and3ofSection4.1havebeentested,dependingon whethereachaggregatorsendsitsaveragedvaluesdirectlytothe sink,ortothenearestaggregatorthatisclosertothesink.Notethat thislastsituationreducesthetransmissioncost(thusenlargingthe networks’lifetime),butdataarrivedtothesinkaremoreaveraged. Inaddition,allthesensorshavelimitedbatteriesthataredrained overtimeduetodatatransmission;theyarespreadrandomly,if weexceptthattheaggregatorsarewellpositionedthankstothe useofK-means.Asaconsequence,thesensorsdieoneafterthe otherastimegoesby,impactingtheevolutionofthenumberof sensorshavingdetectedafailure.
AfailureisrandomlysimulatedaccordingtoaPoissonlaw.This failuredisruptstheindustrialsystemfromclosetoclose,andthus
Fig.8. Delayinfailuredetectionwithrespecttothenumberofsimulations.Xvaluerepresentsthesizeofthelearningset,whileYvalueistheaveragederrorbetweenrealand
predictedRULs.Standarddeviationsareprovidedtoo.
Fig.9. Errorrateinhealthassessmentwithrespecttothenumberofsimulations.Xisagainthesizeofthelearningset,whileYvaluemeasuresthetoo-earlyvs.too-late
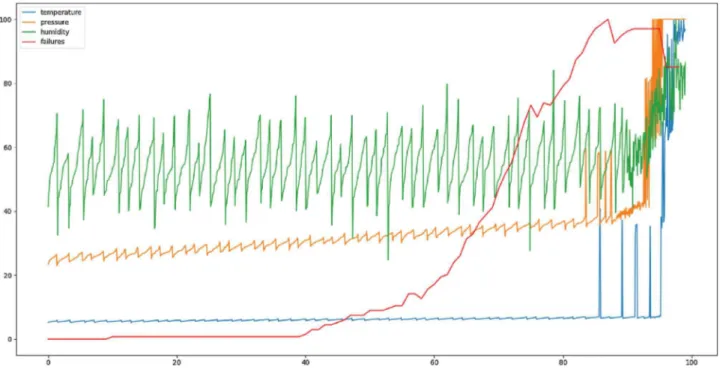
thenumberof sensorsdetectingaberrant valuesincreasesover time.Inspiteoftheaggregationprocess,thisincreaseisclearly observed at the sink level when the aggregators send their averages directly(Situation 2,see Fig.11), buttendstobe less apparentwhentheaveragesareagainaggregatedduringcluster routing(Situation3,seeFig.12).
Variousexperimentshavefinallybeenconductedtocomparethe abilityofRandomForests to accuratelypredictafailure toother machinelearningapproachesproposedinthePHMliterature.The followingregressorshavebeenselectedinthissetofexperiments, becausetheyarefrequentlyconsideredforprognosticsandhealth management:asimplebaggingofdecisiontrees,thesupportvector machine,AdaBoost,GradientBoosting,andmultinomialNaiveBayes. Scikit-Learn[25]libraryhasbeenusedtoimplementthemachine learningalgorithms ondataprovidedbyour WSNsimulator.No modification of the hyperparameter default values has been performed,dueto the “meaningfuldefaultvalues” conceptionof
thislibrary:Scikit-Learnprovidesreasonabledefaultvaluesformost parameters,makingiteasyandfasttocreateabasicandoperational machinelearningsystem.ThisisalsothecaseforRandomForests,for whichnohyperparameteroptimizationhasbeenperformedhere, allowinganunbiasedcomparisonofthevariousapproaches(seethe nextsectionforameasureofperformanceincreasewhenimproving thehyperparameterselection).
Ateachtime,theobjectivewastopredictthenumberofsensors thatdetecteda failurefromtheaggregateddatareceivedatthe sink.Indoingso,weobtainaregressorcapableofevaluatingthe severityofafailure,andwecaneasilymakeaclassifierbylooking atwhetherthisnumberisstrictlypositive(thereisabreakdown) orzero(thereisnobreakdown).Thesimulatorhasbeenlaunched severaltime, andNvaluescollected atthesinklevelhavebeen randomly picked fromthis basis of knowledge. Thenumber of timesthePoissonlawhasreturnedanewfailurewithinsensors hasbeen stored tooas the objectivefunction: theexplanatory variablesarethephysicaldatacapturedandaggregated,andthe variabletobeexplainedisthenumberoffailures.WetestedfortyN valuesequallydistributedintheinterval[0,1000],toseeifthe regressionerrordecreaseswhenthebasisofknowledgeincreases. Finally,80%ofthesevariableshavebeenusedfortraining,andthe 20%remainedvaluesforevaluationduringthetestingstage.
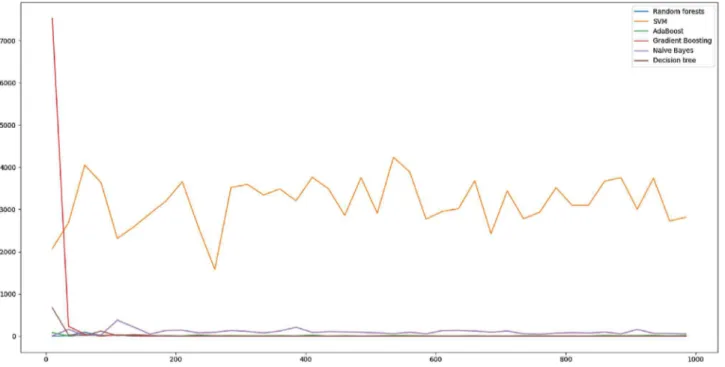
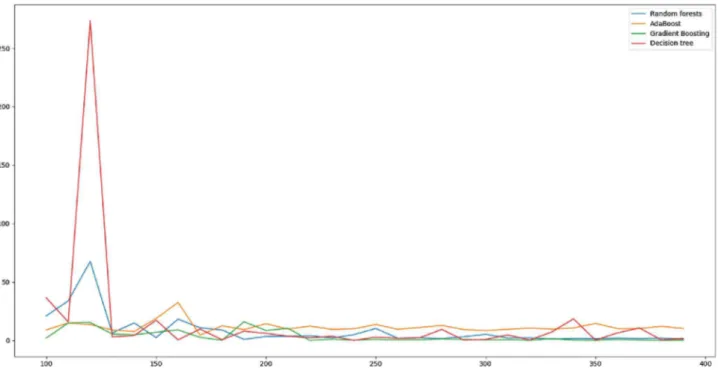
AscanbeseeninFig.13,boththeNaiveBayesandSVMfailto reducetheregressionerrorinSituation3,evenwiththelargest basisofknowledge.ThesamestatementholdsforSVMeveninthe simplercaseofSituation2,ascanbeseeninFig.14.Obviously,the supportvectormachinefailstolearnhowtopredicttheseverityof thefailure,duetothefactthatdatahavebeenaveragedonsome nodesinthenetwork,andthesameconclusioncanbedrawn,toa lesserextent,fortheNaiveBayesmethod.Inotherwords,theuse ofthesemethodsforprognosticandhealthmanagementmustbe seriously discussedin casethedata areacquiredvia awireless sensornetwork:energysavingstrategiesusuallydeployedinsuch networks can strongly impact their ability to make good predictions.
The four other machine learning algorithms reach good predictionscoresintestingphasewhenasingleaggregationstage isperformed,asshowninFig.15.However,AdaBoostpredictions
Fig.10.Numberofsuccessfulhealthassessmentswithrespecttothenumberof
trees:theaccuracyincreaseswiththeforest.
are worse when several aggregation layers are made in the network, and the bagging of decision trees loses stability, as illustratedinFig.16.Tosumup,onlyGradientBoostingwasableto performaswellasRandomForests,inthecontextofadiagnostic on data gathered by a wireless sensor network embedding aggregationlayers.
5.3.Hyperparameteroptimization
ThenumberoftreesisnottheonlyparametertooptimizeinRF, andtheregressionerrorcanbegreatlyreducedbyplayingonits manyparameters.ToillustratethisfactinaPHMscenario,wehave consideredthefollowingparameters:
! maxdepth:themaximumdepthofthetree.
! maxfeatures:thenumberoffeaturestoconsiderwhenlooking forthebestsplit.
! minsamplessplit:theminimumnumberofsamplesrequiredto splitaninternalnode.
!minsamplesleaf:theminimumnumberofsamplesrequiredtobe ataleafnode.
The integer search interval has been defined as follows: between1and10forthemaxdepthhyperparameter,between1 andthetotalnumberoffeaturesformaxfeatures,between2and 1000forminsamplessplit,andfinallybetween1and100formin samplesleaf.Thesamedatasetasintheprevioussectionhasbeen
Fig.12.Failuresatsinklevelwhenaggregateddataaresentfromaggregatorstoaggregatorstowardsthesink.
considered,andithasbeenseparatedagainaslearningandtesting sets(80%and20%,respectively).
Variousstrategies are possible toachieve a hyperparameter optimizationoftheregressionerrorinrandomforests.AsGBand RFprovedtobebothfinalistsinthepreviousevaluation,wehave considered here a mix of the two methods: gradient boosted regressiontreeshavebeenusedforRFhyperparameterselection, inwhich themodel is improvedby sequentiallyevaluatingthe scorefunctionatthenextbestpoint,therebyfindingtheoptimum withasfewevaluationsaspossible.Thesequentialoptimization hasbeencalled100timesandtheoptimumhasbeenreachedin35
iterations, leading to a minimum of the mean absolute error betweenrealandpredictednumberoffailuresequalto0.1406.Best parameters are respectively equal to 10 (max depth), 4 (max features),2(minsamplessplit),and1(minsamplesleaf).Obtained convergence curve is depicted in Fig. 17, leading to a real improvementof RFperformance toachieve reliablediagnostics ondatacollectedwithinaWSN.
Forthesakeofcompletenessandfairness,thishyperparameter optimizationhasbeenperformedtoointhecaseofSVM(penalty parameter C of the error term), AdaBoost (learning rate and maximumnumberofestimatorsatwhichboostingisterminated),
Fig.14.Comparisonofmeanabsoluteregressionerrorintestingphase,forvariousmachinelearningalgorithmsinSituation2.
CART (max depth of the tree, minimum number of samples required to split an internal node, and minimum number of samplesrequiredtobeataleafnode),andgradientboosting(max depth, learningrate,numberofboostingstages toperform,and minimumnumberofsamplesrequiredtosplitaninternalnode). TheoptimizationhasbeenperformedviaaBayesianoptimization usingGaussianProcesses,witharelevantsearchspacedepending ontheconsideredregressor,and100iterations.Obtainedresults arecomparedintermsofRootMeanSquaredError(RMSE),Mean Absolute Error (MAE), and Mean Absolute Percentage Error (MAPE); they are provided in Table 2. As can be seen, the ensemble-basedregressorscanbereallyoptimized,insuchaway
that they outperform the SVM. Note that random Forests and Gradientboostinghaveobtainedinaveragethebestresults.
Fig.16.Comparisonofmeanabsoluteregressionerrorintestingphase,forthebestmachinelearningalgorithmsinSituation3.
Fig.17. ConvergenceofmeanabsoluteerrorfunctionduringRF'sparametersoptimization(numberofcallsinabscissa).
Table2
ComparisonofbestRootMeanSquaredError(RMSE),MeanAbsoluteError(MAE),
andMeanAbsolutePercentageError(MAPE)afterhyperparameteroptimization.
Regressor RMSE MAE MAPE
GradientBoosting 0.6602 0.1282 0.0091
AdaBoost 0.7885 0.3153 0.0091
CART 2.5494 1.8418 0.2693
SVM 59.7767 39.6415 2.6860
Toputitinanutshell,inthecasewhereprognosticandhealth managementisbasedondatagatheredthroughawirelesssensor network,thepredictionoftheRULshouldbebasedonRandomForest regression. This is for the following reasons. First of all, many regressionalgorithmsareincompatible withthe typeoffeatures producedbysuchnetworks.Indeed,dataaggregationandscheduling policies,andthedepletionofsensorbatteries,causefeaturevectorsto have variable sizes over time. However, most machine learning techniques(SVM,neuralnetworks...)areincompatiblewiththese variablefeaturevectorsizes.Ontheotherhand,oursimulationshave shownthat,evenifthesefeaturevectorsremainfixedinsize,the performanceofrandomforestsisbetterthanthatoftheusualfault prediction techniques, for the various metrics considered, and whetherornotthereishyperparameteroptimization.
6.Conclusions
Inthis paper,weproposedtherandomforests algorithmfor diagnosticswhentheindustrialdeviceismonitoredbyawireless sensor network. When the gathered data is incomplete, the algorithmadaptsquicklytothechangeandcontinuestodeliver reliable diagnostics. We also illustratedthe impact of network topology on the quality of information at the sink level, by comparingtwoclustertopologiestothestarone.Weshowedthat organizing the network in clusters helps preserve the overall energybutreducesthequalityofdatausedfordiagnostics.Wealso showedthatreducingthedistanceofpackettransfermayimpact theresults.Therelevanceofrandomforestsinsuchsituationsis explainedandRFiscomparedtostate-of-the-artPHMalgorithms. Numerical experiments show that some of the latter have an obviouslossofaccuracywhendataareprovidedbyaWSN,which isthecaseforinstanceofthesupportvectormachines.
Thisgoodperformanceoftherandomforestsfordiagnosticsin awirelesssensornetworkcontexthashoweverbeenobtainedonly through simulations and qualitative discussion, which is a limitationof this researchwork.A real implementationof this algorithminadeployedWSNshouldbeoperated,toreinforcethe confidence putin RF for diagnostics in such kindof networks. Anotherlimitationofthisstudyisthatonlydiagnosticsaspectsof PHMhavebeenconsidered.Thisiswhy,infuturework,weintend todevelopaprognosticapproachtakingintoconsiderationallthe constraintsdiscussedinthis paper.Wealsointendtostudythe dependabilityofwirelesssensornetworkstoimprovebothenergy consumptionandthequalityofdataatthesinklevel.Theeffectsof an accurate feature selection on the performance of the aforementionedalgorithmswillbefinallyinvestigateddeeply.
With the financial support of the EU (Feder) and the Swiss Confederation within the framework of the Interreg France-Switzerlandprogramme,andtheLabexACTIONone(contract ANR-11-LABX-01-01).
References
[1]JacquesM.Bahi,WiemElghazel,ChristopheGuyeux,MohammedHaddad, MouradHakem,KamalMedjaher,NoureddineZerhouni,Resiliencyin distributedsensornetworksforprognosticsandhealthmanagementofthe monitoringtargets,Comput.J.59(2)(2016).
[2]JacquesM.Bahi,ChristopheGuyeux,AbdallahMakhoul,CongducPham,Low costmonitoringandintrudersdetectionusingwirelessvideosensornetworks, Int.J.DistributedSens.Netw(2012).
[3]LeoBreiman,Baggingpredictors,Mach.Learn.24(1996)123–140. [4]LeoBreiman,Randomforests,Mach.Learn.45(2001)5–32.
[5]DavidW.Carman,PeterS.Kuus,BrianJ.Matt,Constraintsandapproachesfor distributedsensornetworksecurity.Technicalreport,NAILabs,TheSecurity ResearchDivision,NetworkAssociates,Inc,Glenwood,2000September. [6]E.Chavez,S.Dobrev,E.Kranakis,J.Opatrny,L.Stacho,H.Tejeda,J.Urrutia,
Half-spaceproximal:anewlocaltestforextractingaboundeddilationspanner., InternationalConferenceOnPrinciplesofDistributedSystems,Pisa,Italy, 2006,pp.235–245.
[7]F.Chiti,A.DeCristofaro,R.Fantacci,D.Tarchi,G.Collodo,G.Giorgett,A.Manes, Energyefficientroutingalgorithmsforapplicationtoagro-foodwireless sensornetworks.,IEEEInternationalConferenceonCommunication(ICC), Seoul,Korea,2005,pp.3063–3067.
[8]ThomasG.Dietterich,Anexperimentalcomparisonofthreemethodsfor constructingensemblesofdecisiontrees:Bagging,boosting,and
randomization,Mach.Learn.40(2000)139–157.
[9]WiemElghazel,Jacques Bahi,ChristopheGuyeux,MouradHakem,Kamel Medjaher,NoureddineZerhouni,Dependabilityofwirelesssensornetworks forindustrialprognosticsandhealthmanagement,Comput.Ind.68(2015)1– 15.
[10]WiemElghazel,KamalMedjaher,NoureddineZerhouni,JacquesBahi,Ahmad Farhat,ChristopheGuyeux,MouradHakem,Randomforestsforindustrial devicefunctioningdiagnosticsusingwirelesssensornetworks.,2015IEEE Aerospaceconference,IEEE(2015)1–9.
[11]AhmadFarhat,ChristopheGuyeux,AbdallahMakhoul,AliJaber,RamiTawil, Onthecoverageeffectsinwirelesssensornetworksbasedprognosticand healthmanagement,Int.J.Sens.Networks(IJSNET)28(2)(2018)125–138. [12]FumeraGiorgio,FabioRoli,Atheoreticalandexperimentalanalysisoflinear
combinersformultipleclassifiersystems,IEEETrans.PatternAnal.Mach. Intelligence27(6)(2005)942–956.
[13]K.Gabriel,R.Sokal,Anewstatisticalapproachtogeographicvariationanalysis, Syst.Zool.18(1969)259–278.
[14]WendiRabinerHeinzelman,AnanthaChandrakasan,HariBalakrishna, Energy-efficientcommunicationprotocolforwirelesssensornetworks.,IEEE ProceedingsoftheHawaiiInternationalConferenceonSystemSciences, January4-7,2000.
[15]AiwinaHeng,ShengZhang,AndyC.C.Tan,JosephMathew,Rotatingmachinery prognostics:Stateoftheart,challengesandopportunities,Mech.Syst.Signal Process.23(2009)724–739.
[16]TinKamHo,Therandomsubspacemethodforconstructingdecisionforests, IEEETrans.PatternAnal.Mach.Intell.20(8)(1998)832–844.
[17]P. Jacques, R. Seshagiri, T.V. Prabhakar, H. Jean-Pierre, H.S. Jamadagni, Commonsensenet:awirelesssensornetworkforresource-pooragriculture inthesemiaridareasofdevelopingcountries,Int.J.Inform.Technol.4(1) (2007)51–67.
[18]AndrewK.S.Jardine,DamingLin,DraganBanjevic,Areviewonmachinery diagnosticsandprognosticsimplementingcondition-basedmaintenance, Mech.Syst.SignalProcess.20(2006)1483–1510.
[19]Yan Jina, Ling Wanga, Yoohwan Kimb, Xiaozong Yanga, EEMC. An energyefficientmulti-levelclusteringalgorithmforlarge-scalewireless sensornetworks,Comput.Netw.52(2008)542–562.
[20]A.H.Kabashi,J.M.H.Elmirghani,Atechnicalframeworkfordesigningwireless sensornetworksforagriculturalmonitoringindevelopingcountries., InternationalConferenceonNextGenerationMobileApplications,Services andTechnologies(NGMAST),2008,pp.395–401.
[21]L.K.Kait,C.Z.Kai,R.Khoshdelniat,S.M.Lim,E.H.Tat,Paddygrowthmonitoring withwirelesssensornetworks.,ConferenceonIntelligentandAdvanced Systems(ICIAS),KualaLumpur,Malaysia,2007,pp.966–970.
[22]W.Ke,W.Liqiang,C.Shiyu,Q.Song,Anenergy-savingalgorithmofwsnbased ongabrielgraph.,In5thInternationalConferenceonWireless
Communications,NetworkingandMobileComputing(WiCOM),Beijing, China,2009,pp.1–4.
[23]SoonmokKwon,JaeHoonKo,JeongkyuKim,CheehaKim,Dinamictimeoutfor dataaggregationinwirelesssensornetwoks,Comput.Netw.55(2011)650– 664.
[24]D. Matula,R. Sokal,Properties of gabrielgraphs relevant to geographic variationresearchandtheclusteringofpointsintheplane,Geogr.Anal.12(3) (1980)205–222.
[25]Fabian Pedregosa,Gaël Varoquaux, Alexandre Gramfort, Vincent Michel, BertrandThirion,OlivierGrisel,MathieuBlondel,PeterPrettenhofer,Ron Weiss,VincentDubourg,etal.,Scikit-learn:Machinelearninginpython,J. Mach.Learn.Res.(2011)2825–2830.
[26]Robert E.Schapire,Abrief introduction toboosting., Proceedings ofthe SixteenthInternationalJointConferenceonArtificialIntelligence(1999). [27]A.Sharkey,N.Sharkey,Combiningdiverseneuralnets,KnowledgeEng.Rev.12
(3)(1997)231–247.
[28]IgnacioSolis,KatiaObraczka,Theimpactoftimingindataaggregationfor wirelesssensornetworks.,ProceedingsoftheIEEEInternationalConference onCommunications(2004)3640–3645.
[29]Alexey Tsymbal, Seppo Puuronen, Bagging and boosting with dynamic integrationofclassifiers.,4thEuropeanConferenceonPrinciplesand PracticeofKnowledgeDiscoveryinDataBasesPKDD(2000)116–125. [30]K. Tumer, J. Ghosh, Error correlation and error reduction in ensemble
classifiers,ConnectionSci.8(1996)385–404.
[31]A.Verikas,A.Gelzinis,M.Bacauskiene,Miningdatawithrandomforests:A surveyandresultsofnewtests,PatternRecognit.44(2011)330–349. [32]W.Yang,H.Liusheng,W.Junmin,X.Hongli,Wirelesssensornetworksfor
intensiveirrigatedagriculture.,ConsumerCommunicationsandNetworking Conference(CCNC),LasVegas,NV,USA,2007,pp.197–201.
[33]S.Yoo,J.Kim,T.Kim,S.Ahn,J.Sung,D.Kim,A2s:automatedagriculturesystem basedonwsn.,IEEEInternationalSymposiumonConsumerElectronics(ISCE), Dallas,TX,USA,2007,pp.1–5.
[34]Hamed Yousefi, Mohammad Hossein Yeganeh, Naser Alinaghipour, Ali Movaghar,Structure-freereal-timedataaggregationinwirelesssensor networks,Comput.Commun.35(9)(2012)1132–1140.