Science Arts & Métiers (SAM)
is an open access repository that collects the work of Arts et Métiers Institute of
Technology researchers and makes it freely available over the web where possible.
This is an author-deposited version published in:
https://sam.ensam.eu
Handle ID: .
http://hdl.handle.net/10985/17917
To cite this version :
Mickaël PAYET, Loïc MARCHETTI, Michel TABARANT, François JOMARD, Jean Pierre
CHEVALIER - Corrosion mechanisms of 316L stainless steel in supercritical water: The significant
effect of work hardening induced by surface finishes - Corrosion Science - Vol. 157, n°1,
p.157-166 - 2019
Any correspondence concerning this service should be sent to the repository
Administrator :
archiveouverte@ensam.eu
Corrosion mechanisms of 316L stainless steel in supercritical water: The
signi
ficant effect of work hardening induced by surface finishes
Mickaël Payet
a,b,c,⁎, Loïc Marchetti
b,d, Michel Tabarant
e, François Jomard
f,
Jean-Pierre Chevalier
a,gaConservatoire National des Arts et Métiers, Matériaux industriels, 292 rue Saint-Martin, F-75141, Paris cedex 3, France bCEA, DEN, DPC, SCCME, Laboratoire d’Étude de la Corrosion Aqueuse, F-91191, Gif-Sur-Yvette Cedex, France cCEA Cadarache, IRFM, F-13108, Saint-Paul-lez-Durance, France
dCEA, DEN, DE2D, SEVT, Laboratoire d’étude du Comportement à Long Terme des Matériaux de conditionnement, F-30207, Bagnols-sur-Cèze, France eCEA, DEN, DPC, SEARS, Laboratoire d’Ingénierie des surfaces et lasers, F-91191, Gif-Sur-Yvette Cedex, France
fCNRS, Groupe d’Etude de la MAtière Condensée, F-78035, Versailles, France
gPIMM, UMR 8006 Arts et Métiers ParisTech/Cnam/CNRS, 151 Bd de l’Hôpital, F-75013, Paris, France
A R T I C L E I N F O
Keywords: A. Stainless steel B. SEM B. SIMS
C. High temperature corrosion C. Selective oxidation C. Hardening
A B S T R A C T
The oxidation of 316 L stainless steel in hydrogenated supercritical water at 600 °C is strongly dependent on the effects of work hardening induced by surface finishes. The oxide scale formed under these conditions is always double-layered with an external layer of Fe-rich oxides. However, when a hardening threshold is reached, a switch in oxidation mechanisms leads to a considerable thinning of the oxide scale. This thinning results from the formation of a Cr-rich internal oxide layer that acts as a diffusion barrier against ionic species responsible for its growth but also against Fe cations implied in the external layer growth.
1. Introduction
The critical point of water is 374 °C and 22.1 MPa. Above these conditions, no phase transformation occurs and the physical properties of supercritical water (SCW) change continuously. For instance, the dissociation capacities of SCW are useful for organic waste treatment. SCW is also of interest for energy production owing to its strong thermal capacity and as the efficiency of a power plant working with a water cycle increases with the temperature reached in the hot phase of the process. This has led to the design of water cycle-based power gen-eration systems in which the temperature could reach 700 °C. Fe-Ni-Cr alloys are expected to be natural candidates as structural materials [1,2] in such application thanks to their strong mechanical properties. However, the lifetime of a Fe-Ni-Cr component could be a critical point for cost or safety reasons and especially in the case of nuclear appli-cations (i.e., generation IV concepts). Corrosion resistance levels con-tribute to this issue. Therefore, the corrosion of iron- and nickel-based alloys containing chromium in SCW has been studied in regards to potential supercritical water-cooled reactor (SCWR) applications [3–8]. The corrosion of austenitic stainless steels (SS) such as 316 or 304 has been studied at different temperatures under SCW conditions [7,9–11]. Oxide scales formed under these conditions are generally
described as having a double-layered structure. The external layer is rich in iron whereas the internal layer is enriched in chromium. This description reflects that reported for austenitic SS exposed to subcritical water at lower temperatures (roughly 300 °C) [12–14]. Nevertheless, there is usually a strong difference in thickness between scales formed in subcritical water (a few tens of nanometers) [12–14] and in SCW (a few tens of micrometers) [3,7,10,11].
In these two types of media, it is well known that the structure and thickness of the oxide scale can be strongly affected by surface pre-parations applied prior to medium exposure whether in the case of Fe-[7,14–19] or Ni-based alloys [8,20,21]. Under SCW conditions, Tan et al. [19] observed the beneficial influence of shot-peening on the
oxidation of alloy 800 H at 500 °C and 25 MPa in comparison to results obtained from polish samples. These authors found that the thickness of the oxide scale is reduced by a factor of roughly two due to chromia formation enhancement by shot-peening treatment. This effect is even more significant in the case of SS. Yuan et al. [7] have found that the thickness of the oxide layer formed on 304H in SCW at 700 °C is re-duced by a factor of roughly 13 between sandblasted and polished samples. They also attribute this result to the formation of a chromia scale resulting from an increase in the number of short circuit paths for Cr diffusion and in nucleating site density in the alloy subsurface due to
⁎Corresponding author at: CEA Cadarache, IRFM, F-13108, Saint-Paul-lez-Durance, France. E-mail address:mickael.payet@cea.fr(M. Payet).
surface deformation. Yuan et al. [7] have observed this beneficial effect
of SS surface deformation for relatively short exposure durations (50 h), raising questions regarding the durability of this phenomenon for longer exposure times consistent with the lifetime of components for industrial applications. The aim of this paper is thus (i) to study the impacts of surfacefinishes on the corrosion behaviours of 316 L SS in SCW up to exposure periods of several thousand hours and (ii) to better understand mechanisms responsible for this effect.
2. Materials and methods 2.1. Corrosion tests
Previous studies [8,22,23] have shown that the dissolution of me-tallic cations occurs in SCW. A specific device was used in this work to limit the contamination of samples studied due to autoclave material dissolution. The setup is described elsewhere [8] and consists of a heater and a specific mini-autoclave for each kind of testing material. Each mini-autoclave is a closed and static system in which all the sur-faces in contact with the medium (i.e. the mini-autoclave itself and all the components inside) are made from the same alloy grade. This de-vice thus limits coupling effects during corrosion experiments.
The tested 316 L SS was exposed to 600 °C and 25 MPa (extreme conditions expected for SCWR) for different exposure periods ranging from 335 h to 3380 h. Before corrosion testing, ultrapure water (18.2 × 10⁴Ω∙m) was degassed through H
2bubbling and was injected
into a mini-autoclave [8]. Under these conditions, the initial molar ratio of dissolved H2in H2O does not exceed 10−3but reaches approximately
10-2during testing due to the rapid corrosion of 316 L SS under the
investigated conditions (see Section3).
In one mini-autoclave, a two-staged corrosion experiment was performed to study the transport of oxygen through the oxide scale. The first stage was performed with natural water (18O to16O ratio of
ap-proximately 0.002) for 760 h. The mini-autoclave was then bled under pressurized Heflow and then refilled with water (degassed by H2as for
thefirst stage) enriched with18O (18O to16O ratio of approximately
0.11) following procedures detailed elsewhere [8]. The duration of the second corrosion stage was set to 308 h, which is relatively long com-pared to the former. This aims to focus on the characterization of oxide growth mechanisms rather than diffusion coefficient measurements [24].
2.2. Materials and surfacefinishes
The case of 316 L was studied in this paper because this commercial stainless steel is widely used and studied, especially in the nuclearfield. This is a solution-hardened alloy with a low carbon content that limits carbide formation. Mini-autoclaves were machined from a 316 L SS bar and coupons of 20 × 30 mm² were cut from a 316 L SS sheet; the composition of each is given inTable 1. In each case, the alloy grain size is about 20–30 μm. Before corrosion tests, each coupon or autoclave was degreased and cleaned with an ethanol/acetone mixture in an ul-trasonic bath.
Four types of surface finishes were examined. Polished samples, noted as P in the following, serve as a reference surface state in this study. P samples were polished to limit subsurface work hardening and
surface roughness. They werefirst wet grounded using SiC papers of grades 600–2400, then polished with 3 and 1 μm diamond pastes and finally with 0.04 μm colloidal alumina suspension. The arithmetic roughness Raresulting from this polishing method was measured as
equal to 0.02μm. In each experiment, P samples were exposed as coupons and as one of the twoflat parts of the mini-autoclave (either the top or the bottom). The otherflat part of the mini-autoclave re-mained in its as-received state and is referred to as the M sample, as autoclaves were shaped via milling. M surfaces are then characterized by high work hardening and roughness (Ra=0.7μm) levels. As surface
finishes achieved by machining are not easily duplicated from one study to another, a second hardened state referred to as S and which is supposedly more reproducible was prepared by shot-peening (per-formed on coupons) for comparative purposes. Using the same pre-paration technique, the roughness of S coupons was expected at roughly 1μm from published data [25]. Although, measurements lead to Ra
between 1.6–1.8 μm. For M and S samples, a high level of subsurface work hardening is necessarily associated with a high level of surface roughness. To study hardening effects by overcoming roughness effects, SP coupons were prepared to achieve a low roughness level by pol-ishing S samples using the same method as that applied to the P samples avoiding the steps with coarse SiC papers. Some waviness remain and the roughness was, roughly, Rabetween 0.3 to 0.7μm.
To characterize the subsurface hardening states of the P, M, S and SP samples, Vickers hardness profiles were recorded on each type of sample using a microintender from CSM Instruments. The profiles were carried out on cross-sections prepared with caution as performed in previous work [8]. A low cutting rate and an adapted polishing treat-ment including a 0.04μm colloidal alumina suspension finish limit ef-fects of stress or strain during these steps. Hardness profile measure-ments were performed 3 times on each sample using the Oliver and Pharr method [26]. A sufficient distance between indentations was respected to prevent interferences between two successive measure-ments. The results show that each measurement series on a sample exhibit the same tendencies with a standard error of approximately 10%.
Fig. 1presents profiles obtained from the P and M samples as a
function of the depth to the sample surface. The hardness of the P sample is constant at approximately 280 HV from the surface to the bulk. This value corresponds to the bulk hardness of the studied alloy. For the M sample, the hardness is much higher near the surface (450 HV) as was expected and decreases when the depth increases until it reaches the bulk value. This indicates that the work-hardened zone along the M samples is approximately 30μm deep. The difference be-tween the M and P samples reveals an efficient reduction of subsurface hardening due to polishing. As M samples, S and SP samples present a decreased level of hardness from the surface to the bulk (Fig. 1). The near surface hardness reaches a value of 520 HV for the S samples but only a value of 400 HV for the SP samples. The associated affected depths are roughly 55μm and 45 μm, respectively, for the S and SP samples. Finally, the samples can be classified with respect to their near surface hardness values h in ascending order as follows: hP< hSP< hM< hS.
Table 1
Studied alloy content.
Samples Elements (wt. %)
Ni Cr Fe C Mo Mn Si S P N
Coupon 11.09 17.52 67.56 0.021 2.04 1.23 0.54 0.001 0.029 0.057
2.3. Oxide scale characterizations
To carry out a detailed analysis of oxide scales formed during the corrosion tests, several characterization techniques were used. The morphology of the oxide layer was studied using both surface and cross-sectional views by field-emission gun scanning electron microscopy (FEG-SEM Zeiss ultra 55). The oxide chemical composition was char-acterized by glow discharge optical spectrometry (GDOS) using a GDProfiler developed by Horiba-Jobin Yvon. The structure of the oxide scale was analyzed by X-ray diffraction (XRD) using a X’Pert MPD de-veloped by Panalytical and via Raman spectroscopy using an Invia Reflex® Renishaw spectrometer coupled with an Olympus microscope. Isotopic analyses dedicated to the characterization of oxide scales formed during the two-stages corrosion experiment were performed by secondary ion mass spectrometry (SIMS) using a CAMECA IMS 4f. SIMS analyses were performed using a Cs+ion beam at 10 keV with a
ne-gative sample polarization level of−4500 V. Therefore, the ion beam energy level reached a value of 14.5 keV. Finally, crater depths were measured using a profilometer Dektak 8 from Bruker to estimate the
3. Results
3.1. Oxide scale formed on polished samples
This section presents characterizations performed on the oxide scale formed on P samples that serve as a reference surface state for ex-amining the impacts of surfacefinishes on the corrosion of 316 L SS in hydrogenated SCW (detailed in subsection3.2.). Native oxidefilm be-fore corrosion test is characterized by glow discharge optical spectro-metry (not shown here). The thickness is approximately 4 nm and the oxidefilm is double-layered. The external part of the oxide film is very rich in Fe (roughly 70–80 wt. % of metallic species), whereas the in-ternal part is enriched with Cr relative to the 316 L SS content. In the internal part of the oxidefilm, the maximum Cr content reaches ap-proximately 40 wt. % of the metallic species. The visual observation of the samples after SCW exposure reveals a significant change: the mirror finish is transformed into a uniform dark grey (almost black) surface. This oxide layer was characterized in terms of morphology, composi-tion and structure.
3.1.1. Morphology, composition and structure
Regardless of the exposure times investigated, oxide scales formed on P samples during their corrosion in hydrogenated SCW present the same characteristics of those describe hereafter though not for oxide thicknesses. Surface observations performed by SEM show a homo-genous surface with two kinds of zones (Fig. 2). Large bumps composed of oxide grains ranging from 2 to 5μm size and often with a hole in their core (Fig. 2-a) contrast with some troughs in which oxide grains are smaller (less than 2μm in size, seeFig. 2-b). These two different zones correspond to differences in oxide layer thickness (Fig. 2-c). It is evident that trough zones indicate the presence of thinner oxide layers whereas bump zones point out the presence of thicker oxides.
The cross-section views also show a double-layered oxide scale (Fig. 2). The external layer is composed of columnar grains (Fig. 2-d) whereas the internal layer is more difficult to describe. SEM images of internal layers recorded for all of the P samples show the same con-trasting pattern as that presented in Fig. 2-e. As the cross-section is
Fig. 1. Comparison of hardness profiles obtained from the studied surface states before corrosion tests for the P, M, S and SP samples. The standard error of hardness measurements is estimated statistically at approximately 10% from the experimental measurements.
Fig. 2. SEM observations [secondary electron images performed at 5 kV] of P samples ex-posed to hydrogenated SCW at 600 °C and 25 MPa over 335 h (a, b and c) or 3380 h (d and e); (a) and (b) present surface views re-spectively showing large oxide grains formed above an ancient alloy grain and smaller oxide grains formed above an ancient alloy grain boundary zone; (c) shows a cross-sectional overview of the oxide scale whereas (d) and (e) show cross-sectional views focusing respec-tively on external and internal parts of the scale.
polished, this contrast seems due to secondary electrons of type I and consequently should correspond to a chemical contrast. Thus, the in-ternal layer could include a mix of different phases in which dark contrasts around previous alloy grain boundaries could denote higher levels of oxygen content than those in ancient bulk alloy grains (Fig. 2 -e). Nevertheless, a contrast resulting from differences in oxide grain orientations cannot be excluded. This last hypothesis could suggest that the oxide grain size in the internal layer should be of the order of magnitude of 30 nm.
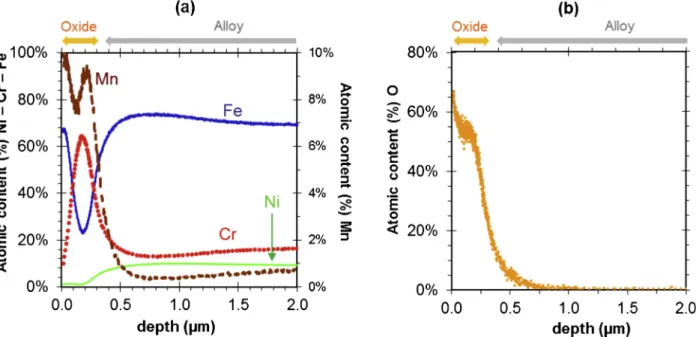
The GDOS composition profiles presented inFig. 3complement the description of the double-layered oxide scale. These profiles show that the external layer is mainly composed of iron and oxygen but contains a small amount of manganese. The correlated oxygen and iron plateaus suggest that this scale is composed of a homogeneous iron oxide. By contrast, the internal oxide layer is not homogeneous in composition and includes the main alloying elements. This scale is noticeably en-riched with Cr and Mn relative to the alloy bulk composition but Fe remains as its main metallic constituent. The presence of the main al-loying elements in the internal layer and a lack of major elements such as Cr and Ni in the external layer suggest that the interface between these two layers corresponds to the original alloy surface.
Our analysis of the oxide scale by XRD (Fig. 4) enabled us to identify the external layer as magnetite (JCPDSfile #00-019-0629). However, the external layer is too thick to allow for the characterization of the internal layer using this technique. The structure of the internal part of the scale was then characterized using cross-sections by Raman spec-troscopy. Raman spectra obtained for the external and internal layers are shown inFig. 5. Our comparison with the RRUFF database [27] agrees with XRD identifying the external layer as Fe3O4 with four
characteristic peaks at 673 cm−1, 567 cm−1, roughly 307 cm−1 and 204 cm−1. These are attributed to normal mode motions of the tetra-drahedron FeO4 corresponding to the tetrahedral site in the spinel
structure as noted by Shebanova et al. [28]. The 673 cm−1shift is at-tributed to the A1gmode which corresponds to the symmetric stretching
of oxygen atoms along Fe–O bonds. The asymmetric stretching of Fe and O noted for T2g(2) is observed at approximately 567 cm−1. The Eg
and the T2g(1) modes correspond to the less intense peak. Raman
spectra from the internal layer reveal only two peaks close to the A1g
and T2g(2) modes respectively shifted at 683 cm−1and 546 cm−1. Zinin
et al. [29] report the disappearance of T2g(1) peaks based on
con-centrations of titanium in Fe3-xTixO4. They also found slight shifts in the
peaks according to the Ti ratio. Here, Egand the T2g(1) modes likely
disappear in the internal layer as the chromium concentration in-creases. Considering the enrichment of Cr in the inner oxide layer re-vealing by GDOS, the hypothesis of a main oxide composed of a solid solution of Fe3-xCrxO4(with 0 ≤ x < 1) type could conveniently
de-scribe the slight evolution of Raman spectra from the external oxide layer to the internal oxide layer.
Major characteristics of the oxide layer formed on the 316 L po-lished samples during their exposure to hydrogenated SCW at 600 °C and 25 MPa can be summarized as follows. The total thickness of the oxide scale ranges from roughly 25μm–45 μm depending on the ex-posure period. This scale is double-layered. The external layer is porous and composed of columnar grains of magnetite containing a small amount of Mn. The internal one is composed of smaller equiaxed grains of Fe, Cr, Ni and Mn mixed spinel. This scale is enriched with Cr relative to the external layer and bulk alloy but not enough to be considered a Cr-rich oxide (e.g., chromite type spinel), as Fe remains as its main metallic constituent. However, due to contrasts found from the SEM observations, a mixture of phases in the internal layer cannot be ex-cluded. This last hypothesis could be consistent with results obtained by
Fig. 3. Atomic composition profiles recorded by GDOS on P samples exposed to hydrogenated SCW at 600 °C and 25 MPa: a) Fe, Cr, Ni and Mn profiles (normalized with respect to the total number of metallic elements at each point) recorded after 335 h of exposure and b) O profiles recorded for exposure periods of 335 h to 3380 h.
Fig. 4. XRD analyses performed in the θ/2θ mode on P sample exposed to hydrogenated SCW at 600 °C and 25 MPa for 335 h showing characteristics of magnetite Fe3O4from the external oxide.
Fig. 5. Raman spectra of Fe3O4 derived from the RRUFF database (ID #R060191) [27] and of a P sample exposed to hydrogenated SCW at 600 °C and 25 MPa.
Bischoff et al. [30] on oxide scales formed in SCW on 9% Cr steel, for which a mixture of oxides and alloys has been found via microbeam synchrotron radiation diffraction.
This description of the oxide scale structure formed on 316 L po-lished samples complements results reported in the literature on oxide layers formed on SS during their corrosion in SCW [3,6,7,23,31,32]. 3.1.2. Growth mechanisms
Ionic images of a cross-section and isotopic profiles were obtained by SIMS applied to P samples exposed during the two-staged corrosion experiment (Figs. 6 and 7). The ionic image showing the distribution of
16O (Fig. 6-d) and the associated profile (Fig. 7) show the part of the
sample containing16O, i.e., the whole oxide layer. Images of molecular ions of weights of 72 and 70 (Fig. 6-b and -e) and56Fe and52Cr profiles
(Fig. 7) complement previous characterizations. These results confirm the double-layered structure of the oxide scale with an external scale
composed of an Fe oxide whereas the internal layer is enriched with Cr relative to the external one. We note that52Cr and56Fe profiles drop
when the alloy matrix is sputtered because ionization efficiency levels decrease considerably in the metal under the selected analytical con-ditions. However, localizations of the internal/external oxide layer in-terface and of the internal oxide/alloy inin-terface can be estimated from increases and decreases of 50% in the52Cr signal, respectively. The ionic image showing the distribution of18O (Fig. 6-c) and the associated
profile (Fig. 7) show two enriched zones close to the external and in-ternal interfaces, respectively. These results show (i) that the magnetite scale extends outward but also (ii) that the internal layer expands as a result of anionic diffusion along a short circuit network [24] likely constituted by oxide grain boundaries. Moreover, a slight bump appears on the18O profile close to the interface between the two oxide layers. This could be the sign of the rapid transport of oxygen toward this interface consistent with the diffusion of water molecules through pores
Fig. 6. Cross-section observations of a P sample exposed to hydrogenated SCW (600 °C and 25 MPa) over a two-staged corrosion experiment (760 h in natural water followed by 308 h in water enriched with18O): a) SEM view [5 kV secondary electron images] of the zone analysed by SIMS after isotopic imaging and b), c), d) and e) secondary ion images respectively obtained from molecular ions of weights of 72 (56Fe +16O), 18 (18O), 16 (16O) and 70 (52Cr +18O).
of the external layer.
This last hypothesis is consistent with the1H SIMS profile, which shows an accumulation of hydrogen at the interface between the in-ternal and exin-ternal oxide layers (Fig. 7). This phenomenon is likely due to the reduction of protons from water molecules during the corrosion process and to their subsequent absorption. Moreover, after this peak close to the original alloy surface, the intensity of the 1H signal
in-creases with the sputtered depth from the oxide/alloy interface to the alloy bulk. The crossing of the oxide/alloy interface causes a global decrease in signal intensities for all of the species due to a drop in io-nization efficiency levels though not for1H. This causes the increase of 1
H/56Fe signal ratio recorded close to the interface in the alloy just beneath the oxide scale. Relative to that recorded for the matrix on the non-oxidized sample (approximately 2.09 × 10⁻²), this ratio increases until 2.02 × 10⁻¹at 38μm of depth (as shown inFig. 7), i.e. in the alloy just beneath the oxide scale. This accumulation of H in the alloy un-derlying the oxide scale has been also observed by Dumerval et al. in the case of 316 L SS corrosion in subcritical water at 325 °C [33]. 3.2. Impacts of surfacefinishes on the oxide scale formed during 316L corrosion in SCW
As performed on the P sample, the native oxide film was char-acterized for the S sample using GDOS. By comparison, the morphology and the composition are quite similar to the native oxide formed on P sample. However, the native oxide is thicker with approximately 30 nm on S sample. The oxidefilm is a double layer oxide: the external part is rich in Fe (approximately 70–80 wt. % of metallic species) and the in-ternal layer is enriched in Cr. Although the maximum Cr content is lower for the S ample to roughly 20 wt.% of the metallic species.
The hardness profiles of each sample permit to classify the near surface hardness of the sample as follow: hP< hSP< hM< hS. For
austenitic steels, the plastic deformation could lead to martensite for-mation [34–37]. This point was not verified here. Indeed, the annealing at 600 °C, during the corrosion test, would permit to restore the aus-tenite structure [34,35]. In any case, severe plastic deformations induce also defect in the microstructure. The hardening of the sample is probably due to a high defect density and a stress-induced martensite content in the near surface of the S and M specimens before corrosion test.
The visual observation of the SCW exposed samples shows clearly a difference between M samples and the others. M specimens present iridescent surface mainly coloured in violet, green or gold. SP and S coupons look like P sample: their surface are dark grey.
Fig. 8shows SEM surface images of the SP, S and M samples after
their exposure to hydrogenated SCW. The surface morphology of the oxide scale of the SP sample (Fig. 8-a) is similar to that observed for the P sample (Fig. 2-a), with oxide grains ranging from 3 to 5μm in size sometimes presenting a hole in their cores. The morphologies of oxide scales formed on S and M samples are quite similar (Fig. 8-b and -c) but are clearly different from those observed for the SP sample. They pre-sent oxide grains of approximately 0.5μm in size on average. We found some crystals (roughly 1μm in size) on the S sample that were larger than those observed on the M sample, but they were not found along the entire sample surface. These crystals were found on smaller grains of roughly 0.5μm in size.
In the same way, the cross-section views show that samples can be divided into two families (P and SP for the former and M and S for the latter) depending on oxide scale morphologies (Fig. 9). Moreover, the oxide thickness drops from more than 20μm for the P and SP samples to roughly 1μm for the M and S samples.
Strong decreases in the oxide thickness found (the reduction factor is greater than 20 between P or SP and M samples for similar exposure periods) are clearly due to effects of surface finishes, but one can wonder about the respective roles of subsurface work hardening and surface roughness. With respect to their roughness (see subsection2.2), samples can be divided into the same two families than those derived from SEM observations on oxide scales: polished (P and SP) samples exhibit low roughness values whereas unpolished (M and S) ones are significantly rougher. If the work hardening level reached in the sub-surface is used as a classification criterion rather than roughness levels, samples can be classified in ascending order as follows: P, SP, M and finally S (see subsection2.2). It is however the role of work hardening that seems to dominate surface finish effects. Indeed, cross-section observations of the M sample exposed to hydrogenated SCW for 3380 h (Fig. 10) reveals a 10μm deep zone of ultra-fine grains in the alloy underlying the oxide scale. The appearance of this recrystallized zone seems to denote that a sufficient level of subsurface work hardening caused a switch in oxidation mechanisms, as this type of recrystalliza-tion was not observed for the P and SP samples. For these samples, the original alloy grain boundary network can be observed from the in-ternal oxide layer (seeFigs. 6-a,9-a and -b).
Complementary data on thin oxide layers formed on M or S samples were obtained from our GDOS analyses (composition profiles per-formed on SP samples are not shown here as they are similar to those obtained from the P sample shown onFig. 3). Composition profiles
performed on an M sample exposed to hydrogenated SCW for 335 h are shown in Fig. 11. They reveal a double-layered oxidefilm but of a different scale than that observed for the P samples. The external layer is mainly composed of Fe but seems to also contain a small amount of Cr. By contrast, the internal layer is mainly composed of Cr (more than 60 at.% of the metallic elements) and contains iron. Its formation is associated with slight Cr depletion in the underlying alloy. A large amount of manganese (more than 9 at.% of the metallic elements) is observed in the two oxide layers relative to bulk alloy content levels (less than 2 at.%).
The X-ray diffractogram performed on the same M sample permitted the identification of 3 crystallographic structures (Fig. 12). Peaks as-cribed to the alloy are the most intense (JCPDSfile #00-033-0395), but a spinel component was also found. Comparisons of diffractograms recorded for the M and P samples show shifts of peaks due to the spinel structure. In agreement with the above shown composition profiles, these shifts are likely attributable to a change in the nature of the spinel formed (from magnetite in the P samples to a mixed spinel containing Fe, Cr and Mn in the M samples (peaks observed in the latter case match the JCPDSfile #01-089-3744 corresponding to Cr0.5Fe1.5MnO4)).
Fi-nally, chromia in the oxide layer formed on the M samples is also no-ticeable (JCPDSfile #01-084-1616).
Our comparison of composition profiles and XRD data seems to show that the external oxide layer formed during hydrogenated SCW exposure for sufficiently hardened samples of 316 L SS is composed of
Fig. 7. H, O, Cr and Fe profiles obtained by SIMS applied to a P sample exposed to hydrogenated SCW (600 °C and 25 MPa) over a two-staged corrosion ex-periment (760 h in natural water followed by 308 h in water enriched with 18O); intensities of1H,18O,52Cr and56Fe signals are multiplied respectively by 1500, 10, 200 and 40.
ferrite-type mixed spinel containing Mn and Cr in addition to Fe. The presence of chromia in the internal layer formed on these samples is also clearly evidenced by XRD but composition profiles show that Cr2O3
cannot be the sole oxide constituting the internal scale. From these two sets of data, this scale seems to include a mixture of chromia and chromite-type mixed spinel containing Mn and Fe in addition to Cr.
It can be noticed also that no relevant sign of martensite was ob-served on the X-ray spectra after corrosion test on M or S samples. The high-test temperature and the exposure time would be sufficient to provoke the recovery of the austenite structure if stress-induced mar-tensite was formed during the sample preparation.
SIMS profiles of the M sample exposed to the two-staged corrosion experiment are shown inFig. 13. After18O enrichment observed close
to the external interface,18O concentrations quickly drop to the natural
isotopic abundance level. Comparisons made between 18O concentra-tion profiles and56Fe and52Cr signals seem to show that the external
layer grows outward, but no conclusion can be drawn on the growth of the internal layer. These results confirm however that growth kinetics of the internal oxide scale formed on sufficiently work-hardened sam-ples is very slow relative to those of the internal layer growing on the P samples. Moreover, the1H/56Fe signal ratio reaches a value of roughly 0.154 at a depth of 1.5μm as shown inFig. 13, revealing the occurrence of H uptake by the alloy underlying the oxide scale relative to the
1H/56Fe signal ratio recorded in the matrix of a non-oxidized sample
(approximately 2.09 × 10⁻²).
The huge difference in thickness for the oxide scale in the case of P specimen compared to M specimen (or S) could be attributed to spal-lation or dissolution of a part of the oxide layer. However, the visual observation of the M samples is similar for each case: the machining drawing is still visible. The different characterizations (surface and cross sections by SEM, GDOS profiles, SIMS profiles) are in agreement with homogeneous thinner oxide layers on M and S sample. If a part of
Fig. 8. SEM surface views of 316 L SS samples after their exposure to hydrogenated SCW (600 °C and 25 MPa) highlighting the effects of different surface finishes: (a) an SP sample exposed for 335 h [secondary electron image at 5 kV], (b) an S sample exposed for 760 h [sec-ondary electron image at 3 kV] and (c) an M sample exposed for 775 h [secondary electron image at 5 kV].
Fig. 9. SEM cross-section views of 316 L SS samples after their exposure to hydrogenated SCW (600 °C and 25 MPa) highlighting the effects of different surface finishes: (a) P and (b) SP samples exposed for 335 h, (c) an M sample exposed for 350 h and (d) an S sample exposed for 1010 h.
the oxide has spalled, the remaining layer is homogeneous in compo-sition: the Cr content is significantly higher. All these signs lead to a lower growth of the oxide layer on M (or S) sample compared to the one on P surface. Thus we can conclude that the M and S specimens are more corrosion resistant in SCW.
4. Discussion
4.1. Morphology of oxide scale growth for the P samples: signs of alloy microstructure effects
The oxide scale of the P samples exhibits an alternation of bump and trough zones respectively associated with thicker and thinner oxide ones. SEM observations of the periodicity of this relief reveal that the bump zone size is of the same order of magnitude as the alloy grain size, although alloy grain boundaries emerging at the surface do not
systematically induce a thinning of the oxide layer. The thinning of the oxide scale in the vicinity of alloy grain boundaries emerging along the sample surface has been previously observed in the corrosion of the 800H steel or a Ni-based alloy in SCW [8,19]. It has been associated with the local formation of Cr-rich oxides. It can be assumed that the local thinning of the oxide scale during the corrosion of 316 L polished samples in SCW results from a similar phenomenon. Alloy grain boundaries can constitute short circuit paths for Cr diffusion as well as preferential sites for the nucleation of Cr-rich oxides. If these oxides acts as a barrier against the diffusion of anionic and cationic species relative to Fe-rich oxides (this point is discussed further in subsection4.3), their formation in the vicinity of emerging alloy grain boundaries can lead to the local thinning of the oxide scale. This assumption is consistent with the model proposed by Robertson [12] in the case of SS corrosion in subcritical water. This model is based on competition between the formation of a less protective oxide (Fe3O4) that grows quickly and that
nucleates everywhere and of a more protective oxide (Cr2O3) beneath Fig. 11. Atomic composition profiles recorded via GDOS for an M sample exposed to hydrogenated SCW for 335 h at 600 °C and 25 MPa: a) Fe, Cr, Ni and Mn profiles (normalized to the total metallic elements at each point) and b) the corresponding O profile.
Fig. 12. XRD analysis performed in theθ/2θ mode on M sample exposed to hydrogenated SCW at 600 °C and 25 MPa for 335 h. The below pattern is fo-cused on the oxide characteristics. The peaks corresponding to the chromia, a mixed spinel and the alloy are respectively indicated by Chr, Spi and A.
Fig. 13.18O concentration profile (defined as the18O signal divided by the sum of18O and16O signals) compared to16O,52Cr,56Fe and1H profiles obtained by SIMS applied to an M sample exposed to hydrogenated SCW (600 °C and 25 MPa) over a two-staged corrosion experiment (760 h in natural water fol-lowed by 308 h in water enriched with18O); intensities of1H,52Cr and56Fe signals are respectively multiplied by 1500, 100 and 40.
the magnetite scale that grows slowly and which nucleates at specific locations such as alloy grain boundaries. According to this model, Fe oxide grains are larger when Cr oxides are not formed and their size decreases locally when Cr oxide coverage is significant.
4.2. Competition between selective and non-selective oxidation: the role of subsurface hardening
Subsurface hardening induced by surface finishes leads to a sig-nificant decrease in the oxide scale thickness of 316 L M samples lative to that of P samples for similar SCW exposure periods (the re-duction factor is greater than 20). It has been shown that these two oxide layers also differ in terms of chromium content levels: Fe is the main cation in the internal part of the thicker oxide scale whereas the internal layer of the thinner one is composed of Cr-rich oxides. These results are quite consistent with those reported by Yuan et al. [7] for 304H SS in regards to SCW exposure for short periods and show that these phenomena remain stable over longer exposure periods.
Moreover, the results reported in subsection 3.2 lead us to hy-pothesize that a subsurface hardening threshold must be reached to observe such change in oxidation behavior. Indeed, the oxide scale of the SP samples was similar to that of the P samples although the SP sample subsurface was significantly work hardened. From hardness profiles of the SP, M and S samples (see subsection2.), it seems that a near surface hardness value of 450 HV is sufficient to cross the hard-ening threshold. Hardhard-ening levels causing a switch in oxidation beha-vior of 316 L in SCW at 600 °C are also characterized by the ultra-fine recrystallization of the alloy subsurface during SCW exposure. The observation of this recrystallization helps to explain the origins of changes in oxidation behavior [38]. First, temperatures are high en-ough to support diffusion in the alloy. Second, the increase in alloy subsurface work hardening implies an increase in subsurface defects density levels (e.g., dislocations) and/or the presence of stress-induced martensite. Above a certain threshold value, both the density of defects and the presence of stress-induced martensite seem sufficient (i) to provoke a general nucleation of Cr-rich oxides and (ii) to form a short circuit network promoting Cr supplies to the oxide/alloy interface, al-lowing for the growth of a continuous Cr-rich oxide layer. During alloy recrystallization, the dislocation network turns into an ultra-fine grain boundary network that continues to ensure sufficient Cr supplies for the growth of Cr-rich oxides. Conversely, below a defect density threshold, the supply of Cr to the oxide/alloy interface does not allow for the formation of a Cr-rich oxide layer. The oxide formed is then based on the main element (i) available and (ii) liable to oxidation under the investigated conditions, i.e. Fe in the case of 316 L corrosion in hy-drogenated SCW at 600 °C. Finally, the switch in oxidation behaviors found through this study seems to denote a transition from the oxida-tion of major alloying elements to the selective oxidaoxida-tion of Cr induced by the work hardening state of the substrate.
4.3. Kinetic aspects of scale growth: Cr-rich oxides vs. Fe-rich oxides As discussed above, effects of subsurface hardening can explain why the corrosion of 316 L in SCW lead to an internal layer composed of
Fe-rich oxides for sufficiently low work hardening levels and of Cr-rich oxides for high level of work hardening. However, in regards to the associated thinning of the scale, kinetic factors must be considered. It has been shown that the growth of a thick internal layer as formed on P samples results from anionic diffusion through a short circuit network presumably constituted by oxide grain boundaries. It can be assumed that this diffusion step rate-controls the growth of this internal layer. In the case of M samples, the results of tracer experiment reported in subsection 3.2did not permit the identification of mechanisms
gov-erning the growth of the Cr-rich oxide scale. Regardless of the type of growth involved (i.e., inward or outward), it can be assumed that the corresponding growth rate is controlled by grain boundary diffusion, as is the case for Fe-rich internal oxide layers growing on less work-har-dened samples.
To appraise differences in terms of diffusion properties between these two types of internal scales, diffusion coefficients for O, Cr and Fe in Fe3O4 and in Cr2O3at 600 °C were estimated from literature data
(Table 2). We note that internal oxide scales respectively formed on low and high work-hardened samples are not simply composed of magnetite or chromia but data collected for these oxides can lead to overall trends. The grain boundary diffusion coefficient (Dgb) of O in Fe3O4 is
clearly greater than Dgbvalues for O or Cr in Cr2O3, which can explain
why the internal oxide scale formed on less work-hardened samples grows significantly faster than that formed on high hardened samples. Moreover, Fe diffusion in magnetite seems also to be clearly faster than in chromia. These data are consistent with the notion that Cr-rich oxides act as a diffusion barrier relative to Fe-rich oxides. To play a part in the growth of an Fe-rich external oxide layer (which formed in all of the cases studied), Fe must diffuse through the internal layer. This is consistent with the faster growth of the external scale observed for less work-hardened samples relative to its growth for samples exhibiting high levels of work hardening. We however note that Cr-rich oxides do not seem to protect against Mn diffusion. The external oxide scale formed on highly work-hardened samples is systematically enriched in Mn relative to that of less work-hardened samples. This result echoes to that reported in the case of Ni base alloy corrosion in SCW [8].
4.4. Hydrogen uptake concomitant to oxidation processes
Regardless of levels of work hardening involved, the SIMS results show that hydrogen diffuses through the internal oxide scale, leading to H uptake by the underlying alloy. The same phenomenon has been observed for 316 L SS [33] and Ni-based alloys [43,44] exposed to subcritical water at 325 °C and seems to be linked to the reduction of water during corrosion processes. Furthermore, experimental results evidencing effects of hydrogen on stress corrosion cracking (SCC) [45] or irradiation-assisted SCC (IASCC) [46] of 316 L in subcritical water (roughly 300 °C) have been reported even though mechanisms gov-erning such effects are not clearly understood. As 316 L is also sensitive to SCC and IASCC in SCW [47,48], one can wonder about the role that H uptake by the alloy could play in these phenomena and particularly in the case of work-hardened samples, as susceptibility to SCC is known to increase with bulk hardening levels [48].
Table 2
Review of bulk (Db) and grain boundary (Dgb) diffusion coefficients of cations and oxygen in Cr2O3and Fe3O4at 600 °C (α refers to the segregation factor relating to heterodiffusion cases). A range of values is proposed for the estimation of the bulk diffusion coefficient of Fe in Fe3O4according to the H2to H2O molar ratio range investigated (see subsection2.1for details) because the law reported in Ref. [41] depends on the oxygen activity.
Diffusing species (oxide) Db(cm2.s−1) (α)Dgb(cm2.s−1) Comments References Cr (Cr2O3) 2 × 10⁻¹⁹ 4 × 10⁻¹⁵ Higher temperature data extrapolated to 600 °C [39] O (Cr2O3) 1 × 10⁻²¹ 4 × 10⁻¹⁴
Fe (Cr2O3) 3 × 10⁻²¹ 3 × 10⁻¹⁶ [40]
Fe (Fe3O4) 7 × 10⁻¹³– 2 × 10-11 – [41]
5. Conclusions
The oxidation behavior of 316 L SS in hydrogenated SCW at 600 °C is strongly dependent on microstructural consequences of surface work-hardening. Regardless of the level of hardening involved, the oxide scale is double-layered with an external layer composed of Fe-rich oxides. Nevertheless, when a threshold level of hardening is reached, a switch in oxidation mechanisms leads to a strong decrease in the total thickness of the oxide layer for similar exposure periods (the reduction factor is greater than 20).
Below this threshold, non-selective oxidation generates a thick in-ternal layer based on the primary element (i) available and (ii) liable to oxidation in investigated conditions, i.e., Fe. Above the threshold, alloy subsurface defects and/or stress-induced martensite can reach a suffi-cient density level (i) to provoke a general nucleation of Cr-rich oxides and (ii) to ensure the formation of a short circuit network providing Cr to the oxide/alloy interface. This induces the formation of a thin in-ternal layer of Cr-rich oxides. This transition from the oxidation of major alloying elements to the selective oxidation of Cr occurs as a consequence of the hardened state of the substrate.
Moreover, the overall thinning of the oxide scale observed when its internal part is rich in Cr shows that Cr-rich oxides act as a diffusion barrier (i) against ionic species responsible for its growth but also (ii) against Fe cations, which are the main metallic constituents of the ex-ternal layer. Finally, these results show that an increase in subsurface hardening levels can be used as a parameter to mitigate the generalized corrosion of 316 L SS in hydrogenated SCW efficiently. Nevertheless, the effects of this parameter on the SCC of 316 L in SCW must be stu-died, as bulk hardening is known to increase susceptibility to this cor-rosion process.
References
[1] K. Ehrlich, J. Konys, L. Heikinheimo, Materials for high performance light water reactors, J. Nucl. Mater. 327 (2004) 140–147.
[2] T.R. Allen, K. Sridharan, L. Tan, W.E. Windes, J.I. Cole, D.C. Crawford, G.S. Was, Materials challenges for generation IV nuclear energy systems, Nucl. Technol. 162 (2008) 342–357.
[3] G.S. Was, P. Ampornrat, G. Gupta, S. Teysseyre, Corrosion and stress corrosion cracking in supercritical water, J. Nucl. Mater. 371 (2007) 176–201.
[4] D. Guzonas, J. Wills, T. Do, J. Michel, Corrosion of candidate materials for use in a supercritical water CANDU®reactor, 13th International Conference on
Environmental Degradation of Materials in Nuclear Power Systems (2007). [5] A. Kimura, H.-S. Cho, N. Toda, High burnup fuel cladding materials R&D for
ad-vanced nuclear systems– nano-sized oxide dispersion strengthening steels, J. Nucl. Sci. Technol. 44 (2007) 323–328.
[6] L. Tan, Y. Yang, T.R. Allen, Oxidation behaviour of iron-based alloy HCM12A ex-posed in supercritical water, Corros. Sci. 48 (2006) 3123–3138.
[7] J. Yuan, X. Wu, W. Wang, The effect of surface finish on the scaling behavior of stainless steel in steam and supercritical water, Oxid. Met. 79 (2013) 541–551. [8] M. Payet, L. Marchetti, M. Tabarant, J.-P. Chevalier, Corrosion mechanism of a
Ni-based alloy in supercritical water: impact of surface plastic deformation, Corros. Sci. 100 (2015) 47–56.
[9] A. Kimura, S. Ukai, M. Fujiwara, Corrosion properties of oxide dispersion strengthened steels in super-critical water environment, J. Nucl. Mater. 329-333 (2004) 387–391.
[10] S. Penttilä, I. Betova, M. Bojinov, P. Kinnunen, A. Toivonen, Estimation of kinetic parameters of the corrosion layer constituents of steels in supercritical water coolant conditions, Corros. Sci. 53 (2011) 4193–4203.
[11] M. Nezakat, H. Akhiani, S. Penttilä, S. Morteza Sabet, J. Szpunar, Effect of thermo-mechanical processing on oxidation of austenitic stainless steel 316L in supercritical water, Corros. Sci. 94 (2015) 197–206.
[12] J. Robertson, The mechanism of high temperature aqueous corrosion of stainless steels, Corros. Sci. 32 (1991) 443–465.
[13] B. Stellwag, The mechanism of oxidefilm formation on austenitic stainless steels in high temperature water, Corros. Sci. 40 (1998) 337–370.
[14] S. Perrin, L. Marchetti, C. Duhamel, M. Sennour, F. Jomard, Influence of irradiation on the oxidefilm formed on 316 L stainless steel in PWR primary water, Oxid. Met. 80 (2013) 623–633.
[15] M. Montgomery, O. Hede Larsen, S. Aakjær Jensen, O. Biede, Field investigation of steamside oxidation for TP347H, Mater. Sci. Forum 461-464 (2004) 1007–1014. [16] C. Ostwald, H.J. Grabke, Initial oxidation and chromium diffusion. I. Effects of
surface working on 9–20% Cr steels, Corros. Sci. 46 (2004) 1113–1127. [17] T. Maekawa, M. Kagawa, N. Nakajima, S. Nagata, Corrosion of stainless steel in high
temperature water, Trans. Jpn. Inst. Met. 5 (1964) 22–27.
[18] M. Dumerval, S. Perrin, L. Marchetti, M. Sennour, F. Jomard, S. Vaubaillon, Y. Wouters, Effect of implantation defects on the corrosion of 316L stainless steels in primary medium of pressurized water reactors, Corros. Sci. 107 (2016) 1–8. [19] L. Tan, X. Ren, K. Sridharan, T.R. Allen, Effect of shot-peening on the oxidation of
alloy 800H exposed to supercritical water and cyclic oxidation, Corros. Sci. 50 (2008) 2040–2046.
[20] H. Lefaix-Jeuland, L. Marchetti, S. Perrin, M. Pijolat, M. Sennour, R. Molins, Oxidation kinetics and mechanisms of Ni-base alloys in pressurised water reactor primary conditions: influence of subsurface defects, Corros. Sci. 53 (2011) 3914–3922.
[21] L. Marchetti, S. Perrin, F. Jambon, M. Pijolat, Corrosion of nickel base alloys in PWR primary medium: new insights on the oxide growth mechanisms and kinetic mod-elling, Corros. Sci. 102 (2016) 24–35.
[22] P. Ampornrat, G.S. Was, Oxidation of ferritic–martensitic alloys T91, HCM12A, and HT-9 in supercritical water, J. Nucl. Mater. 371 (2007) 1–17.
[23] D.A. Guzonas, W.G. Cook, Cycle chemistry and its effect on materials in a super-critical water-cooled reactor: a synthesis of current understanding, Corros. Sci. 65 (2012) 48–66.
[24] S. Chevalier, G. Strehl, J. Favergeon, F. Desserrey, S. Weber, O. Heintz, G. Borchardt, J.P. Larpin, Use of oxygen to study the transport mechanism during high temperature oxide scale growth, Mater. High Temp. 20 (2003) 253–259. [25] F. Carrette, Relâchement des produits de corrosion des tubes en alliage 690 de
générateur de vapeur du circuit primaire des réacteurs à eau pressurisée, Ph.D. Thesis, Institut National Polytechnique de Toulouse, France, 2002.
[26] W.C. Oliver, G.M. Pharr, An improved technique for determining hardness and elastic Modulus using load and displacement sensing indentation experiments, J. Mater. Res. 7 (1992) 1564–1583.
[27] RRUFF Database, (2017) http: rruff.info (Accessed 28 June 2017).
[28] O.N. Shebanova, P. Lazor, Vibrational modeling of the thermodynamic properties of magnetite at high pressure from Ramn spectroscopic study, J. Chem. Phys. 119 (2003) 6100–6110.
[29] P. Zinin, L. Tatsumi-Petrochilos, L. Bonal, T. Acosta, J. Hammer, S. Gilder, M. Fuller, Raman spectroscopy of titanomagnetites: calibration of the intensity of Raman peaks as a sensitive indicator for their Ti content, Am. Mineral 96 (2011) 1537–1546.
[30] J. Bischoff, A.T. Motta, Oxidation behavior of ferritic–martensitic and ODS steels in supercritical water, J Nucl. Mater. 424 (2012) 261–276.
[31] X. Gao, X. Wu, Z. Zhang, H. Guan, E. Han, Characterization of oxidefilms grown on 316L stainless steel exposed to H2O2-containing supercritical water, J. Supercrit.
Fluid. 42 (2007) 157–163.
[32] Y. Chen, K. Sridharan, T. Allen, Corrosion behaviour of ferritic-martensitic steel T91 in supercritical water, Corros. Sci. 48 (2006) 2843–2854.
[33] M. Dumerval, S. Perrin, L. Marchetti, et al., Hydrogen absorption associated with the corrosion mechanism of 316L stainless steels in primary medium of Pressurized Water Reactor (PWR), Corros. Sci. 85 (2014) 251–257.
[34] G. Krauss, Fine structure of austenite produced by the reverse martensitic trans-formation, Acta Met. 11 (1963) 499–509.
[35] A. Knutsson, P. Hedström, M. Oden, Reverse martensitic transformation and re-sulting microstructure in a cold rolled metastable austenitic stainless steel, Steel Res. Int. 79 (2008) 433–439.
[36] G.B. Olson, M. Cohen, A mechanism for the strain-induced nucleation of martensitic transformation, J. Less-Common Met. 28 (1972) 107–118.
[37] G. Monrrabal, et al., Influence of the cold working induced martensite on the electrochemical behavior of AISI 304 stainless steel surfaces, J. Mater. Res. Technol. 8 (2019) 1335–1346.
[38] J.Żurek, et al., Anomalous temperature dependence of oxidation kinetics during steam oxidation of ferritic steels in the temperature range 550–650 °C, Corros. Sci. 46 (2004) 2301–2317.
[39] S.C. Tsaï, A.M. Huntz, C. Dolin, Growth mechanism of Cr2O3scales: oxygen and
chromium diffusion, oxidation kinetics and effect of yttrium, Mater. Sci. Eng. A212 (1996) 6–13.
[40] A.C.S. Sabioni, A.M. Huntz, F. Silva, F. Jomard, Diffusion of iron in Cr2O3:
poly-cristals and thinfilms, Mat. Sci. Eng. A 392 (2005) 254–261.
[41] A. Atkinson, M.L. O’Dwyer, R.I. Taylor,55Fe diffusion in magnetite crystals at 500°C
and its relevance to oxidation of iron, J. Mater. Sci. 18 (1983) 2371–2379. [42] A.G. Crouch, J. Robertson, Creep and oxygen diffusion in magnetite, Acta Metall.
Mater. 38 (1990) 2567–2572.
[43] J. Jambon, L. Marchetti, F. Jomard, J. Chêne, Mechanism of hydrogen absorption during the exposure of alloy 600-like single-crystals to PWR primary simulated media, J. Nucl. Mater. 414 (2011) 386–392.
[44] F. Jambon, L. Marchetti, F. Jomard, J. Chêne, Characterization of oxygen and hy-drogen migration through oxide scales formed on nickel-base alloys in PWR pri-mary medium conditions, Solid State Ion. 231 (2013) 69–73.
[45] F. Meng, Z. Lu, T. Shoji, J. Wang, E.-H. Han, W. Ke, Stress corrosion cracking of uni-directionally cold worked 316NG stainless steel in simulated PWR primary water with various dissolved hydrogen concentrations, Corros. Sci. 53 (2011) 2558–2565. [46] G. Furutani, N. Nakajima, T. Konishi, M. Kodama, Stress corrosion cracking on
ir-radiated 316 stainless steel, J. Nucl. Mater. 288 (2001) 179–186.
[47] R. Zhou, E.A. West, Z. Jiao, G.S. Was, Irradiation-assisted stress corrosion cracking of austenitic alloys in supercritical water, J. Nucl. Mater. 395 (2009) 11–22. [48] A. Sáez-Maderuelo, D. Gómez-Briceño, Stress corrosion cracking behavior of
an-nealed and cold worked 316L stainless steel in supercritical water, Nucl. Eng. Des. 307 (2016) 30–38.

![Fig. 2. SEM observations [secondary electron images performed at 5 kV] of P samples ex-posed to hydrogenated SCW at 600 °C and 25 MPa over 335 h (a, b and c) or 3380 h (d and e); (a) and (b) present surface views re-spectively showing large oxide grains](https://thumb-eu.123doks.com/thumbv2/123doknet/7441644.220702/4.892.63.426.80.305/observations-secondary-electron-performed-samples-hydrogenated-present-spectively.webp)