O
pen
A
rchive
T
OULOUSE
A
rchive
O
uverte (
OATAO
)
OATAO is an open access repository that collects the work of Toulouse researchers and
makes it freely available over the web where possible.
This is an author-deposited version published in :
http://oatao.univ-toulouse.fr/
Eprints ID : 13223
To link to this article : DOI:
10.1109/ICeLeTE.2013.6644359
URL :
http://dx.doi.org/10.1109/ICeLeTE.2013.6644359
To cite this version : Bovo, Angela and Sanchez, Stephane and
Heguy, Olivier and Duthen, Yves Clustering Moodle data as a tool for
profiling students. (2013) In: International Conference on e-Learning
and e-Technologies in Education - ICEEE, 2013, 23 September 2013 -
25 September 2013 (Lodz, Poland).
Any correspondance concerning this service should be sent to the repository
administrator:
[email protected]
Clustering Moodle data as a tool for profiling
students
Angela Bovo∗, St´ephane Sanchez†, Olivier H´eguy‡ and Yves Duthen§ ∗IRIT - Andil - Universit´e Toulouse 1 Capitole
Email: [email protected] †IRIT - Universit´e Toulouse 1 Capitole Email: [email protected]
‡Andil
Email: [email protected] §IRIT - Universit´e Toulouse 1 Capitole
Email: [email protected]
Abstract—This paper describes the first step of a research project with the aim of predicting students’ performance during an online curriculum on a LMS and keeping them from falling behind. Our research project aims to use data mining, machine learning and artificial intelligence methods for monitoring stu-dents in e-learning trainings. This project takes the shape of a partnership between computer science / artificial intelligence researchers and an IT firm specialized in e-learning software.
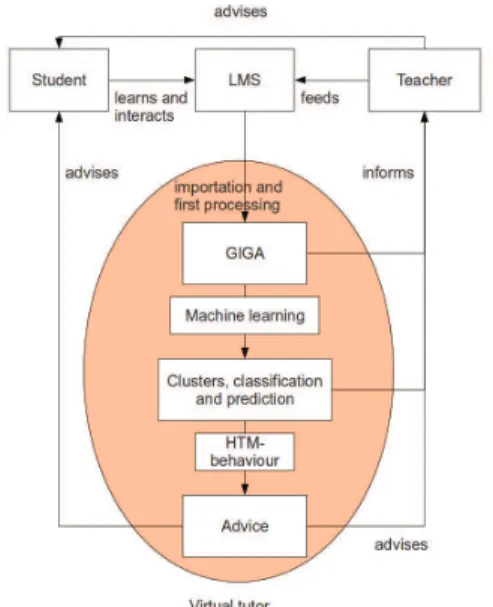
We wish to create a system that will gather and process all data related to a particular e-learning course. To make monitoring easier, we will provide reliable statistics, behaviour groups and predicted results as a basis for an intelligent virtual tutor using the mentioned methods. This system will be described in this article.
In this step of the project, we are clustering students by mining Moodle log data. A first objective is to define relevant clustering features. We will describe and evaluate our proposal. A second objective is to determine if our students show different learning behaviours. We will experiment whether there is an overall ideal number of clusters and whether the clusters show mostly qualitative or quantitative differences.
Experiments in clustering were carried out using real data obtained from various courses dispensed by a partner institute using a Moodle platform. We have compared several classic clustering algorithms on several group of students using our defined features and analysed the meaning of the clusters they produced.
I. INTRODUCTION
A. Context of the project
Our research project is based around a Ph.D. supported by the IRIT (Institute of Computer Science Research of Toulouse) and the IT firm Andil, specialized in e-learning software. Another partner firm, Juriscampus, a professional training institute, connects our project with real data from its past and current e-learning courses. There are obvious benefits to this collaboration: we have access to real data from several distinct trainings with different characteristics. There are also some drawbacks or constraints. For instance, none of these trainings includes a pre-test, which restrains the possibilities of data mining and the relevance of our interpretations.
The aim of our project is to use the methods of IT, data mining, machine learning and artificial intelligence to give educators better tools to help their e-learning students. More specifically, we want to improve the monitoring of students, to automate some of the educators’ work, to consolidate all of the data generated by a training, to examine this data with classical machine learning algorithm, to compare the results with results from a HTM-based machine learning algorithm, and to create an intelligent tutoring system based on an innovative HTM-based behavioural engine.
The reasons for monitoring students are that we want to keep them from falling behind their peers and giving up, which can be noticed earlier and automatically by data mining methods. We also want to see if we are able to predict their end results at their exams just from their curriculum data, which would mean we could henceforth advise students on how they are doing. Eventually, we would also like to devise some sort of ideal path through the different resources and activities, by observing similarities between what the best students chose, in order to suggest this same order to the more helpless students, and see how this correlates with what the teachers would describe as prerequisites.
Due to our collaborations, we have access to real data obtained in real time from several distinct trainings with different characteristics, such as the number of students, the duration of the training, and the proportion of lessons versus graded activities. We also have access to feedback from the training managers, with long lasting experience in monitoring students, who can tell us what seems important to watch and if our interpretations seem right to them. There are also some drawbacks or constraints. For instance, none of these trainings includes a pre-test, which restrains the possibilities of data mining and the relevance of our interpretations.
The proposed system will be generic enough to collect and analyse data from any LMS with a logging system. However, our current implementation connects with only one LMS so far, because in our context, all of the available data comes from a Moodle [1], [2] platform where the courses are located. Moodle’s logging system keeps track of what materials students have accessed and when and stores this data in its relational database. This database also contains some other
interesting data such as grades.
Our system gives a better access to this data. But for a more complex output, we use different machine learning methods to analyse the data more in depth and interpret it semantically. In a first step, we will reuse classical algorithms, in their implementation by the free library Weka [3]. We will run clustering, classification and regression algorithms. The clustering should help us notice different behaviour groups [4], [5] such as students who obtain good grades despite a low overall activity or students who are active everywhere except on the forums where they are lurkers. The classification will help us notice what accounts for a student’s success or failure [6]; by using the results on data from current trainings, we will try to predict the future success of a student. The regression should refine this to help us predict a student’s final grade [7]. In a next step, we will try to adapt to our problem an innovative algorithm that seems well adapted to our data. This algorithm, HTM (Hierarchical Temporal Memory), in its Cortical Learning Algorithm [8] version, is a data represen-tation structure inspired by the human neocortex. It is well adapted to non-random data that have underlying temporal and ”spatial” structure. It can be used as a basic engine with a clustering, classification or prediction output, but the details needed to do this have not yet been proposed by the algorithm’s authors. Moodle’s log data seems to us well adapted to this specification. As a consequence, we wish to implement the CLA algorithm with clustering, classification and prediction output to analyse its results on our data.
All of this will help automate the training manager’s work. Currently, they already monitor students, but they have to collect and analyse the data manually, which means that they actually use very few indicators. But this automation can go a step further by creating an intelligence virtual tutor [9] that will directly interact with students and teachers. It could suggest students a next action based on their last activity and graded results, or also give them a more global view of where they stand by using the machine learning results. It could also send them e-mails to advise them to login more frequently or warn them that a new activity has opened. It could also warn the training manager of any important or unusual event.
To implement this virtual tutor, we will in a first step use simple rules, but as a second step, we wish to re-use the formerly mentioned HTM-CLA algorithm with a new output: behaviour generation, as tried in [10].
B. Clustering as a means of analysis
Clustering [11] is the unsupervised grouping of objects into classes of similar objects. In e-learning, clustering can be used for finding clusters of students with similar behaviour patterns. In the example of forums, a student can be active or a lurker [12], [4]. These patterns may in turn reflect a difference in learning characteristics, which may be used to give them differentiated guiding [13]. They may also reflect a degree of involvement with the course, which, if too low, can hinder learning.
Data mining in general can also be used to better inform teachers about what is going on [14], or to predict a student’s chance of success [15], [7], which is the final aim of our project.
The data contained in Moodle logs lends itself readily to clustering, after a first collecting and pre-processing step [6]. The pre-processing serves to eliminate useless information, select the data we want to study (a specific course or student, a certain time period) and, in our case, shape it into features. Our aim with this analysis will be to determine if there is an overall ideal number of clusters and whether the clusters show mostly qualitative or quantitative differences. The clustering will be made by students, so our experiments will output clusters of students. Hence, we will try to interprete the results in terms of differences of behaviour between students.
The rest of the paper is organised as follows: the clustering features we chose to represent our data are presented in section 2, the experimental method in section 3, the results are detailed in section 4, and conclusions and future research are outlined in section 5.
II. WEB APPLICATION
As described earlier, our project brought us to develop a system in the form of a web application. This application is called GIGA, which means Gestionnaire d’indice g´en´eral d’apprentissage (French for General Learning Index Manager). The choice of a web application was made because it allowed for an easy access to data for the teachers.
A. Description of the current implementation
This web application is already in use for student monitor-ing in our partner trainmonitor-ing institute. This application gathers data from a LMS and other sources and allows to monitor students with raw figures, statistics and machine learning.
Our implementation uses the language Java with frame-works Wicket, Hibernate, Spring and Shiro. The data is stored in a MySQL database.
In our parter’s case, the LMS is a Moodle platform where the courses are located. Because of this, the current implemen-tation features only the ability to import data from Moodle. However, the application could be very simply extended to other LMSes that have a similar logging system.
Hence, we are also constrained by what Moodle does and does not log. For instance, there is no native way in Moodle to know exactly when a user has stopped their session unless they have used the ”log out” button. To solve this problem, our partner firm Andil had to create a Moodle plugin to have better logout estimates, that will be deployed on all future trainings, and we give different estimates for past trainings.
B. Data consolidation
We have decided to consolidate into a single database most of the data produced by an e-learning training. Currently, the data is scattered in two main sources: the students’ activity data are stored by the LMS, whereas some other data (admin-istrative, on-site training, contact and communication history, final exams grades) are kept by the training managers, their administrative team and the diverse educators, sometimes in ill-adapted solutions such as in a spreadsheet. This keeps teachers from making meaningful links: for instance, the student has
Fig. 1. The proposed architecture
not logged in this week, but it is actually normal because they called to say they were ill.
We have already provided forms for importing grades obtained in offline exams, presence at on-site trainings and commentaries on students. In the future, we will expand this to an import directly from a spreadsheet, and to other types of data. From Moodle, we regularly import the relevant data: categories, sections, lessons, resources, activities, logs and grades.
C. Data granularity
It seemed very important to us that the data collected by our application could be both available for a detailed study but also fit for a global overview. To meet this goal, we defined different granularity levels at which this data can be consulted. All raw data imported from Moodle or from other sources is directly available for consultation, such as the dates and times of login and logout of each student, or each grade obtained in quizzes.
We then provide statistics built from these raw data, such as the mean number of logins over the selected time period. This is already a level of granularity not provided by Moodle except in rare cases.
We also felt a need for a normalized indicator that would make our statistics easy to understand, like a grade out of 10, to compare students at a glance. We have defined a number of such indicators, trying to capture most aspects of a student’s online activity. All these indicators are detailed in the next section about machine learning features, because they were what we used for features. For instance, a student could have a grade for the number of lessons downloaded as a PDF to read later. We used a formula that would reflect both the distinct and total number of times that this action had been done.
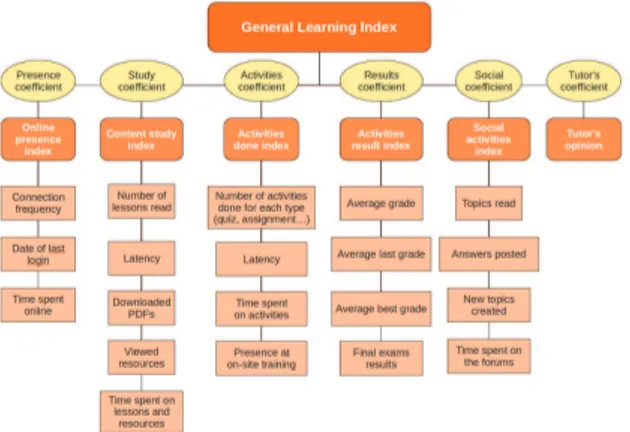
From these indicators, we built by a weighted mean higher level ones representing a facet of learning, like online presence, study, graded activity, social participation and results. Then, at an even higher level but by the same process, a single general grade, which we called the General Learning Index and which gave its name to the application.
III. CHOICE OF THE DATA AND FEATURES FOR MACHINE LEARNING
A. The data selected
We tried to import into our system all of the data that could be relevant to a student’s online activity and performance. We chose to import all logs from the Moodle database, because they indicate what material the student has seen or not seen and how often. We added to that the grades obtained, which are in another table, after some reflexion: should we judge students by their intermediary grades or not? We thought that it could reflect if the student’s activity was efficient or not. Finally, we are in the process of adding data from external sources, as mentioned in 2.2.
B. The features
We must now aggregate this data into a list of features that could capture most aspects of a student’s online activity without redundance and that we will use for machine learning. The features we have selected are:
• Login frequency • Last login • Time spent online • Number of lessons read
• Number of lessons downloaded as a PDF to read later • Number of resources attached to a lesson consulted • Number of quizzes, crosswords, assignments, etc.
done
• Average grade obtained • Average last grade obtained • Average best grade obtained • Number of forum topics read • Number of forum topics created • Number of answers to forum topics
We see that these features naturally aggregate into themes such as online presence, content study, graded activity, social participation. Most of these features are only concerned with the quantity of online activity of the student, and not the relevance of this activity. Those concerning grades are here to check that the student’s activity is not in vain.
Obviously, these features are not truly independent, and they all particularly depend on the presence features, because a student who never goes online will never do any other activity. But we think that taken together, they give a rather complete picture of the students’ activities. They offer more detail than those chosen in [6].
Fig. 2. The proposed features
Some activities offered by Moodle are not represented by these features only because they do not correspond to what is offered by the trainings we follow. For instance, none of our trainings has a chat or a wiki. But we could easily add these features for trainings for which it could be relevant.
For every ”number of x” feature, we actually used a formula that would reflect both the distinct and total number of times that this action had been done. It’s crucial to make a difference between someone who has read 5 lessons and someone who read 5 times the same lessons. However, it’s also important to notice that someone has come back to a lesson to brush up on some detail. In order to keep the total number of features reasonable, we chose to integrate both numbers into a single feature, using this formula which gives more weight to the distinct number: nbActivity = 10∗nbDistinct+N bT otal. All scores obtained by a student on a feature are divided by the number of days elapsed in the selected time interval, in order to reflect that as time passes, they keep on being active on the platform (or at least they should). They are also divided, when a total count is being made on a number of activities done, by the number of these activities, for the same reasons. All of our features are normalized, with the best student for each grade obtaining the note of 10, and others being proportionally rescaled.
IV. EXPERIMENTAL METHOD
We have already performed preliminary clustering exper-iments using these features as attributes. The computation of these features is done by our web application.
All our clustering experiments were performed using Weka [3], which had a Java API easy to integrate in our web application, and converting the data first into the previously described features, then transforming these features into Weka attributes and instances. This instances are then passed to a Weka clustering algorithm, which will output clusters of students. We can then view the feature data for each of these clusters or students in order to analyse the grouping.
In order to test the accuracy of our clusters, we used the 10-fold cross-validation method. We have averaged over a few
runs with different randomizing seeds. We executed the fol-lowing clustering algorithms provided by Weka: Expectation Maximisation, Hierarchical Clustering, Simple K-Means, and X-Means.
The number of clusters is a priori unknown, hence we have run simulations with a few different parameters for those algorithms that require a set number of clusters. These numbers will be comprised between 2 and 5.
We have selected 3 different trainings: two classes of a same training, which we will call Training A1 and A2, and a totally different training B. Training A1 has 56 students, A2 has 15 and B has 30. Both A1 and A2 last about a year while B lasts three months.
V. EXPERIMENTAL RESULTS
Our results were surprising because from what we ob-served, we could see a quantitative, but no qualitative differ-ence between the students’ activity. We did not observe groups that had an obvious behaviour difference, such as workers and lurkers in [4]. It seemed that a single feature, a kind of index of their global activity, would be almost sufficient to describe our data. This is also shown by the very little (2 to 3) number of clusters that was always sufficient for describing our data.
A. Best number of clusters
The following figure shows the results of the four algo-rithms used on each of our three datasets. The first shows the frequency at which the X-Means algorithm proposed a given number of clusters. The other three graphs show the error for a given number of clusters for K-Means, Hierarchical clustering and Expectation Maximisation.
For curve A1 (in red), X-Means proposes 2 clusters. This is also clearly the choice of Expectation Maximisation. However, Hierarchical Clustering obtains a surprising error. When analysing the data, we see that this algorithm only isolates the best student from the rest of them, leading to a large error. We have not yet delved deeper to understand this mistake.
Curve A2 (in green) has the particularity of being very flat almost everywhere except for K-Means, which shows an inflection point in error for 3 clusters, which is the only number recommended by X-Means. This similarity is logical, given that X-Means and K-Means are very close algorithms.
For curve B, in blue, all four diagrams agree on 3 clusters being the best choice.
B. Meaning of the clusters
To our surprise, the clusters observed for all three trainings did not show anything more relevant than a simple distinction between active and less active students, with variations accord-ing to the chosen number of clusters. We did not, for instance, notice any group that would differ from another simply by their activity on the forum.
To try to explain this phenomenon, we might observe the following things:
0 0.2 0.4 0.6 0.8 1 2 2.5 3 3.5 4 4.5 5 % of occurrence Number of clusters Number of clusters produced by X-Means
A1 A2 B 0 5 10 15 20 25 30 2 2.5 3 3.5 4 4.5 5 Error Number of clusters K-Means error A1 A2 B -22 -20 -18 -16 -14 -12 -10 -8 -6 -4 2 2.5 3 3.5 4 4.5 5 Error Number of clusters Hierarchical clustering error A1 A2 B -40 -35 -30 -25 -20 -15 -10 -5 0 2 2.5 3 3.5 4 4.5 5 Error Number of clusters EM error A1 A2 B
Fig. 3. Clustering results
Fig. 4. A sample clustering result showing only quantitative differences
• our training classes are rather small in number of students. There might be less variety of behaviour than among a larger dataset.
• our students may be rather homogenous in terms of age, tech use, former job experience
• there might be some vicious or vertuous circle of activities. For example, if nobody uses the forum, then nobody is enticed to start using it. This might be true of other activities if the students communicate about how much they work, but this is rather less probable. This hypothesis is probably true as long as forums are concerned: we noticed while studying our data that students post many more new topics than answers to other topics. They probably use the forum more a way of communicating with the teachers and staff than with their peers.
Hence, in about all observed clusters, the students were only quantitatively differentiated by a global activity level. It is also to be noticed that when the number of clusters was too large, clusters containing only one student, the most or least active of his training, tended to form. This phenomenon might be a good indicator that the number of clusters is too high without the help of a comprehensive study.
However, the groups obtained by clustering were always neatly segregated by their activity level, and this activity level was also correlated to the grades they obtained in graded activities. This shows that our method is sufficient to help identify students in trouble, which is our global aim.
Classification and regression tests will follow as soon as final grades are imported into our database.
VI. CONCLUSION AND FUTURE WORK
A. Conclusion on the work presented
We propose to create tools that are novel and really needed by training managers. Our application uses data mining and machine learning methods to solve the problem of student monitoring in e-learning. We have detailed how the imple-mentation allows to meet our goals by a good mix of different levels of granularity in the viewing of the data (raw data, statistics and data processed by different clustering and clas-sification machine learning algorithms). We already have very positive feedback from users from just simple statistics and are still improving our web application to add more possibilities for understanding the data. We think that our project offers a good balance between offering the viewing of raw data, of data slightly processed into statistics, then processed by machine learning algorithms, both classical and innovative. The choice of Moodle is not an obstacle to generalization of our work, which can easily adapted to another LMS just by adding a new importer.
We have proposed features that can be used for mining data obtained from Moodle courses. We think that these features are comprehensive and generic enough to be reused by other
Moodle miners. These features are then used to conduct a clustering of the data followed by an analysis.
The first results are surprising, but lead us to want to do more tests and analyses to see if our results can be generalized. OBased on our experimental results using several algorithms, we can say that our students show very little qualitative difference in behaviour. It seems that a single feature, a kind of index of their global activity, would be almost sufficient to describe our data. This is also shown by the very little (2 to 3) number of clusters that is sufficient for describing our data. We propose several explanations for this surprising result, such as the small dataset, the homogeneity of our students and a vicious circle effect.
However, the clustering using our features is enough to monitor students and notice which ones run a risk of failure, and the viewing of the features helps explain why they are in trouble. We can hence advise these students to work more.
B. Future work
We have already thought of new features that we would like to implement. They are based on external data in the process of being imported.
We want to compare the results obtained by all machine learning algorithms to see if one seems better suited. Later, we will also implement another HTM-based machine learning algorithm, and again compare results. We also want to add regression to try and predict the final grade.
We have limited our experiments, for the time being, to a subset of the available data. It would obviously be interesting to repeat the experiment using all of our data to see whether we notice structural difference across trainings, or whether this is a trend.
Classification will be used once we have integrated to our data the final exam results (which are not Moodle data), to check whether this result could have been predicted. If so, we will then splice our data into time periods to try and notice at what point in the training a good prediction could already be made. We also have a few new features that we would like to implement soon, such as presence at an on-site training.
Speaking of time periods, it is perhaps unfortunate that our pre-processing, by shaping the log data into features, had to flatten the time dimension. We might want to check on the possibility of modeling our data as a time series, as in [5].
Another facet that the data we have gathered could reveal is the quality of the study material: is a quiz too hard, so that students systematically fail it? Is a lesson less read than the others - maybe it is boring? Do the students feel the need to ask many questions in the forums? We could improve the trainings by this transversal quality monitoring.
We could partly automate the training managers’ work by creating an intelligence virtual tutor that will directly interact with students and teachers. It could suggest students a next action based on their last activity and graded results, or also give them a more global view of where they stand by using the machine learning results. It could also send them e-mails to advise them to login more frequently or warn them that a new activity has opened. It could also warn the training manager of any important or unusual event.
ACKNOWLEDGMENTS
This project is partly funded by the French public agency ANRT (National Association for Research and Technology).
REFERENCES
[1] Moodle Trust, “Moodle official site,” 2013, http://moodle.org. [2] J. Cole and H. Foster, Using Moodle: Teaching with the popular open
source course management system. O’Reilly Media, Inc., 2007. [3] Machine Learning Group at the University of Waikato, “Weka 3: Data
Mining Software in Java,” 2013, http://www.cs.waikato.ac.nz/ml/weka. [4] J. Taylor, “Teaching and Learning Online: The Workers, The Lurkers and The Shirkers,” Journal of Chinese Distance Education, no. 9, pp. 31–37, 2002.
[5] G. Cobo, D. Garc´ıa, E. Santamar´ıa, J. A. Mor´an, J. Melench´on, and C. Monzo, “Modeling students’ activity in online discussion forums: a strategy based on time series and agglomerative hierarchical clustering,” in Educational Data Mining Proceedings, 2011.
[6] C. Romero, S. Ventura, and E. Garc´ıa, “Data mining in course man-agement systems: Moodle case study and tutorial,” Computers and Education, pp. 368–384, 2008.
[7] M. D. Calvo-Flores, E. G. Galindo, M. C. P. Jim´enez, and O. P. Pi˜neiro, “Predicting students’ marks from Moodle logs using neural network models,” Current Developments in Technology-Assisted Education, p. 1:586–590, 2006.
[8] Numenta, “HTM cortical learning algorithms,” Numenta, Tech. Rep., 2010.
[9] G. Paviotti, P. G. Rossi, and P. Zarka, Intelligent Tutoring Systems: An Overview. Pensa Multimedia, 2012.
[10] D. Rawlinson and G. Kowadlo, “Generating Adaptive Behaviour within a Memory-Prediction Framework,” PLoS ONE, vol. 7, 2012. [11] A. K. Jain, M. N. Murty, and P. J. Flynn, “Data clustering: A review,”
1999.
[12] M. Beaudoin, “Learning or lurking? Tracking the ”invisible” online student,” The Internet and Higher Education, no. 2, pp. 147–155, 2002. [13] J. Lu, “Personalized e-learning material recommender system,” in Proc. of the Int. Conf. on Information Technology for Application, 2004, pp. 374–379.
[14] M. Feng and N. T. Heffernan, “Informing teachers live about student learning: Reporting in the assistment system,” in The 12th Annual Conference on Artificial Intelligence in Education Workshop on Usage Analysis in Learning Systems, 2005.
[15] M. L´opez, J. Luna, C. Romero, and S. Ventura, “Classification via clustering for predicting final marks based on student participation in forums,” in Educational Data Mining Proceedings, 2012.