OATAO is an open access repository that collects the work of Toulouse
researchers and makes it freely available over the web where possible
Any correspondence concerning this service should be sent
to the repository administrator:
[email protected]
This is an author’s version published in:
http://oatao.univ-toulouse.fr/23660
To cite this version:
Tan, Xipeng and Perrin-Pellegrino, Carine and Hoummada, Khalid and
Mangelinck, Dominique and Vande Put, Aurélie
and Lafont,
Marie-Christine
and Oquab, Djar
and Monceau, Daniel
Atom probe
tomographic study of L10 martensite in a Pt-modified NiCoCrAlYTa bond
coating. (2013) Corrosion Science, 76. 1-5. ISSN 0010-938X
Letter
Atom probe tomographie study of L1
0
martensite in a Pt-modified
NiCoCrAlYTa bond coating
Xipeng Tan
a,
*
, Carine Perrin-Pellegrino
a, Khalid Hoummada
a, Dominique Mangelinck
a,
Aurélie Rouaix Vande Put
b
, Marie-Christine Lafont
b
, Djar Oquab
b
, Daniel Mo nceau
b
• JM2NP, UMR 7334 CNRS, Université Aix-Marseille,
Av Escalrille Nonnandie-Niemen
,
Case 142, 1 3397 Marseille Cedex 20, France
• /nsrirur Camor
OR/MAT, ENSIAŒ, 4, allée Emile Manso, BP 44362, 31030 Toulouse Cedex 4, Franœ
ARTICLE INFO
ABSTRACT
Keywords:
The Llo martensite formed in a Pt modified NiCoCrAIYT
abond co
ating has been investig
ated by atom
probe tomogr
aphy. It was found that obvious segregation of Co and Cr occurred in the micro twins zone
inside the martensite l
ath. Based upon the compositional
analysis, it is known th
at Pt destabilizes the 13
phase
and Co
and Cr
act
as 13 stabilizers with respect to the 13
-+L 1
0martensitic tr
ansformation. ln
addi
lion, some CJ.
Cr particles precipitated inside the martensite l
ath.
A Metal coating
B.TEM
C. Segregation
1. Introduction
MCrAIY type overlay coatings (M = Ni and/or Co) are used as
bond coatings in the four layered thermal barrier coating (TBC)
system (i.e. (i) the superalloy substrate, (ii) the bond coat, (iii)
the thermally grown oxide (TGO), and (iv) the ceramic top coat)
as they provide superior oxidation and corrosion resistance for
hot section components in gas turbine engines
[1 3]
. They are
capable of bonding the yttria stabilized zirconia (YSZ) top coat
and superalloy substrate. Many studies have addressed the micro
structural characterization of TBC multi layered systems
[4 7]
.
Moreover, the oxidation
[8]
and hot corrosion
[9,10]
behaviour of
MCrAIY type coating or TBC systems have been widely investi
gated. It is well known that each element in the MCrAIY coatings
would play different rotes, e.g., Ni acts as the matrix, Co stabilizes
� and y phases, Al is responsible for aluminum oxide (
a.
Al
20
3)for
mation to protect the system against oxidation, Cr provides corro
sion resistance and helps the formation of alumina ("third element
effect"), Y is beneficial for TGO adherence, etc.
[11,12]
. In addition,
Pt was intentionally deposited on the externat surface of MCrAIY
coatings to obtain improved oxidation and corrosion resistance in
practical use
[13]
.
Recently, the benefit of Pt on MCrAIY coatings has received
increasing interest. Vande Put et al.
[14,15]
studied the effect of
Pt on the microstructure and oxidation resistanœ of NiCoCrAIYTa
coatings manufactured by different proœsses. Herein, L1
0*
Corresponding author. Tel.: +33 0667416065.
E-mail address:
[email protected]
(X. Tan).
http: //doi.org/10.101 6/j.corsci2013.07 .041
martensite appeared in the externat zone of Pt modified NiCoCrA
IYTa coatings after fabrication This martensite phase formed a
continuous layer in the case of vacuum plasma sprayed NiCoCrA
IYTa and a discontinuous but dense layer in the case of electrolytic
NiCoCrAIYTa. This layer formation was explained by the uphill dif
fusion of Al during the heat treatment after the electrolytic deposi
tion of Pt
[
14]
. As observed in Ni rich � NiAI phase (82 structure),
this phase will undergo a martensitic transformation during cool
ing
[16]
. It is referred to the Llo or 3R martensite with face cen
tered tetragonal (fct) lattice. Moreover, the reverse
transformation from martensite to � phase occurs upon heating.
This martensitic transformation has been commonly observed in
� NiAI
[17,18]
or Pt modified � NiAI bond coatings when Al was
depleted by interdiffusion and alumina scale spallation and refor
mation
[19 22]
. The volume change associated with this transfor
mation in Pt modified � NiAI lies between 1%
[19]
and 1.9%
[16]
depending on composition. In Pt modified aluminide coatings, this
volume change can favor bond coating surface rumpling which is
detrimental to the thermal barrier system durability
[23]
.
Furthermore, several studies have shown the martensitic trans
formation in MCrAIY coatings, which contain a volume fraction of
� NiAI, during thermal cycling [24,25]. Multiply twinned contigu
rations are widely recognized as the most important structural fea
tures of L10
martensite
[26]. Numerous papers have reported the
occurrence of micro twins in the martensite laths in NiAI bond
coatings or related NiAI alloys [19,27,28]. Liang et al. [29] observed
the 82-. L10
martensitic transformation and the macro twinned
martensite plates as well as large numbers of micro twins inside
each plate in a model NiCrAIY alloy. It is believed that the
Table 1
Nominal composition of the alloy AM3.
Ni Al Cr
Co
Tali
Mow
AM3
wtX
Bal.
6.0 8.0 6.0 4.0 2.0 2.0 5.0atX
Bal.
12.85 8.89 5.88 128 2.41 120 1.57micro twin planes could accommodate the constant shear of the
martensitic transformation, i.e. the habit plane stress, which exists
due to the small twin surface energy of NiAl parent phase
[
30]
.
Therefore, the high density of micro twins in martensitic micro
structures is of great concern during the transformation process.
It is noted that the Llo martensite has been extensively studied
both on crystallography and chemistry with the aid of transmission
electron microscopy (TEMi However, it still lacks of quantitative
chemical characterization on the Llo martensite, especially for
the sub microstructures inside the martensite laths. Atom probe
tomography (APT) is the unique and powerful technique, which
is able to locate the alloying elements and quantify the composi
tion at the atomic scale and in the three dimensions
[31,32]
. This
should allow a more detailed understanding of the martensitic
transformation and any alloying effects.
This work presents the chemical analysis of micro twins in the
martensite lath by utilizing APT, with the goal of studying the sol
ute redistribution among these sub microstructures as well as the
effect of alloying elements on the formation of L 1o martensite.
The NiCoCrAIYTa coating was deposited on the first generation
Ni based superalloy AM3 (see its composition in Table
1)
by vac
uum plasma sprayed (VPS) at the LERMPS laboratory (Sévenans,
France). The AMDRY powder with a composition of Ni 2 3Co
20Cr 8.SAl 4Ta 0.6Y (wt.%) or Ni 20.9Co 20.9Cr 16.9Al 12Ta
0.4Y (at.%) was employed for the NiCoCrAlYTa deposition. In order
to reduce the roughness resulting from the VPS process, P1200 SiC
paper was used to partially polish the NiCoCrAlYTa surface. Polish
ing would be terminated once a "partially machined" surface
Fig. 1. (a) BSE image showing the cross-section of the outer part of the Pt-modified NiCoCrAIYTa bond coating. (b) TEM bright field image showing a martensite lath in (a).
Pt
20nm
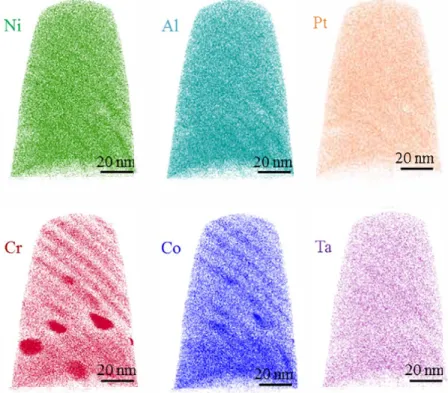
Fig. 2. APT reconstruction (80 x 80 x 110 nm3) showing the atom maps of Ni (Green), Al (light blue), Pt (Orange), Cr(Red),
Co
(Blue) and Ta (Purple). (For interpretation of the(namely between 24% and 34% of polished surface) was obtained,
which was estimated by means of optical microscopy and image
analysis. After the partial polishing, Pt was deposited by sputtering
at Cranfield University (England). The NiCoCrAIYTa coating was
70 80 µm. The thickness of Pt layer was 7 µm with an uncertainty
of ±1 µm. Moreover, heat treatment was carried out for 6 h at
1080 °C under vacuum after Pt deposition.
Scanning electron microscopy (SEM) observations of bond coat
ing cross sections were perforrned by a LEO 43SVP microscope
using the backscattered electron (BSE) mode. For the transmission
electron microscopy (TEM) sample preparation, cross sections
were taken from the "superalloy + bond coating" systems using a
diamond wire saw. The two thin slices of sample were glued coat
ing against coating with epoxy resin, and embedded in a 3 mm
diameter brass tube. After curing, the tube was sectioned into
approximately 300 µm thick dises. The dise was then polished on
both sides and dimpled before ion milling to transparency with a
Gatan precision ion polishing system. The dise was observed peri
odically during the thinning processes to ensure that the hole was
approximately located across the interface of interest. TEM obser
vations of the thin foil were carried out using a JEOL JEM 2010
microscope operating at 200 kV. APT specimens were prepared
by focused ion beam (FIB) on a FEI Helios dual beam via the lift
out technique
[33]
.
The micro tips were prepared by means of
the annular milling method
[34]
to obtain an end radius of
~
100 nm. APT analyses were performed with an Imago Sàentific
Instruments LEAP 3000x HR at a speàmen temperature of SS K.
a 100 kHz picosecond laser pulses with an energy of 0.2 nJ, an
evaporation rate of 0.002 ions pulse
1and a pressure of
90
(b)
,...
--pt 8070
C:60
·,:, .5040
30
u pt8
20
10 --Ni--
eo
--Al-
-
er
--·n
0
0.8 0.6 0.4 0.2-5
--4
-3
-2
-1
0
2
Distance (oro)
<2 x 10
11 Torr. Data reconstruction was perforrned using IVAS™3.6.2 software.
Fig. 1
a shows the cross section microstructure of this Pt modi
fied NiCoCrAIYTa bond coating. Because Pt is a heavy metal, the
outer "brighter" part should be considered as the Pt affected zone
under the BSE mode. In particular, numerous martensite laths with
the brightest contrast were clearly observed in the Pt affected
zone. These laths have been identified as the L 1o martensite in
Ref.
[14]
. One of the martensite laths is shown in
Fig. l
b. It reveals
that a large number of micro twin bands exist inside the martens
ite lath. In addition, many small precipitates were also present
both inside and outside the martensite lath. The tip for APT analy
sis was taken from the position as illustrated in
Fig. 1
b.
Fig. 2
re
veals the atom maps in the 3 dimensional APT reconstruction
volume, which consists of three different regions, i.e. the lamellar
segregation region (at top), the irregular Cr rich particles region
(in the middle) and the chemical homogeneous region (at bottom).
Lamellar structures were apparently observed. The average thick
ness of these segregation layers is deterrnined as 6.2 ± 0.7 nm in
terms of the APT reconstruction, which is in good agreement with
the width of micro twins inside the martensite lath (as shown in
Fig. 1
b i Here, Cr and Co exhibit the most obvious segregation. In
addition to these six elements in
Fig. 2
, a trace amount of Ti was
also detected in the APT volume. Ti is expected to originate from
the superalloy substrate via diffusion during the deposition of
coating and the subsequent heat treatment. However, the only
one isotope of element Y was not detected in the mass spectrum,
either in the singly and doubly charged state or molecular ions.
That may be due to the fact that most of the Y was bonded to
15
,,...._
...
10
i::·a
os
5 i:: -5 -4 -3 -2-1
01
2Distance (nm)
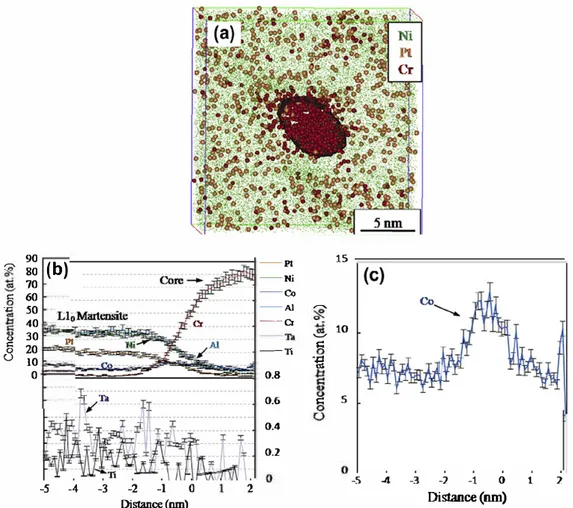
Fig. 3. (a)Selected portion of APT reconstruction showing the Cr-rich particle delineated with the 50 atX Cr is�oncentration surface. (b) Proximity histogram (proxigram) showing the concentration profiles across the above interface. (c) Enlarged concentration profile for Co in (b).
oxygen and preferentially enriched at the splat boundaries inside
the coating after deposition [35]. Moreover, several Cr rich parti
des were seen in the reconstruction volume of Cr atom map.
Fig. 3
a shows the reconstructed Cr rich precipitate. Due to the
local magnification effect
[36]
, it is difficult to resolve any atomic
planes. Concentration profiles for each atom obtained from prox
imity histogram (proxigram) analysis are shown in
Fig. 3
b. This
proxigram was created using 0.1 nm bin size with respect to a
50 at.% iso concentration reference surface. It can be seen that
the core region of the precipitate contains up to 80.0
±
2.0 at.% Cr.
Thus, it is
a.
Cr phase. This phase forms next or in � NiAl phase dur
ing cooling because Cr solubility in � phase is low and decreases
when temperature decreases. In addition, it is transparent that
Co was segregated at the martensite/a. Cr heterophase interface.
The Gibbsian interfacial excess of an element i,
ri,
is defined by
the excess number of solute atoms i (Nf
xcess)
per unit area (A).
ri
can be determined utilizing proxigram concentration profiles for
an arbitrary interface by
[37,38]
:
p
ri Ni/A
pAJCI:(di
cr)
c1)
j 1
where
p
is the atomic density (97.39 atoms nm
3for the Llo mar
tensite), t!,.x
is the distance between the p layers in the proxigram,
C: is the concentration of the jth atom, and cf' is the average concen
tration of element i in the matrix. In terms of the proxigram in
Fig. 3
c, Co segregated with a
r
i
value of 8.41
±
0.46 atoms nm
2•In order to analyze the elemental segregation in the martensite
lath, an 18 at.% Cr and Co iso concentration surface is shown in
Fig. 4
a. According to the location of APT sample, it can be known
�
�
C: 0 ·:::,�
u 0�
·.::;!;
80nm
► C.,
..
u C(a)
40
30
2010
0
40
30
20
100
that the bottom region is the � NiAI phase. Therefore, Cr and Co
are known to homogeneously disperse in the � phase. As shown
in
Fig. 4
b, L10
martensite contains less Cr and Co in comparison
with the � phase. On the contrary, more
Pt
appears in the martens
ite, which results in the brightest contrast of martensites in the BSE
image. It is noted that the concentrations of Ni and Al are almost
identical ( ~35 at.%) in the martensite.
Fig.
4c
reveals the wave like
concentration profiles for Ni, Al,
Pt,
Co and Cr. The concentration
variations follow similar trends for each respective element. It is
evident that these lamellar segregation zones correspond to the
large number of micro twins inside the martensite lath. It has been
known that the martensitic transformation only occurs in Ni rich
NiAl alloys when some requirements are satisfied in Ni rich binary
NiAl alloys, e.g., less than 37 at.% of Al content, higher than
~ 1000 °C of exposure temperature and sufficiently fast cooling rate
[18]
. Furthermore, the martensitic transformation is known to take
place in the vicinity of the Ni
65Al
35composition based upon the
Ni Al binary phase diagram and the excess Ni was randomly dis
tributed on the Al sublattice
[26]
. In the present work, the concen
tration of Al in martensite has been determined as 35.0
±
0.5 at.%
(see
Fig.4
b). Crwas suggested to predominately occupy the Al sub
lattice
[39]
. Moreover,
Pt
preferentially partitions to Ni sites
[28]
.
Hence, the martensitic transformation was able to occur under
the depleted Ni condition when cooled down from 1080 °C heat
treatment in this work. Referring to the concentration profile of
Al in
Fig.
4c
,
its peak value was exactly ~35 at.%. White its valley
concentration was down to ~30 at.%. It indicates that the regions
with the enrichment of Ni, Al and
Pt
and depletion of Co and Cr
represent the martensite. Since the martensitic transformation is
--Pt'6 -e-Nl'6 -e-Co'6
�
--<r-AI!(,---
c
,
"'
-e-Ta9'�
--Tl%0.6
�
0.4
0.2
0
0
3
6 912
15
18
Depth(nm)
(b)
-Pt9' -e-Ni% --Co% ----Al9' ___ C,96 -+-Ta9' --Tl'60.6
0.4
0.2
0
0 612
18
24
30
36
Depth(nm)
(c)
Fig. 4. (a) APT reconstruction showing the 18 atX (Cr+ Co) isCK:oncentration surface. (b) 1-dimensional concentration profiles for each atomic species obtained from the region of interest (ROl)-1 in (a). (c) 1-dimensional concentration profiles for each atomic species obtained from ROl-2 in (a).
extremely sensitive to the Al concentration, it was speculated that
Cr and Co might be segregated at the micro twins of retained b
parent phase. However, it still requires more work to verify this
segregation phenomenon.
As the chemical analysis of martensite and b phase stated
above, it was found that Pt destabilizes the b phase, i.e. promotes
the martensitic transformation. By contrast, Co and Cr would stabi
lize the b phase. Additionally, Pt and Co appear to have the higher
solubility both in b phase and martensite compared to Cr. As the
martensitic transformation proceeds, it is possible to imagine that
Cr was continuously ejected from the forming martensite and then
aggregated to form the
a
Cr precipitates.
2. Conclusion
In summary, APT has been employed to analyze the sub micro
structures of L10
martensite lath formed in a Pt modified NiCoCrA
lYTa bond coating. It was found that there exists obvious
segregation of Co and Cr in the micro twins zone inside the mar
tensite lath. According to the compositional analysis of martensite
and b phase, it is known that Pt destabilizes the b phase. However,
Co and Cr act as b stabilizers with respect to the b ? L10
martens
itic transformation. In addition, some
a
Cr precipitated inside the
martensite lath. Co was found to segregate at the L10/a
hetero
phase
interface
with
a
Gibbsian
interfacial
excess
of
8.41 ± 0.46 atoms nm
2. The chemical information at the atomic
scale obtained by APT is a good supplementary for understanding
the L1
0martensitic transformation only utilizing TEM techniques.
References
[1]R.A. Miller, Surf. Coat. Technol. 30 (1987) 1–11. [2]R.A. Miller, J. Therm. Spray. Technol. 6 (1997) 35–42. [3]N.P. Padture, M. Gell, E.H. Jordan, Science 296 (2002) 280–284. [4]A. Rabiei, A. Evans, Acta Mater. 48 (2000) 3963–3976.
[5]Z.H. Zhou, H.B. Guo, J. Wang, M. Abbas, S.K. Gong, Corros. Sci. 53 (2011) 2630– 2635.
[6]X.P. Tan, H.U. Hong, B.G. Choi, I.S. Kim, C.Y. Jo, T. Jin, Z.Q. Hu, J. Mater. Sci. 48 (2013) 1085–1089.
[7]H.U. Hong, J.G. Yoon, B.G. Choi, I.S. Kim, C.Y. Jo, Scripta Mater. 69 (2013) 33–36.
[8]F.H. Yuan, Z.X. Chen, Z.W. Huang, Z.G. Wang, S.J. Zhu, Corros. Sci. 50 (2008) 1608–1617.
[9]K. Zhang, M.M. Liu, S.L. Liu, C. Sun, F.H. Wang, Corros. Sci. 53 (2001) 1990– 1998.
[10] H. Mei, Y.N. Liu, L.F. Cheng, L.T. Zhang, Corros. Sci. 55 (2012) 201–204. [11]A. Nicoll, G. Wahl, Thin Solid Films 95 (1982) 21–34.
[12]R. Sivakumar, B. Mordike, Surf. Coat. Technol. 37 (1989) 139–160. [13]J.R. Nicholls, JOM 52 (2000) 28–35.
[14]A. Vande Put, M.-C. Lafont, D. Oquab, A. Raffaitin, D. Monceau, Surf. Coat. Technol. 205 (2010) 717–727.
[15]A. Vande Put, D. Oquab, E. Péré, A. Raffaitin, D. Monceau, Oxid. Met. 75 (2011) 247–279.
[16]D.J. Sordelet, M.F. Besser, R.T. Ott, B.J. Zimmerman, W.D. Porter, B. Gleeson, Acta Mater. 55 (2007) 2433–2441.
[17]S. Rosen, J.A. Goebel, Trans. TMS-AIME 242 (1968) 722–724. [18]J.L. Smialek, Metall. Trans. 2 (1971) 913–915.
[19]Y. Zhang, J. Haynes, B. Pint, I. Wright, W. Lee, Surf. Coat. Technol. 163 (2003) 19–24.
[20] M. Chen, R. Ott, T. Hufnagel, P. Wright, K. Hemker, Surf. Coat. Technol. 163 (2003) 25–30.
[21]M. Chen, M. Glynn, R. Ott, T. Hufnagel, K. Hemker, Acta Mater. 51 (2003) 4279– 4294.
[22] N. Vialas, PhD thesis, Institut National Polytechnique de Toulouse, 2004. [23]D.S. Balint, J.W. Hutchinson, J. Mech. Phys. Solids 53 (2005) 949–973. [24]B. Mendis, B. Tryon, T. Pollock, K. Hemker, Surf. Coat. Technol. 201 (2006)
3918–3925.
[25]B. Mendis, K. Hemker, Scripta Mater. 58 (2008) 255–258.
[26]D. Schryvers, B. De Saegher, J. Van Landuyt, Mater. Res. Bull. 26 (1991) 57–66. [27]D. Schryvers, P. Boullay, P.L. Potapov, R.V. Kohn, J.M. Ball, Int. J. Solids Struct. 39
(2002) 3543–3554.
[28]M. Clancy, M.J. Pomeroy, C. Dickinson, J. Alloys Compd. 523 (2012) 11–15. [29]J.J. Liang, H. Wei, Y.L. Zhu, T. Jin, X.F. Sun, Z.Q. Hu, Surf. Coat. Technol. 206
(2012) 2746–2750.
[30] D. Schryvers, Y. Ma, J. Alloys Compd. 221 (1995) 227–234.
[31]K. Hoummada, I. Blum, D. Mangelinck, A. Portavoce, Appl. Phys. Lett. 96 (2010) (1906) 261904–261926.
[32]D. Mangelinck, K. Hoummada, A. Portavoce, C. Perrin, R. Daineche, M. Descoins, D.J. Larson, P.H. Clifton, Scripta Mater. 62 (2010) 568–571.
[33]K. Thompson, D. Lawrence, D. Larson, J. Olson, T. Kelly, B. Gorman, Ultramicroscopy 107 (2007) 131–139.
[34]D. Larson, D. Foord, A. Petford-Long, H. Liew, M. Blamire, A. Cerezo, G. Smith, Ultramicroscopy 79 (1999) 287–293.
[35]S.C. Vergel, C. Kwakernaak, T.J. Nijdam, W.G. Sloof, Mater. High Temp. 26 (2009) 153–159.
[36]F. De Geuser, W. Lefebvre, F. Danoix, F. Vurpillot, B. Forbord, D. Blavette, Surf. Interf. Anal. 39 (2007) 268–272.
[37]O.C. Hellman, D.N. Seidman, Mater. Sci. Eng. A 327 (2002) 24–28.
[38]S.-I. Baik, M. Olszta, S. Bruemmer, D.N. Seidman, Scripta Mater. 66 (2012) 809– 812.
![Fig. 3a shows the reconstructed Cr rich precipitate. Due to the local magnification effect [36], it is difficult to resolve any atomic planes](https://thumb-eu.123doks.com/thumbv2/123doknet/3523038.103075/5.892.181.693.576.1094/reconstructed-precipitate-magnification-effect-difficult-resolve-atomic-planes.webp)