HAL Id: hal-01834007
https://hal-univ-rennes1.archives-ouvertes.fr/hal-01834007
Submitted on 3 Sep 2018HAL is a multi-disciplinary open access archive for the deposit and dissemination of sci-entific research documents, whether they are pub-lished or not. The documents may come from teaching and research institutions in France or abroad, or from public or private research centers.
L’archive ouverte pluridisciplinaire HAL, est destinée au dépôt et à la diffusion de documents scientifiques de niveau recherche, publiés ou non, émanant des établissements d’enseignement et de recherche français ou étrangers, des laboratoires publics ou privés.
Redox-driven porphyrin based systems for new
luminescent molecular switches
Lucie Norel, Clarisse Tourbillon, Julien Warnan, Jean-Frédéric Audibert,
Yann Pellegrin, Fabien Miomandre, Fabrice Odobel, Stéphane Rigaut
To cite this version:
Lucie Norel, Clarisse Tourbillon, Julien Warnan, Jean-Frédéric Audibert, Yann Pellegrin, et al.. Redox-driven porphyrin based systems for new luminescent molecular switches. Dalton Transactions, Royal Society of Chemistry, 2018, 47 (25), pp.8364-8374. �10.1039/c8dt01493k�. �hal-01834007�
1
Redox-Driven Porphyrin based Systems for New Luminescent
Molecular Switches
Lucie Norel,† Clarisse Tourbillon, Julien Warnan,‡ Jean-Frédéric Audibert,Yann Pellegrin,‡
Fabien Miomandre,*Fabrice Odobel,*‡ and Stéphane Rigaut*†
† Univ Rennes, CNRS, ISCR (Institut des Sciences Chimiques de Rennes) – UMR 6226, F-35000 Rennes, France
‡ Université LUNAM, Université de Nantes, CNRS, Chimie et Interdisciplinarité: Synthèse, Analyse, Modélisation (CEISAM), UMR 6230,2 rue de la Houssinière, 44322Nantes cedex 3,
France.
UMR CNRS 8531-PPSM, ENS Cachan, Université Paris-Saclay, 61 Avenue Président Wilson, 94235 Cachan, France
E-mail: [email protected], [email protected],
RECEIVED DATE (to be automatically inserted after your manuscript is accepted if required according to the journal that you are submitting your paper to)
† ISCR, UMR 6226 ‡ CEISAM, UMR 6230
2 Abstract.
In this work, we explore the possibility to tune the fluorescence intensity of two porphyrin systems through electrochemical oxidation of an appended ruthenium acetylide bridge. Two electrochemically switchable systems: a dyad (ZnP-Ru, 3) and a triad (ZnP-Ru-P2H, 5) were prepared and investigated. In the ZnP-Ru dyad, the fluorescence of the zinc porphyrin was switched reversibly between an ON and OFF state upon oxidation of the ruthenium unit, the most probable quenching process involved after oxidation being an electron transfer from the singlet excited state of ZnP to the oxidized ruthenium center. In the ZnP-Ru-P2H triad, we show that the both porphyrin fluorescence are highly quenched independently of the redox state of the ruthenium bridge owing to efficient photoinduced charge transfers with the ruthenium complex.
Synopsis toc
This work explores the possibility of controlling the fluorescence of porphyrins via oxidation of a ruthenium acetylide unit. The modulation depends on the nature of the porphyrin unit(s) unit.
Keywords: ruthenium, porphyrins, electrochemistry, electrofluorochromism, alkynyl complexes, molecular switches.
3 Introduction
Luminescence modulation has attracted a great deal of interest for potential applications in sensors for in bio-issue,1 in vivo imaging,2 optical memory devices,3 logic gates,4 displays,5 and information processing.6 The changes of luminescence intensity of a luminophore could be
triggered by different stimuli, inter alia light,7 electrochemical potential,8 temperature,9 and pH.10 Among them, electrofluorochromism deals with the reversible switching between high and low fluorescent states via redox-driven electric potentials.8 This electrofluorochromism can arise if the fluorophore is redox active and can be switched from an emissive to a dark state (or reverse) via an intrinsic electron transfer process.11 Another possibility is to take advantage of an independent redox active moiety bound to a fluorophore that can induce energy/electron transfer quenching with the fluorophore according to its redox state.12 During the last decade, several electrofluorochromic devices have been fabricated and investigated including the use of small organic molecules,13-15 inorganic materials,16 conjugated polymers,12 high-performance polymers,17 and hybrids.18 However, highly competitive materials could not be reached so far. Therefore, the design of materials with smarter molecular structures is essential for modern optoelectronic applications.
Chart 1. Structures of the two systems investigated in this work.
Owing to their rich optical and electrochemical properties, porphyrins are appealing units to incorporate into multicomponent systems to build switchable systems.19, 20 Indeed, porphyrins have been extensively used as light harvesting antenna for artificial photosynthesis,21-25 sensitizers for solar cells26, 27 and for the development of photonic, electronic or optoelectronic systems.28, 29 In that context, photoinduced energy transfer from zinc porphyrin (ZnP) to free base porphyrin (P2H) is a well-established process.23, 24, 30, 31
4
the photoinduced energy transfer between the two porphyrins would be controlled via the oxidation state of an electroactive bridge such as a ruthenium bis-acetylide complex (Chart 1). Indeed, group 8 metal acetylide complexes displaying strong ligand-mediated electronic effects are attractive redox-switchable building blocks for the realization of functional materials.32-47
This is the direct consequence of the ligand character of the highest occupied molecular orbital (HOMO) resulting from the overlap of a metal d() and an appropriate -orbital of the carbon-rich ligand.48-52 In particular, with ruthenium complexes of the type [ClRu(dppe)
2(-CC-Aryl)]
(dppe = 1,2-bis(diphenylphosphino)ethane), the level of involvement of the carbon rich ligand in the redox processes is found to be major, and such acetylides allowed the redox control at low potential of dithienylethene units53 to reach unique multifunctional molecular junctions, 54-56 the redox control of chiroptical,57 NLO58 or magnetic properties,59-61 as well as the first
switching of the NIR Yb(III) and Nd(III) luminescence.62, 63 Luminescence control of porphyrin
units was previously reported in different dyads involving a tetrathiafulvalene (TTF)19, 64, 65and
ferrocene redox units.66, 67 More recently studies with redox active iron or ruthenium acetylides metal complexes were reported. 68, 69 In all cases, the fluorescence of the porphyrin is partially or totally quenched in the neutral state of the nearby redox unit and is restored upon oxidation of the latter.
Herein, we describe our work exploring the possibility to trigger the fluorescence signal of two original systems through the oxidation of the ruthenium acetylide bridge. More specifically, two electrochemically switchable systems a dyad and a triad composed of porphyrins connected to a ruthenium acetylide complex were prepared and their electrochemical and fluorescence properties investigated (Chart 1). In the dyad, limited fluorescence of the porphyrin was reversibly quenched between an ON and OFF state by an electrochemical signal controlling the redox state of the ruthenium complex that triggers an electron transfer quenching with the oxidized form of the latter. In the triad, the fluorescence of both porphyrins are independent of the redox state of the ruthenium bridge owing to efficient photoinduced charge transfers with the ruthenium complex.
5 Results and Discussion
1. Synthesis of organometallic switches
The preparation of the targeted complexes 3 and 5 were achieved following the well-established procedure to obtain ruthenium σ-arylacetylide and unsymmetrical bis(σ-arylacetylide) complexes.43, 53 First, as displayed in Scheme 1, the ruthenium precursor [(dppe)2RuCl](OTf) 2
was reacted with one equivalent of the ethynyl-metalloporphyrin ZnP-CC-H 170 bearing a terminal alkyne group. Subsequent in situ deprotonation of the intermediate vinylidene [Cl-Ru=C=CH-ZnP](OTf) afforded complex 3 in good yield (71 %). Further reaction of this compound with the free base H2P-CC-H (4), in the presence of a non-coordinating salt
(NaPF6) and a base (Et3N), led to the substitution of the chlorine atom to yield the
bis(σ-arylacetylide) complexes 5 (59%). These two new species were characterized by means of 31P,
1H, 13C NMR, IR, and mass spectroscopies. FTIR measurement shows the expected
characteristic (C≡C) acetylide vibration stretch at 2056 and 2058 cm-1 for 3 and 5, respectively.
The trans arrangement on the ruthenium centers as well as the formation of a single complex in each reaction were established by the observation of a one sharp resonance peak in the 31P NMR spectra for the four phosphorus atoms in the typical regions for σ-arylacetylides (3) and bis(σ-arylacetylide) (5) at = 48.9 and 53.2 ppm, respectively. 1H NMR spectra also indicate that the complexes are effectively substituted with the porphyrin moieties in 3 and 5 with the observation of the expected integration ratio between the signals of the CH2 groups of the dppe
ligands and those of different protons on the porphyrin units (see experimental part). The high resolution mass spectrometry analyses are also fully consistent with these new structures.
6
Scheme 1. Synthetic route to the dyad 3 and triad 5.
2. Electrochemical Studies
Cyclic voltammetry (CV) was used to study the electrochemical behavior of the complexes (CH2Cl2, 0.2 M Bu4NPF6). Characteristic data are reported in Table 1 and typical CV traces are
presented in Fig. 1. For complex 3, three one electron oxidation processes are observed. By comparison with [Cl(dppe)Ru-CC-Ph]71 and ZnP-CC-H70 oxidation potentials, the first
oxidation event is a fast reversible monoelectronic process assigned to the organometallic core with a characteristic potential value (around 0 V vs. FeCp2/FeCp2+), whereas the two higher
potential processes are ascribed to two successive oxidations of the metalloporphyrin unit. Note that the value of the oxidation potential of the central ruthenium unit indicates that the latter behaves as an electron donor to the porphyrin excited state (see below), as already reported.69
Indeed, the oxidation potentials of the porphyrin unit in the dyad 3 is cathodically shifted compared to the unsubstituted porphyrin models. Concerning the triad 5, three oxidation events are also observed. After comparison with [(dppe)2Ru-(CC-Ph)2]72 and H2P-CC-H70 oxidation
potentials, the first two oxidations are ascribed to the ruthenium and ZnP units, respectively, as in dyad 3, while the third one is rather the result of the oxidation of the free base unit, the second
7
oxidation of the ZnP unit being shifted out of the electrochemical window. Indeed, free base porphyrins are known to be more difficult to oxidize than their zinc analogues.73, 74 The
oxidation potential of the ruthenium complex and of the porphyrin unit moieties are barely affected upon their attachment. These facts are indicative of a weak electronic communication between the different fragments in the ground state in the dyad 3 and the triad 5.
c
Fig. 1. CV traces of dyad 3 (up) and triad 5 (down) in CH2Cl2 (0.2 M Bu4NPF6, v = 100
mV.s-1).
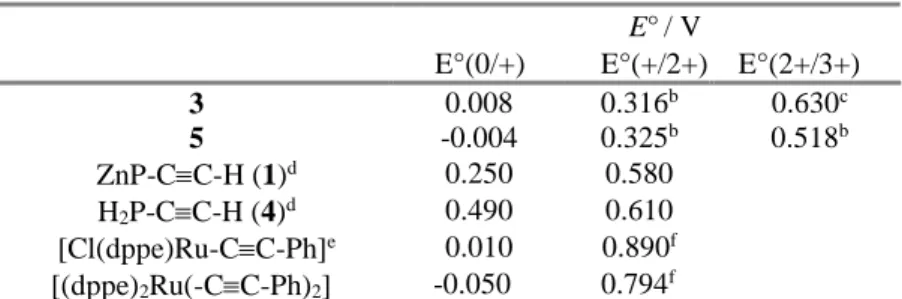
Table 1. Electrochemical data a
E°/ V
E°(0/+) E°(+/2+) E°(2+/3+)
3 0.008 0.316b 0.630c 5 -0.004 0.325b 0.518b ZnP-CC-H (1)d 0.250 0.580 H2P-CC-H (4)d 0.490 0.610 [Cl(dppe)Ru-CC-Ph]e 0.010 0.890f [(dppe)2Ru(-CC-Ph)2] -0.050 0.794f a Sample 1 mM, Bu 4NPF6 (0.2 M) in CH2Cl2, v = 100 mV·s-1, potentials
are reported in V vs. FeCp2/FeCp2+ as an internal standard,75 reversible
oxidation processes, Ep 60 mV. bEp 80 mV. cEp 130 mV. d from
8 3. Electronic absorption spectra
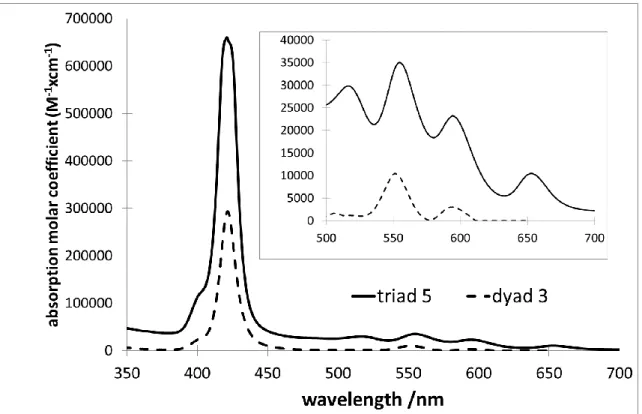
The absorption spectra of the dyad 3 and of the triad 5 were recorded in dichloromethane and are shown in Fig. 2. The wavelengths of the absorption maxima and the values of the molar extinction coefficients are gathered in Table 2. The spectra of 3 and 5 are dominated by the intense absorption bands of the porphyrin chromophores, namely an intense Soret band corresponding to S0→S2 transition around 420 nm. The latter is twice more intense in the triad 5 relative to that in the dyad 3 due to the presence of two porphyrin units displaying similar maximum absorption wavelengths (Table 2). The Q-bands correspond to transitions leading to the first singlet excited state (S0→S1). They appear as two vibronic overtones for the zinc porphyrin unit at 551 and 594 nm in 3, while the free base porphyrin exhibits four bands at 516, 555, 594, 653 nm, with two that superimpose with those of ZnP unit in 5. Accordingly, selective excitation of the free base porphyrin in 5 can be achieved by excitation in the lowest energy Q-band (653 nm), while ZnP cannot be selectively excited. There is no significant shift between the absorption maxima of 3 and 5 with those of the porphyrin precursors 1 and 4 which confirms that the ground state electronic interactions with the neighboring ruthenium complex are weak. This is the direct consequence of poor electronic -conjugation between the porphyrin and the meso phenyl substituent, which orients with a dihedral angle of circa 60°.30 The reference
ruthenium bis(σ-arylacetylide) complex [(dppe)2Ru-(CC-Ph)2] displays an absorption band at 330 nm usually described as multiconfigurational metal-to-ligand charge transfer (MLCT) excitations corresponding to transitions from Ru(dπ)/alkynyl-based orbitals to metal/ligand antibondingorbitals combined with intraligand π → π* character.53, 76 In the present complexes, this transition is barely visible because it overlaps with the more intense porphyrin transitions in this region.
Table 2. UV-vis absorption data recorded in CH2Cl2
Compound max/nm (/mol L-1cm-1) [(dppe)2Ru-(CC-Ph)2]a 243 (12.8 103); 330 (8.1 103 )
3 422 (3.22 105);551 (1.45 104); 594 (6.3 103)
5 422 (8.5 105); 516 (3.02 104); 555 (3.02 104);
594 (2.36 104); 653 (1.09 104) a taken from reference 76
9
Fig. 2. Absorption spectra of the dyad 3 (dashed line) and of the triad 5 (solid line) recorded in dichloromethane. Insert : expansion of the Q-band region.
4. Fluorescence properties
The fluorescence properties of the dyad 3 and triad 5 were measured in CH2Cl2. Upon excitation
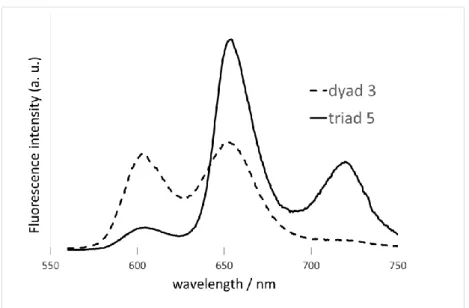
in the ZnP band at 550 nm, the dyad 3 exhibits two emission bands characteristic of this porphyrin centered at 605 and 652 nm. The triad 5 exhibits also two major emission bands, but located at 650 and 720 nm when excited at the same wavelength where both the free base porphyrin and ZnP units absorb. These latter emission wavelengths are very close to what is observed with the free base porphyrin 4,70 suggesting that an energy transfer process occurs from the zinc porphyrin to the free base, because the two emission bands of ZnP observed in the dyad 3 are weak. However, both compounds have a fluorescence quantum yield significantly lower than that of the reference free base porphyrin and of the zinc porphyrin. (Table 3). For example, the quantum yield of 3 has been measured to 0.4%, a value which is much lower than for the single zinc porphyrin unit (typically 4.5% for Znref77). The lower
fluorescence quantum yield of the porphyrin in the dyad 3 and triad 5 can be attributed to a reductive quenching process as supported by the Gibbs free enthalpy calculations (Table 4). Clearly, this reaction has a high driving force both from ZnP* and P2H* and is most certainly the major deactivating process of the fluorescence in the dyad 3 and triad 5, although this photoinduced hole transfer reaction is not complete in both compounds.
10
Fig. 3. Emission spectra of the dyad 3 and triad 5 recorded in CH2Cl2 solution upon
excitation at 550 nm.
Table 3. Fluorescence properties of 3 and 5 measured in CH2Cl2solution at 630 nm.
Compound Quantum yield
aP2H ref 0.19 aZnP ref 0.045 3 4.0 10-3 5 3.9 10-3 aP2H ref = tetrakis(3,5-ditertbutyl-phenyl)
porphyrin; ZnPref =
tetrakis(3,5-ditertbutyl-phenyl) zinc porphyrin, data taken from reference.78
Table 4. Photioinduced charge transfer driving forces from the singlet zinc and free base porphyrin as calculated from the simplified Rehm-Weller equation.79
𝒁𝒏𝑷∗− 𝑹𝒖 → 𝒁𝒏𝑷∙−− 𝑹𝒖+ 𝑷𝟐𝑯∗− 𝑹𝒖 → 𝑷𝟐𝑯∙−− 𝑹𝒖+
-G (eV) 1.29a 1.18b
a calculated from the equation: G = E(Ru+/0) E(ZnP/ZnP-) E
00(ZnP): with E00(1ZnP*) = 2.1 eV and E(ZnP/ZnP
-) = 0.81 V vs FeCp2/Fe+Cp2. bG = E(Ru+/0) E(P2H/P2H-) E00(P2H): with E00(1P2H*) = 1.8 eV and
E(P2H/P2H-) = 0.62 V vs FeCp
11 5. Electrofluorochromism
We have successively investigated the electrofluorochromic (EFC) properties of the two compounds of interest: namely the dyad 3 and the triad 5 using either a spectroelectrochemical thin layer cell80 or an epifluorescence microscope set-up.15 In the former case, the excitation
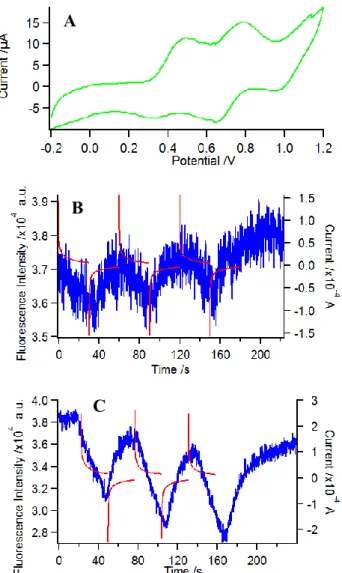
and the emission wavelengths can be accurately controlled over the whole UV-vis range while a platinum grid electrode is used to control the potential, but in the latter case the sensitivity is much higher since the emission is directly measured where excitation is focused and the electrochemically driven modulation can be applied at relatively high rates. Fig. 4 shows the EFC of 3 recorded in a spectroelectrochemical thin layer cell (ex = 550 nm, em =650 nm). The
CV allowed us to set the potential values in order to control the successive redox states of the molecule. The first oxidation process, centered on the Ru center, is reached at ca. 0.6 V vs Ag/Ag+ (Fig. 4B) while the second oxidation reaction, centered on the porphyrin core, is reached at 1.0 V (Fig. 4C) in these experimental conditions (especially with a Ag wire pseudo-reference). In both cases, the fluorescence intensity decreases upon oxidation and returns to its initial value upon reduction to the initial state. It can be clearly observed that the modulation is larger as the oxidation potential reaches more positive values. Interestingly, the first oxidation centered on the Ru unit (0.6 V in Fig. 4) leads to a further fluorescence decrease, contrary to what was expected when compared to the other similar porphyrin systems appended to a ferrocene,67, 81 a TTF, 64, 65 or an iron/ruthenium bisacetylide complex.82
12
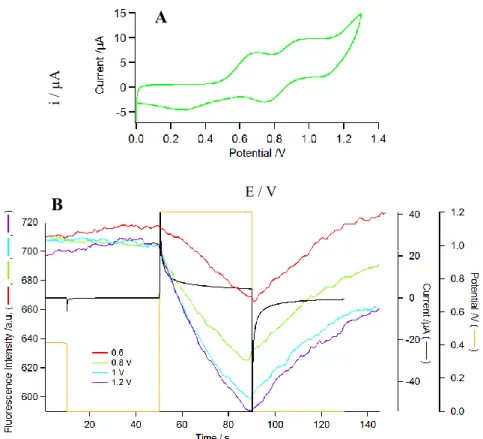
Fig. 4. EFC of 3 in CH2Cl2 (1.8 mM) measured in a thin layer spectroelectrochemical cell:
(A) CV at 5 mV/s, (B-C) Fluorescence (blue trace) and current (red trace) upon three successive potential steps from 0 to 0.6 V (B) or 1.0 V (C) and back to 0V.
To further investigate the EFC properties of 3, the same experiment was performed under an epifluorescence microscope with a tailored cell containing a solution of 3 under electrochemical control. This more sensitive technique also impedes any artefact likely to come from the counter electrode reaction. Fig. 5B shows the modulation of fluorescence intensity recorded at 654 nm (ex = 447 nm) under wide field excitation when a double potential step is applied to the working
ITO electrode. The first potential step is a blank experiment (no redox switch). B
C A
13
Fig. 5. EFC of 3 in DCB (4.6 10-5 mol L-1) measured by fluorescence microscopy under
electrochemical control: A) CV of 3 in DCB (50 mV/s). B) Fluorescence intensity modulation at 654 9 nm (ex = 447 30 nm) upon application of a double potential step (orange line) from
0 V to 0.6 V (red trace), 0.8 V (green trace), 1.0 V (sky blue trace) or 1.2 V (purple trace). The black trace shows the current recorded simultaneously.
The general trend is again similar with a decrease of the fluorescence intensity upon oxidation followed by a fluorescence recovery upon subsequent reduction, whatever the oxidation state that was reached in the molecule. The amplitude of the modulation gradually increases when the final potential is more positive up to 1.2 V. Thus, once again, oxidizing the Ru center does not restore the fluorescence as ferrocene oxidation does in ferrocene-porphyrin conjugates67 and in Akita’s shorter conjugated Ru-ZnTPP system,82 but on the contrary, it enhances the quenching. At more positive values, oxidation of the zinc porphyrin occurs and the fluorescence intensity further decreases until saturation near 1.2 V, where no further oxidation takes place. At that potential, the main species at the electrode is the twice oxidized species (ZnP+-Ru+) which is non emissive at all.
Two possible mechanisms can be envisioned to explain the fluorescence modulation upon oxidation of the Ru bisacetylide core: either photoinduced charge transfer (PICT), or energy transfer (ET) might occur between the porphyrin excited state (ZnP*) and the oxidized
A
E / V
i /
µA
14
diethynyl system (Ru+) center. From the thermodynamic point of view, the oxidized ruthenium
center probably oxidatively quench the singlet excited sate of ZnP (ZnP*), because ZnP* is a good electron donor and this mechanism was postulated before by Beeby et al in a porphyrin-TTF system.83 Furthermore, this process is supported by the significant driving force of the oxidative quenching reaction, deduced from the redox potentials and energy position of the singlet excited state (E00(1ZnP*)) of the zinc porphyrin (Table 5). The larger driving force of
this process relative to that of the reductive quenching explains the higher degree of quenching of ZnP* and thus the lower emission intensity after oxidation of the ruthenium complex.
Table 5. Photioinduced electron transfer driving forces from photoexcited porphyrin to the oxidized Ru unit calculated from the simplified Rehm-Weller equation.79
𝒁𝒏𝑷∗− 𝑹𝒖+→ 𝒁𝒏𝑷∙+− 𝑹𝒖 𝑷𝟐𝑯∗− 𝑹𝒖+→ 𝑷𝟐𝑯∙+− 𝑹𝒖
-G (eV) 1.78a 1.28b
a calculated from the equation: G = E(P+/P) - E(Ru+/0) – E
00(ZnP): with E00(1ZnP*) = 2.1 eV and E00(1ZnP*) = 1.8 eV (See Figure S1). 0 5000 1 104 1,5 104 2 104 0 1 105 2 105 3 105 4 105 5 105 550 600 650 700 750 a b s o rp ti o n m o la r c o e ff ic ie n t / c m -1 M-1 F lu o re s c e n c e in te n s ity / a .u . wavelength /nm
Fig. 6. Overlay of the emission spectrum of ZnP (dotted purple line, right scale) with the absorption spectrum of 3 (green line) vs. 3+ (orange line) in CH2Cl2.
To get insight into the possibility of an energy transfer to the oxidized ruthenium core, an absorption spectroelectrochemical study was performed on 3 using the identical thin layer spectroelectrochemical cell.80 Fig. 6 shows the superimposition of the emission spectrum of the zinc porphyrin ZnP with the absorption spectra of the dyad 3 and its first oxidized form 3+. This
15
latter was obtained by selecting the absorption at a potential where the first oxidation is complete (0.7 V) allowing to assume that the oxidized ethynyl ruthenium concentration is equal to the one of the solution at the beginning (open circuit conditions). The absorption growth observed over 600 nm can be ascribed to the bis-acetylide oxidation by comparison with the absorption spectroelectrochemistry of similar Ru moieties.76 However this absorption increase remains very small and thus although the energy overlap is slightly greater in the case of 3+, it cannot be considered as responsible for the quenching observed upon oxidation of 3. In light of the fluorescence and EFC properties 3, we conclude that electron transfer from ZnP to the oxidized ruthenium unit is probably the main deactivation process at the origin of the fluorescence modulation.
Based on the above results one might expect that the triad 5 will behave similarly as the dyad 3, that is, exhibit a higher quenching upon oxidation of the ruthenium center. Surprisingly, this is not the case, as shown in Fig. 7, where the fluorescence intensity is recorded upon applying double potential steps using the fluorescence microscope. More specifically, while almost no modulation can be seen at the first oxidation stage (see pink trace in Fig. 7B), in the triad 5 the quenching occurs only when the zinc porphyrin oxidation starts (red trace in Fig. 7B). The recovery is not complete upon reduction in relation with the lack of full reversibility observed in the backward scan of the CV, probably due to the partial degradation.68
Thus, on the basis of the process observed in 3, as there is no effect of the ruthenium redox state in the fluorescence of the triad 5, even using the most sensitive fluorescence detection, one can first assume that the energy transfer mechanism between the zinc and free base porphyrins does not contribute significantly to the P2H emission, most reasonably because it is slower than the charge transfer processes. This can be understood by the shorter distance between the porphyrin and the ruthenium complex and the large Gibbs free energy of all the charge transfer processes (see below). The emission spectrum displays essentially two bands at 650 and 720 nm that are characteristic of the free base porphyrin and a weak band at 600 nm, assigned to a residual emission of ZnP. On the other hand, the free base porphyrin emission intensity is not modulated by the oxidation of the ruthenium complex at 0.3 V because for the free base porphyrin the magnitude of the reductive quenching by Ru(II) is similar to that of the oxidative quenching by the oxidized ruthenium center owing to similar driving forces (Tables 4 and 5). Overall, the nature of the quenching mechanism changes, but the degree of fluorescence extinction is barely modified. This peculiar behavior precludes us from triggering the fluorescence of the porphyrins in the triad 5 by switching the oxidation state of Ru center. Naturally, the oxidation of ZnP in the triad 5 at 0.6 V induces a drop of emission intensity of the residual ZnP
16
fluorescence band (at 600 nm, Fig. 7C, purple trace), but a lower modulation of the band at 656 nm (assigned to both ZnP and P2H) and even lower at 725 nm, since the latter is essentially a pure P2H emission. This is the consequence of the above mentioned inefficient energy transfer from ZnP to P2H compared to charge transfer from ZnP to Ru in the present conditions.
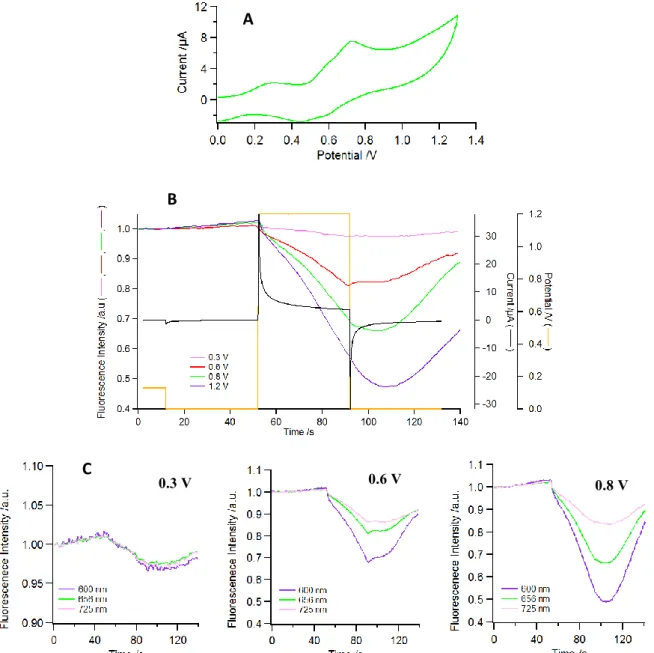
Fig. 7. A) CV of triad 5 in DCB (50 mV/s); B) Fluorescence intensity at 654 nm (ex = 447 nm)
and electrochemical current (black trace) for potential steps from 0 to 0.3 V (pink) 0.6 V (red), 0.8 V (green) and 1.0 V (purple) and back to 0 V, applied to triad 5 in DCB. C) Variation of fluorescence intensity recorded at various emission wavelengths (blue: 600 nm; green: 656 nm ; pink : 725 nm) at the indicated potential.
B
A
C
17 Conclusion
In this work we have demonstrated that the dyad 3 exhibits a redox driven switch of the fluorescence, since the interconversion of the redox state of the nearby ruthenium complex is indeed accompanied by a reversible modulation of the fluorescence intensity of ZnP. The most probable quenching process involved in the oxidized dyad is the electron transfer from the singlet excited state of ZnP to the oxidized diethynyl ruthenium unit. Upon oxidation of the ruthenium center in the triad 5, a different behavior is observed since the oxidation of the Ru center has clearly no impact on the fluorescence of the system because the degree of oxidative and reductive quenching is similar from the singlet excited state of the free base porphyrin. The modulation of the energy transfer from ZnP* to an energy acceptor fluorophore via the oxidation state of the ruthenium complex can be, however, still envisioned in the future by using another spacer to modulate the rate of charge transfer reactions or by choosing an energy acceptor fluorophore, which exhibits a different degree of quenching with neutral Ru(II) than with the oxidized ruthenium state. We believe that this study can guide the molecular engineering of new redox driven switchable photoluminescent systems with improved performances.
Acknowledgments: We thank the Université de Rennes 1, the CNRS, the ANR (RuOxLux - ANR-12-BS07-0010-01), the ANR HABISOL (program Asyscol, n8 ANR-08-HABISOL-002), the Région Pays de la Loire (LUMOMAT project) for financial support.
Electronic supplementary information (ESI) available: Additional redox and fluorescence data.
Experimental Section
General comments: The reactions were carried out under inert atmosphere using Schlenk techniques. Solvents were dried and distilled under argon using standard procedures. The ruthenium precursor [(dppe)2RuCl](OTf),71 H2P-CC-H and ZnP-CC-H70 were prepared as
previously reported. NMR spectra were recorded on a Bruker AC 200 or a Bruker AC 300P respectively at 200 MHz and 300 MHz for 1H, at 75 MHz for 13C and 81 MHz for 31P. IR spectra were recorded on an IFS 28 Bruker spectrometer. High resolution mass spectra (HRMS) were recorded in Rennes at the CRMPO (Centre Régional de Mesures Physiques de l’Ouest) on a Bruker MicrO-Tof-Q 2 spectrometer.
18
trans-[Ru(dppe)2(C≡C-1,4-C6H4-ZnP)Cl] (3). [Ru(dppe)2Cl]OTf 2 (61.4 mg, 0.057 mmol)
and ZnP-C≡C-H 1 (59 mg, 0.0057mmol) were degassed under vacuum for 1 hour. The solids were then dissolved in dichloromethane (6 mL). The resulting red-brown reaction mixture was stirred at room temperature for 3 h. The solution was then evaporated under reduced pressure to yield a green solid. The latter was washed with pentane (103 mL) to remove any trace of ZnP-C≡C-H. At this stage the formation of the vinylidene adduct was checked with phosphorous NMR (δ = 38.7 ppm). The obtained solid was dissolved in dichloromethane (3 mL) and reacted with triethylamine (0.3 mL). The solution was then evaporated under reduced pressure. After extraction of the obtained solid with ether (41.5 mL) and evaporation to dryness, the product was isolated as a green solid (80.0 mg, 0.041 mmol, 71 %). 1H NMR (400 MHz, CD2Cl2): δ 9.09 (d, 2H, 3J = 4.4 Hz, H), 9.03 (d, 2H, 3J = 4.4 Hz, H), 8.97 (m, 4H, H),
8.13 (s, 4H, o-mesityl), 8.12 (s, 2H, o-mesityl), 7.99 (d, 2H, 3J = 7.6 Hz, C
6H4), 7.87 (m, 3H,
p-mesityl), 7.64 (m, 8H, o-C6H5 (dppe)), 7.46 (m, 8H, o-C6H5 (dppe)), 7.30 (m, 8H, p-C6H5
(dppe)), 7.10-7.16 (m, 18H, m-C6H5 (dppe) and C6H4), 2.84 (m, 8H, PCH2CH2P). 13C{1H}
NMR (100 MHz, CD2Cl2): δ 150.8, 150.7, 149.1, 142.4, 137.7, 137.8 and 136.5 (m, ipso-C6H5
(dppe)), 135.0 and 134.7 (o-C6H5 (dppe)), 134.5, 132.4, 132.3, 132.2, 130.0 (2 signals), 129.4
and 129.3 (p-C6H5 (dppe)),128.6, 127.8 and 127.4 (m-C6H5 (dppe)), 122.6 and 121.4 (Cmeso),
114.0, 35.4 (CMe3), 31.9 and 29.8 (CMe3) 31.2 (m, PCH2CH2P). 31P{1H} NMR (161 MHz,
CD2Cl2): δ 48.9 (s, dppe). FT-IR (cm-1, ATR) = 2056 (m, C≡C). ESI (+) HRMS (m/z) : [M]+ =
1968.6738 (calcd 1968.67163).
trans-[Ru(dppe)2(C≡C-1,4-C6H4-PH2)(C≡C-1,4-C6H4-ZnP)] (5). NaPF6 (15 mg, 0.089
mmol), H2P-C≡C-H 4 (36 mg, 0.037 mmol) and 3 (66 mg, 0.0033 mmol) were degassed under
vacuum for 1 hour. The solids were then dissolved in a mixture of dichloromethane (10 mL) and triethylamine (1 mL). The resulting green-brown reaction mixture was stirred at room temperature for 3 h. The solution was then evaporated under reduced pressure. The obtained solid was washed with methanol (51 mL) and pentane (2 1 mL), and dried under vaccum. The product was then isolated as a purple solid (57 mg, 0.020 mmol, 59 %). 1H NMR (500
MHz, CD2Cl2): δ 9.12 (d, 2H, 3J = 4.6 Hz, H), 9.02 (m, 4H, H), 8.97 (m, 4H, H), 8.93 (d,
2H, 3J = 4.5 Hz, H), 8.88 (m, 4H, H), 8.11 (m, 8H, o-mesityl), 8.08 (d, 4H, 4J = 1.5 Hz,
o-mesityl), 8.05 (bs, 4H, C6H4) also appears as doublet depending on cond., 7.84 (m, 6H,
p-mesityl), 7.76 (bs, 16H, o-C6H5 (dppe)), 7.28 (t, 8H, 3J = 7.5 Hz, p-C6H5 (dppe)), 7.15 (t, 16H, 3J = 7.5 Hz, m-C
6H5 (dppe)), 7.2 (bs, 4H, C6H4) also appears as doublet depending on cond.,
19
MHz, CD2Cl2): δ 150.8, 149.3, 149.1, 142.3, 141.7, 137.8 (m, ipso-C6H5 (dppe)), 134.9 (o-C6H5
(dppe)), 134.7, 134.6, 132.4, 130.1, 130, 129.3, 128.7, 128.6, 129.1, 127.7 (m-C6H5 (dppe)),
122.7, 122.4, 121.7, 121.4 (Cmeso),117.3, 35.4 (CMe3), 31.9 (CMe3) 31.0 (m, PCH2CH2P). 31P{1H} NMR (161 MHz, CD
2Cl2): δ 53.2 (s, dppe). FT-IR (cm-1, ATR) = 2058 (m, C≡C). ESI
(+) HRMS (m/z) [M+H]+ = 2908.3185 (calcd 2908.32542).
Electrochemical studies were carried out under argon using an Eco Chemie Autolab PGSTAT 30 potentiostat (CH2Cl2, 0.2M Bu4NPF6), the working electrode was a Pt disk, and ferrocene
the internal reference. Spectroelectrochemical studies in thin layer cell were carried out in dichloromethane (spectroscopic grade from SDS) and at concentrations 10 μmol.L-1 for absorption and 1 μmol.L-1 for fluorescence. UV/vis absorption spectra were recorded on a Varian Cary 500 spectrophotometer. Fluorescence emission and excitation spectra were measured on a SPEX fluorolog-3 (Horiba Jobin-Yvon). For emission fluorescence spectra, the excitation wavelengths were usually set equal to the maximum of the corresponding absorption spectra. Sulforhodamine 101 in ethanol (ΦF = 0.9) was used for the determination of the relative fluorescence quantum yields. The fluorescence decay curves were obtained with a time-correlated single-photon-counting (TSPC) method using a titanium-sapphire laser (1015 nm, 82 MHz, repetition rate lowered to 0.8 MHz thanks to a pulse peaker, 1 ps pulse width) pumped by an argon ion laser. A doubling or tripler crystal is used to reach 495 and 355 nm excitations. Data were analyzed by a nonlinear least-squares method (Levenberg-Marquardt algorithm) with the aid of Globals software (Globals Unlimited, University of Illinois at Urbana-Champaign, Laboratory of Fluorescence Dynamics). Pulse deconvolution was performed from the time profile of the exciting pulse recorded under the same conditions by using a Ludox solution. To estimate the quality of the fit, the weighted residuals were calculated. In the case of single photon counting, they are defined as the residuals, that is, the difference between the measured value and the fit, divided by the square root of the fit. 2 is equal to the variance of
the weighted residuals. A fit was said to be appropriate for χ2 values between 0.8 and 1.2.
Electrochemical and eletrofluochromic measurements under microscope were performed in a home-made three-electrode low volume cell. Counter and pseudo-reference electrodes are Pt and Ag wires respectively. The home-made cell containing the electroactive fluorophore in the electrolyte solution is connected to a potentiostat (CHI600, CH Instruments). The epifluorescence microscope used in the electrochemically monitored fluorescence study is an inverted microscope (Nikon, Ti-U) equipped with either a x100 objective (numerical aperture:
20
1.49) for TIRF, or a x40 objective (numerical aperture: 0.75) for far field direct excitation measurements. The set-up is similar to the one used in ref. 15. Wavelength selection is operated through filters and dichroic mirrors (see the spectral features in Fig.s 1 and 4). The spectral features of the excitation lamp can be also found in ref 15. The fluorescence intensity is recorded by a PCO pixelfly QE USB camera (ADC/14 bit @ 12 MHz) and time lapses are recorded using multi-dimensional acquisition module on Micro-Manager at 4.9 fps.
References:
1. H. Kobayashi and P. L. Choyke, Accounts of Chemical Research, 2011, 44, 83-90. 2. Y. Kim, H.-y. Jung, Y. H. Choe, C. Lee, S.-K. Ko, S. Koun, Y. Choi, B. H. Chung, B.
C. Park, T.-L. Huh, I. Shin and E. Kim, Angewandte Chemie International Edition, 2012, 51, 2878-2882.
3. R. A. Bissell, A. P. de Silva, H. Q. N. Gunaratne, P. L. M. Lynch, G. E. M. Maguire and K. R. A. S. Sandanayake, Chemical Society Reviews, 1992, 21, 187-195.
4. A. Credi, Angewandte Chemie International Edition, 2007, 46, 5472-5475. 5. Y. Kim, Y. Kim, S. Kim and E. Kim, ACS Nano, 2010, 4, 5277-5284.
6. Z. M. Liu, A. A. Yasseri, J. S. Lindsey and D. F. Bocian, Science, 2003, 302, 1543-1545.
7. J.-K. Sun, L.-X. Cai, Y.-J. Chen, Z.-H. Li and J. Zhang, Chemical Communications, 2011, 47, 6870-6872.
8. P. Audebert and F. Miomandre, Chemical Science, 2013, 4, 575-584.
9. Y. Sagara and T. Kato, Angewandte Chemie International Edition, 2011, 50, 9128-9132.
10. C. Li, Y. Zhang, J. Hu, J. Cheng and S. Liu, Angewandte Chemie International Edition, 2010, 49, 5120-5124.
11. S. Seo, Y. Kim, Q. Zhou, G. Clavier, P. Audebert and E. Kim, Adv. Funct. Mater., 2012, 22, 3556-3561.
12. C.-P. Kuo, C.-N. Chuang, C.-L. Chang, M.-k. Leung, H.-Y. Lian and K. Chia-Wen Wu, Journal of Materials Chemistry C, 2013, 1, 2121-2130.
13. D. Canevet, M. Salle, G. Zhang, D. Zhang and D. Zhu, Chemical Communications, 2009, DOI: 10.1039/b818607n, 2245-2269.
14. H. Lim, S. Seo, S. Pascal, Q. Bellier, S. Rigaut, C. Park, H. J. Shin, O. Maury, C. Andraud and E. Kim, Scientific Reports, 2016, 6.
15. F. Miomandre, E. Lepicier, S. Munteanu, O. Galangau, J. F. Audibert, R. Meallet-Renault, P. Audebert and R. B. Pansu, Acs Applied Materials & Interfaces, 2011, 3, 690-696.
16. H. Gu, L. Bi, Y. Fu, N. Wang, S. Liu and Z. Tang, Chemical Science, 2013, 4, 4371-4377.
17. S. Seo, Y. Kim, J. You, B. D. Sarwade, P. P. Wadgaonkar, S. K. Menon, A. S. More and E. Kim, Macromolecular Rapid Communications, 2011, 32, 637-643.
18. L. Jin, Y. Fang, D. Wen, L. Wang, E. Wang and S. Dong, ACS Nano, 2011, 5, 5249-5253.
19. X. W. Xiao, W. Xu, D. Q. Zhang, H. Xu, H. Y. Lu and D. B. Zhu, Journal of Materials Chemistry, 2005, 15, 2557-2561.
21
20. P. P. Jin, M. Q. Liu, F. Cao and Q. F. Luo, Dyes and Pigments, 2016, 132, 151-158. 21. M. R. Wasielewski, Chemical Reviews, 1992, 92, 435-461.
22. D. M. Guldi, Chem. Soc. Rev., 2002, 31, 22-36.
23. J. S. Hsiao, B. P. Krueger, R. W. Wagner, T. E. Johnson, J. K. Delaney, D. C. Mauzerall, G. R. Fleming, J. S. Lindsey, D. F. Bocian and R. J. Donohoe, J. Am. Chem. Soc., 1996, 118, 11181-11193.
24. F. R. Li, S. Gentemann, W. A. Kalsbeck, J. Seth, J. S. Lindsey, D. Holten and D. F. Bocian, Journal of Materials Chemistry, 1997, 7, 1245-1262.
25. K. Ladomenou, M. Natali, E. Iengo, G. Charalampidis, F. Scandola and A. G. Coutsolelos, Coord. Chem. Rev., 2015, 304, 38-54.
26. S. Mathew, A. Yella, P. Gao, R. Humphry-Baker, B. F. E. Curchod, N. Ashari-Astani, I. Tavernelli, U. Rothlisberger, M. K. Nazeeruddin and M. Gratzel, Nature Chemistry, 2014, 6, 242-247.
27. L. L. Li and E. W. G. Diau, Chem. Soc. Rev., 2013, 42, 291-304.
28. M. Jurow, A. E. Schuckman, J. D. Batteas and C. M. Drain, Coordination Chemistry Reviews, 2010, 254, 2297-2310.
29. W. Auwarter, D. Ecija, F. Klappenberger and J. V. Barth, Nature Chemistry, 2015, 7, 105-120.
30. F. Odobel, S. Suresh, E. Blart, Y. Nicolas, J. P. Quintard, P. Janvier, J. Y. Le Questel, B. Illien, D. Rondeau, P. Richomme, T. Haupl, S. Wallin and L. Hammarstrom, Chemistry-a European Journal, 2002, 8, 3027-3046.
31. H. S. Cho, D. H. Jeong, M. C. Yoon, Y. H. Kim, Y. R. Kim, D. Kim, S. C. Jeoung, S. K. Kim, N. Aratani, H. Shinmori and A. Osuka, J. Phys. Chem. A, 2001, 105, 4200-4210.
32. T. Ren, Chem. Commun., 2016, 52, 3271-3279.
33. G. Grelaud, N. Gauthier, Y. Luo, F. Paul, B. Fabre, F. Barriere, S. Ababou-Girard, T. Roisnel and M. G. Humphrey, Journal of Physical Chemistry C, 2014, 118, 3680-3695. 34. O. A. Al-Owaedi, D. C. Milan, M. C. Oerthel, S. Bock, D. S. Yufit, J. A. K. Howard, S. J. Higgins, R. J. Nichols, C. J. Lambert, M. R. Bryce and P. J. Low, Organometallics, 2016, 35, 2944-2954.
35. D. Fink, B. Weibert and R. F. Winter, Chem. Commun., 2016, 52, 6103-6106.
36. S. De Sousa, L. Ducasse, B. Kauffmann, T. Toupance and C. Olivier, Chemistry-a European Journal, 2014, 20, 7017-7024.
37. M. C. Walkey, L. T. Byrne, M. J. Piggott, P. J. Low and G. A. Koutsantonis, Dalton Transactions, 2015, 44, 8812-8815.
38. H. Zhu, S. J. Pookpanratana, J. Y. Bonevich, S. N. Natoli, C. A. Hacker, T. Ren, J. S. Suehle, C. A. Richter and Q. L. Li, Acs Applied Materials & Interfaces, 2015, 7, 27306-27313.
39. S. Rigaut, Dalton Transactions, 2013, 42, 15859-15863.
40. E. Anger, M. Srebro, N. Vanthuyne, L. Toupet, S. Rigaut, C. Roussel, J. Autschbach, J. Crassous and R. Reau, Journal of the American Chemical Society, 2012, 134, 15628-15631.
41. Y. M. Hervault, C. M. Ndiaye, L. Norel, C. Lagrost and S. Rigaut, Organic Letters, 2012, 14, 4454-4457.
42. A. Mulas, Y.-M. Hervault, L. Norel, S. Rigaut and C. Lagrost, Chemelectrochem, 2015, 2, 1799-1805.
43. A. Mulas, Y.-M. Hervault, X. He, E. Di Piazza, L. Norel, S. Rigaut and C. Lagrost, Langmuir, 2015, 31, 7138-7147.
44. F. Lissel, F. Schwarz, O. Blacque, H. Riel, E. Loertscher, K. Venkatesan and H. Berke, Journal of the American Chemical Society, 2014, 136, 14560-14569.
22
45. R. C. Quardokus, Y. Lu, N. A. Wasio, C. S. Lent, F. Justaud, C. Lapinte and S. A. Kandel, Journal of the American Chemical Society, 2012, 134, 1710-1714.
46. Y. Tanaka, T. Ishisaka, A. Inagaki, T. Koike, C. Lapinte and M. Akita, Chemistry-a European Journal, 2010, 16, 4762-4776.
47. B. Li, J.-Y. Wang, H.-M. Wen, L.-X. Shi and Z.-N. Chen, Journal of the American Chemical Society, 2012, 134, 16059-16067.
48. P. J. Low, Coordination Chemistry Reviews, 2013, 257, 1507-1532.
49. S. Zalis, R. F. Winter and W. Kaim, Coordination Chemistry Reviews, 2010, 254, 1383-1396.
50. K. Costuas and S. Rigaut, Dalton Transactions, 2011, 40, 5643-5658.
51. P. Aguirre-Etcheverry and D. O'Hare, Chemical Reviews, 2010, 110, 4839-4864. 52. J.-F. Halet and C. lapinte, Coordination Chemistry Reviews, 2013, 257, 1584-1613. 53. Y. F. Liu, C. M. Ndiaye, C. Lagrost, K. Costuas, S. Choua, P. Turek, L. Norel and S.
Rigaut, Inorganic Chemistry, 2014, 53, 8172-8188.
54. F. B. Meng, Y. M. Hervault, L. Norel, K. Costuas, C. Van Dyck, V. Geskin, J. Cornil, H. H. Hng, S. Rigaut and X. D. Chen, Chemical Science, 2012, 3, 3113-3118.
55. F. B. Meng, Y. M. Hervault, Q. Shao, B. H. Hu, L. Norel, S. Rigaut and X. D. Chen, Nature Communications, 2014, 5, 9.
56. F. Schwarz, G. Kastlunger, F. Lissel, C. Egler-Lucas, S. N. Semenov, K. Venkatesan, H. Berke, R. Stadler and E. Lortscher, Nature Nanotechnology, 2016, 11, 170-176. 57. C. Shen, X. He, L. Toupet, L. Norel, S. Rigaut and J. Crassous, Organometallics, 2018,
37, 697-705.
58. K. A. Green, M. P. Cifuentes, M. Samoc and M. G. Humphrey, Coordination Chemistry Reviews, 2011, 255, 2530-2541.
59. L. Norel, M. Feng, K. Bernot, T. Roisnel, T. Guizouarn, K. Costuas and S. Rigaut, Inorganic Chemistry, 2014, 53, 2361-2363.
60. E. Di Piazza, A. Merhi, L. Norel, S. Choua, P. Turek and S. Rigaut, Inorganic chemistry, 2015, 54, 6347-6355.
61. E. Di Piazza, C. Boilleau, A. Vacher, K. Merahi, L. Norel, K. Costuas, T. Roisnel, S. Choua, P. Turek and S. Rigaut, Inorg. Chem., 2017, 56, 14540-14555.
62. E. Di Piazza, L. Norel, K. Costuas, A. Bourdolle, O. Maury and S. Rigaut, Journal of the American Chemical Society, 2011, 133, 6174-6176.
63. L. Norel, E. Di Piazza, M. Feng, A. Vacher, X. Y. He, T. Roisnel, O. Maury and S. Rigaut, Organometallics, 2014, 33, 4824-4835.
64. C. Loosli, C. Y. Jia, S. X. Liu, M. Haas, M. Dias, E. Levillain, A. Neels, G. Labat, A. Hauser and S. Decurtins, J. Org. Chem., 2005, 70, 4988-4992.
65. H. C. Li, J. O. Jeppesen, E. Levillain and J. Becher, Chem. Commun., 2003, DOI: 10.1039/b212456d, 846-847.
66. V. Lakshmi, G. Santosh and M. Ravikanth, J. Organomet. Chem., 2011, 696, 925-931. 67. Y. Zhou, K. T. Ngo, B. Zhang, Y. Feng and J. Rochford, Organometallics, 2014, 33,
7078-7090.
68. A. Merhi, X. Zhang, D. Yao, S. Drouet, O. Mongin, F. Paul, J. A. G. Williams, M. A. Fox and C. O. Paul-Roth, Dalton Transactions, 2015, 44, 9470-9485.
69. M. Murai, M. Sugimoto and M. Akita, Dalton Transactions, 2013, 42, 16108-16120. 70. A. Harriman, K. J. Elliott, M. A. H. Alamiry, L. Le Pleux, M. Severac, Y. Pellegrin, E.
Blart, C. Fosse, C. Cannizzo, C. R. Mayer and F. Odobel, Journal of Physical Chemistry C, 2009, 113, 5834-5842.
71. M. A. Fox, J. E. Harris, S. Heider, V. Perez-Gregorio, M. E. Zakrzewska, J. D. Farmer, D. S. Yufit, J. A. K. Howard and P. J. Low, J. Organomet. Chem., 2009, 694, 2350-2358.
23
72. D. Touchard, P. Haquette, S. Guesmi, L. LePichon, A. Daridor, L. Toupet and P. H. Dixneuf, Organometallics, 1997, 16, 3640-3648.
73. D. G. Davis, in The Porphyrins, ed. D. Dolphin, Academic Press edn., 1978, pp. 127-152.
74. R. H. Felton, in The Porphyrins, ed. D. Dolphin, Academic Press edn., 1978, pp. 53-125.
75. N. G. Connelly and W. E. Geiger, Chem. Rev., 1996, 96, 877-910.
76. C. E. Powell, M. P. Cifuentes, J. P. Morrall, R. Stranger, M. G. Humphrey, M. Samoc, B. Luther-Davies and G. A. Heath, J. Am. Chem. Soc., 2003, 125, 602-610.
77. J.-P. Strachan, S. Gentemann, J. Seth, W. A. Kalsbeck, J. S. Lindsey, D. Holten and D. F. Bocian, Journal of the American Chemical Society, 1997, 119, 11191-11201.
78. A. M. Brun, A. Harriman, V. Heitz and J. P. Sauvage, J. Am. Chem. Soc., 1991, 113, 8657-8663.
79. Weller and A., Z. Phys. Chem., 1982, 133, 93-98.
80. M. Krejcik, M. Danek and F. Hartl, Journal of Electroanalytical Chemistry Interfacial Electrochemistry, 1991, 317, 179.
81. F. Zapata, A. Caballero, A. Espinosa, A. Tarraga and P. Molina, Dalton Transactions, 2009, DOI: 10.1039/b902055c, 3900-3902.
82. M. Akita, Organometallics, 2011, 30, 43-51.
83. C. Farren, C. A. Christensen, S. FitzGerald, M. R. Bryce and A. Beeby, J. Org. Chem., 2002, 67, 9130-9139.