Titre:
Title
:
virtFlow: guest independent execution flow analysis across
virtualized environments
Auteurs:
Authors
: Hani Nemati et Michel R. Dagenais
Date: 2018
Type:
Article de revue / Journal articleRéférence:
Citation
:
Nemati, H. & Dagenais, M. R. (2018). virtFlow: guest independent execution flow analysis across virtualized environments. IEEE Transactions on Cloud Computing, p. 1-15. doi:10.1109/tcc.2018.2828846
Document en libre accès dans PolyPublie
Open Access document in PolyPublie URL de PolyPublie:
PolyPublie URL: https://publications.polymtl.ca/4210/
Version: Version finale avant publication / Accepted versionRévisé par les pairs / Refereed Conditions d’utilisation:
Terms of Use: Tous droits réservés / All rights reserved
Document publié chez l’éditeur officiel
Document issued by the official publisher Titre de la revue:
Journal Title: IEEE Transactions on Cloud Computing Maison d’édition:
Publisher: IEEE URL officiel:
Official URL: https://doi.org/10.1109/tcc.2018.2828846 Mention légale:
Legal notice:
© 2018 IEEE. Personal use of this material is permitted. Permission from IEEE must be obtained for all other uses, in any current or future media, including
reprinting/republishing this material for advertising or promotional purposes, creating new collective works, for resale or redistribution to servers or lists, or reuse of any copyrighted component of this work in other works.
Ce fichier a été téléchargé à partir de PolyPublie, le dépôt institutionnel de Polytechnique Montréal
This file has been downloaded from PolyPublie, the institutional repository of Polytechnique Montréal
virtFlow: Guest Independent Execution Flow
Analysis Across Virtualized Environments
Hani Nemati
∗, and Michel R. Dagenais
† Department of Computer and Software Engineering,Polytechnique Montreal, Quebec, Canada Email: {∗hani.nemati,†michel.dagenais}@polymtl.ca
Abstract—An agent-less technique to understand virtual ma-chines (VMs) behavior and their changes during the VM life-cycle is essential for many performance analysis and debugging tasks in the cloud environment. Because of privacy and security issues, ease of deployment and execution overhead, the method preferably limits its data collection to the physical host level, without internal access to the VMs. We propose a host-based, precise method to recover execution flow of virtualized environ-ments, regardless of the level of virtualization. Given a VM, the Any-Level VM Detection Algorithm (ADA) and Nested VM State Detection (NSD) Algorithm compute its execution path along with the state of virtual CPUs (vCPUs) from the host kernel trace. The state of vCPUs is displayed in an interactive trace viewer (TraceCompass) for further inspection. Then, a new approach for profiling threads and processes inside the VMs is proposed. Our proposed VM trace analysis algorithms have been open-sourced for further enhancements and to the benefit of other developers. Our new techniques are being evaluated with workloads generated by different benchmarking tools. These approaches are based on host hypervisor tracing, which brings a lower overhead (around 1%) as compared to other approaches. Index Terms—Execution flow analysis, nested virtual machine, performance analysis, tracing, reverse engineering.
I. INTRODUCTION
Virtualization is an emerging technology that enables on-demand access to a pool of resources through a Pay as Use (PaU) model. Sharing resources plays an important role in cloud computing. Many enterprises are beginning to adopt VMs in order to optimally utilize their resources. Despite its merits, debugging, troubleshooting, and performance analysis of such large-scale distributed systems still are a big challenge [1].
This challenge often becomes more complicated when, because of security issues, the infrastructure provider does not have access to the VMs internally. Thus, in the case of performance issues, the Infrastructure as a Service (IaaS) provider cannot provide useful insight. Moreover, the IaaS provider scheme could give the cloud user the ability of managing and using their own hypervisor as a VM (Nested VM). In this case, the diagnosis of added latency and response time of Nested VMs is quite complex, due to different levels of code execution and emulation.
Contemporary use of nested VMs is more for the purpose of software scaling, compatibility, testing and security. In addition, many network services may be virtualized (as the main goal of NFV) and hosted on nested VMs. Software
as a Service (SaaS) providers are the best clients of nested virtualization. SaaS providers encapsulate their software in a nested VM on an existing cloud infrastructure (e.g., Google Cloud and Amazon AWS). To show how recently nested VMs are becoming important, we analyzed the latest commits for KVM in the Linux Kernel (from Kernel version 4.9 to 4.10). As the latest commits [2] show, 51% are directly related to adding new features or improving performance for nested VMs.
On the other hand, cloud applications become more com-plex, where their workload may vary due to time and geo-graphic location. Thus, cloud computing lets the end-users scale resources quickly. For example, Figure 1 shows the execution latency for the same workloads. As shown, the execution time is not the same for each run (e.g., 342 ms, 699 ms, 351 ms). The average for 100 executions of the same workload is 443 ms, with a standard deviation of 116 ms. As a real use case, we did the same experiment on an Amazon EC2 t2.micro instance. In this experiment, the maximum and minimum execution time were 786 ms and 448 ms, respectively. We expect the execution time for the same workload should be almost the same. The execution time for the same task is sometimes different and the VM has the illusion of running all the time. To investigate the cause of latency, we traced the VM, but we could not find any meaningful information. In this case, the cause might be a physical resource contention, on the host, which is not visible by tracing at the VM level.
However, the analysis of the variation in response time of VMs is quite complex due to the cost of monitoring, security issues, and different levels of code execution. Hence, for such a complex environments, there is a need to elaborate more sophisticated techniques for performance analysis of virtualized environments.
This paper proposes an efficient technique to analyze the performance of any level of VMs, in any level of virtualization, without internal access. We propose, implement, and evaluate a technique to detect performance reductions along with many useful metrics for analyzing the behavior of VMs. In particular, we trace the host hypervisor to detect VMs and nested VMs and the different states of their running processes and threads. Our technique can investigate the root cause of latency in the VM by just tracing the host. A massive amount of information is buried under the vCPUs of the VMs. This information could
be revealed by analyzing the interaction between the host hypervisor, VM hypervisors, and nested VMs. Our technique leverages existing static tracepoints inside the host hypervisor along with our new added tracepoint, to convert the tracing information to meaningful visualization.
To the best of our knowledge, there is no pre-existing efficient technique to analyze the performance of any level of VMs in any level of virtualization. Notably, the required technique should troubleshoot unexpected behavior of VMs in any level, without internal access due to security issues and extra overhead. 342 699 631 351 338 323 318 599 622 549 325 0 200 400 600 1 2 3 4 5 6 7 8 9 10 11 ID of Execuation Ex ecuation Time (ms) Different Executions
Fig. 1: Execution latency (ms) for the same workload
Our main contributions in this paper are: First, our methods limit their data collection to the physical host level, without internal access to VMs. All the tracing and analysis parts are hidden to the VMs and also nested VMs. As a result, VMs and nested VMs are not being accessed during the analysis. This is critical since, in most situations, due to security reasons, accesses to the VMs are restricted. Second, our analysis, which is based on host hypervisor tracing, enables the cloud administrator to differentiate different states (e.g., Executing Nested VM code, Guest Hypervisor Code, and Host Hypervisor Code) of nested VMs. Third, we propose a method to detect different states of processes and threads, not only inside the VMs but also inside nested VMs. This method can profile processes and threads inside the VMs and nested VMs. Fourth, we evaluate the cost of added overhead (around 1%) due to tracing the host and compare it to other existing approaches.
Fifth, we experiment on actual software (e.g., Hadoop) to study the behavior of VMs regarding the overcommitment of resources and other possible problems. Furthermore, we implemented different graphical views as follows: first, a graphical view for vCPU threads from the host point of view. It presents a timeline for each vCPU with different states of the VM; second, we developed a graphical view for nested VMs which shows the vCPU threads of nested VMs with its level of code execution and states. Third, we implemented a
process view which shows the different states of threads, along with the execution time for each.
The rest of this paper is organized as follows: Section II presents a summary of other existing approaches for an-alyzing and debugging VMs. Section III introduces some background information about nested virtualization technology and presents the different states of applications inside the nested VMs and their requirements. Section IV presents the algorithm used to detect nested VMs from vCPU threads of the VM. It also explains how we can find the different states of vCPUs of VMs and nested VMs. A new approach for thread analysis inside the VMs, without tracing the guest OS, is illustrated in this section. Section V presents our experimental results along with the architecture used in our paper. We also propose other methods for the performance analysis of VMs and Nested VMs, and we compare these approaches in terms of overhead, ease of use, and limitation, in section VI. Section VII concludes the paper with directions for future investigations.
II. RELATEDWORK
In this section, we survey the available tools for monitoring VMs and briefly propose an approach for using them to analyze nested VMs.
Until recently, virtualization on commodity servers used to be complex and slow due to machine emulation and on-the-fly binary translation of privileged instructions. In due time, with the introduction of Hardware-assisted virtualization (Intel-VT and AMD-V), the overhead and complexity were reduced. It allows the execution of non-privileged VMs directly on the physical CPU. It also provides better memory and I/O management for assigning I/O devices to VMs.
Nested VMs are also supported by Intel and AMD proces-sors. There are two types of hypervisors that support Nested VMs: those that are Closed source and those which are Open source. Information about how Closed source hypervisors (e.g., hyper-V and VMware’s hypervisor) work is not public. VMware is one of the leading hypervisors. Workstation 8, Fusion 4, and ESXi 5.0 (or later) offer nested virtualization. The client can run guest hypervisors at level 1 [3]. As a result, VMware supports one level of nested virtualization. Hyper-V, like VMware, supports one level of virtualization. Some hypervisors are Open source like Xen, and KVM. Nested VMs were suppoprted on Xen since the introduction of HVM guest in Xen 3.0. Similar to KVM, Xen supports one level of nested VM [4]. Kernel-based Virtual Machine is one the most used hypervisor and is well supported by Linux. It also supports one level of nested virtualization.
CloudVisor [5] provides a transparent security monitor for the whole VM by using a nested VM. It adds an extra layer to the Virtual Machine Monitor (VMM) to intercept privileged instructions and to protect the VM with cryptography. McAfee Deep Defender [6] is another example of nested VM use. For security reasons, it has its own Virtual Machine Monitor. Furthermore, one of the features in Windows 7 for professional and ultimate editions is the XP mode [7]. In this mode, a VM
runs Windows XP for compatibility reasons. Thus, Windows 7 users can execute Windows XP applications without any change. Correspondingly, the XP mode will be run in a nested VM if Windows 7 is running in a VM.
Ravello systems [8] has implemented a high-performance nested virtualization called as HVX. It allows the user to run unmodified nested VMs on Google cloud and Amazon AWS, without any change whatsoever. Nested virtualization is also being used for Continuous Integration (CI). CI integrates code, builds modules and runs tests when they are added to the larger code base. Because of security and compatibility issues, the building and testing phases should be run in an isolated environment. CI service providers can execute each change immediately in a nested VM.
Several monitoring and analysis tools, like AWS Cloud-Watch [9] and Cisco Cloud Consumption Service [10], have been enhanced for practical use. Most of them are closed-source and information about how they monitor VMs is a secret. Based on our knowledge, there is no tool for debugging and analyzing different levels of virtualization without internal access.
AWS CloudWatch [9] is a closed-source performance mon-itoring tool that can report CPU, Network, Memory, and Disk usage for Amazon EC2 cloud. Ceilometer [11] is the metering, monitoring and alarming tool for OpenStack. Both tools provide basic metrics for physical CPUs like CPU time usage, average CPU utilization, and number of vCPUs for each VM. Although they could provide information for one level of virtualization, in case of nested VMs they can not provide any information.
Novakovic et al. [12] relies on some performance counters and Linux tools like iostat for monitoring VMs. Linux pro-vides some performance monitoring tools, such as vmstat and iostat, which gather statistics by reading proc files. Parsing the output data from these Linux tools adds overhead. In the case where these tools for nested VMs are used, the added overhead could be significant.
In [13] [14], the authors implemented guest-wide and host-wide profiling, which uses Linux perf to sample the Linux ker-nel running the KVM module. It allows profiling applications inside the guest by sampling the program counter (PC) from perf. After PCs are retrieved from perf, they are mapped to the binary translated code of the guest to find out the running time for each function inside the VMs. To have a more precise profiler, the sampling rate should be increased, which causes more overhead to the VMs. Khandual et al. in [15] presents Linux perf based virtualization performance monitoring for KVM. They benefit from counting the occurrence of different events in the guest to detect anomalies. In their work, they need to access each VM, which is not possible most of the time because of security issues and overhead. While increments to values of some event counters could be an indicator of a problem in the guest, it cannot show the exact problem and associated time. In [16], the authors developed a CPU usage monitoring tool for KVM, relying on ”perf kvm record”. By profiling all CPUs, they could monitor the CPU usage of VMs
and the total CPU usage of the hypervisor. In their work, they needed to profile the guest kernel and host kernel at the same time. They were capable of finding the overhead introduced by virtualization for VMs as a whole, but they cannot measure it for each VM separately.
Wang in [17] introduced VMon, monitoring VM interfer-ence using perf. From all the available CPU metrics, they used the Last Level Cache (LLC) as an indicator of over commit-ment of CPU. They showed that LLC has a direct relationship with performance degradation. LLC could be an indicator of CPU over commitment for CPU intensive workloads, but the result will be different when memory intensive tasks are running in the VM. Analyzing nested VMs has been addressed in [18]. They proposed a technique to analyze nested VMs using hypervisor memory forensics. Their tool can analyze nested VM setups and corresponding hypervisors but does not provide any information about nested VMs states and their execution.
PerfCompass [19] is the only trace-based VM fault detection tool for internal and external faults. It can detect if the fault has a global or local impact. As part of their implementation, they trace each and every VM with LTTng [20]. The data is eventually used to troubleshoot VMs and find out problems like latency in I/O, memory capacity problems and CPU capacity problems. Their approach, however, needs to trace each VM, which significantly increases the overhead on the VMs. Their approach can be ported to nested VMs by tracing each nested VM. Nonetheless, as we will see in subsection VI-A, the overhead of tracing nested VMs is much larger than with our proposed method.
The work closest to ours, which motivated the research presented in this paper, is presented in [21]. They proposed a technique to investigate different states of VMs. The authors could find the preempted VMs along with the cause of preemption. In their case, they trace each VM and also the host kernel. After tracing, they synchronize the trace from each VM with that from the host. Then, they search through all threads to find preempted threads. Biancheri et al. in [22] extended multi-layer VM analysis. Although this work can be used for nested VMs, the extra efforts required, (tracing the VMs and Nested VMs, synchronizing the traces, finding preempted VMs by searching all available threads in the host and VMs), are all time-consuming.
Early results of this work are presented in [23] [24] [25]. In these papers, we propose a technique to understand the behavior of up to one level of nested VMs. To the best of our knowledge, there is no pre-existing efficient technique to analyze the performance of any level of VMs. Our technique could uncover many issues inside VMs without internal access. Moreover, comparing our method with other possible solutions shows less overhead, and ease of deployment in terms of tracing, since it limits its data collection to host hypervisor level.
III. VMANDNESTED-VM MACHINESTATES
Intel-VT (and similarly AMD-V) supports two operating modes, root mode and non-root mode for executing hypervisor code and VM code, respectively. Furthermore, non-privileged instructions of VMs are executed as non-root mode, and privileged instructions are executed as root mode (at a higher privilege level). The transaction between root mode and non-root mode is called Virtual Machine Extensions (VMX) transi-tion. In each VMX transition, the environment specifications of the VMs and the hypervisor are stored in an in-memory Virtual Machine Control Structure (VMCS) [26].
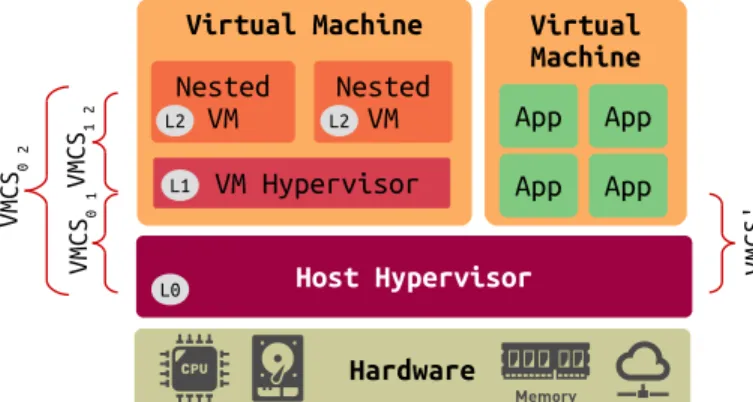
Fig. 2: Two-Level VMs (Nested VM) Architecture for VMX
In the transition between root mode to non-root mode, the state of the hypervisor is saved into VMCS and the environment specifications of the VM are loaded. This is also called a VM entry. On the other hand, in the transition between non-root mode to root mode, the state of the VM is saved into VMCS and the state of the hypervisor is loaded. This is called a VM exit. The Exit reason is a field in the VMCS that changes during a VM exit. It shows the reason for exiting from non-root mode to root mode.
Figure 2 shows a two-level architecture for nested VMs. In a two-level architecture, executing any privileged instruction by level two (nested VMs) returns to the host hypervisor (L0). In this case, the VM hypervisor (L1) has the illusion of running the code of the nested VM (L2) directly on the physical CPU. However, privileged instructions of nested VMs should be handled by the highest privileged level. Since L1 is not the highest privileged level, L0 handles it. As a result, whenever any hypervisor level or VM executes privileged instructions, the L0 trap handler is executed. This VMX emulation can go to any level of nesting.
Usually, there is one pointer to a VMCS structure for each vCPU (V M CS001 in Figure 2) of each VM. However, for two level of VMs, there are three VMCS structures for each vCPU (V M CS12, V M CS02, and V M CS01in Figure 2). The VM hypervisor uses V M CS12 to contain the environment specifications of vCPU of a nested VM. As we mentioned before, the code of a nested VM can be executed directly on the host hypervisor. In this case, the host hypervisor prepares V M CS02 to save and to store the state of vCPUs of nested VMs at each VM exit and VM entry. Moreover, the
host hypervisor creates V M CS01 to execute the code of the VM hypervisor. From the host perspective, V M CS12 is not valid (Called shadow VMCS), but the host hypervisor benefits from that to update some fields in V M CS02 for each VMX transition. For other vCPUs, there are other VMCS structures that save the environment specifications of the vCPUs.
Figure 3 shows different states of a vCPU and the conditions to reach those states. In both root and non-root states, the vCPU is in running mode. In contrast, in the Preempted, Wait, and Idle states, the vCPU is not executing any code. The Preempted state is when the vCPU is being scheduled out by the host CPU scheduler without notifying the guest OS. The Idle state is when the vCPU is being scheduled out voluntarily by sending the hlt signal from the guest OS. In the Wait state, the vCPU thread is waiting for the physical CPU for being free to schedule in. Figure 4 presents different states of a process inside a level VM. In general, a process inside a two-level VM could be in either of these states: host hypervisor as VMX root (known as L0), VM hypervisor as VMX non-root (known as L1), Nested VM as VMX non-root (known as L2), Preemption in L1, Preemption in L0, Wait, and Idle. Executing any privileged instruction causes a VM exit all the way down to the host hypervisor. There are two possible ways of handling any privileged instruction. Along the first handling path, L0 handles the instruction and forwards it to L1. In this case, L0’s code is executed in root mode and L1’s code is run in non-root mode. Eventually, L1 handles the exit reason and launches L2 in non-root mode. Launching or resuming a VM in L1 causes an exit to L0. Then, L0 handles the exit reason and launches the VM. Along the other possible path, L0 directly forwards the control to L2. In this scenario, the exit reason is transparent for L1, since it happens somewhere else in the host hypervisor level [27]. A process of a nested VM is in the Running mode when it is in the L0, L1, or L2 state. By contrast, the physical CPU is not running code of a nested VM if its state is either Preemption L0, Preemption L1, or Waiting state. This can add an unexpected delay to nested VMs, since the nested VM user is not aware of being preempted or waiting for a physical CPU. Figure 5 depicts the states of a process inside a n-level nested VM. As shown, a process could be preempted in any level of virtualization, and privileged instructions in the code of Nested VMs could be handled in any level of virtualization. Therefore, new states for preemption in any level, and VMX non-root in any level, are added to process state transitions.
IV. NESTEDVM ANALYSISALGORITHMS
In this section, we propose three algorithms to analyze VMs. First: Any-Level VM Detection Algorithm (ADA) to detect nested VMs, at an arbitrary depth from the vCPU thread of a VM. Second: Nested VM State Detection (NSD), to uncover the different states of vCPUs for the nested VMs. Third: Guest (Any-Level) Thread Analysis (GTA) which is a thread-level and process-level execution time profiling algorithm.
Our algorithms analyze some events that are collected by tracing the host hypervisor. Tracing is a very fast system-wide
Fig. 3: Virtual Machine Process State Transition
Fig. 4: Two-Level VMs Process State Transition VMX Non-ROOT L1 VMX Non-ROOT Ln+1 VMX ROOT L0 Preempted Ln Preempted L0 Wait IDLE
Fig. 5: n-Levels Nested Virtual Ma-chine Process State Transition
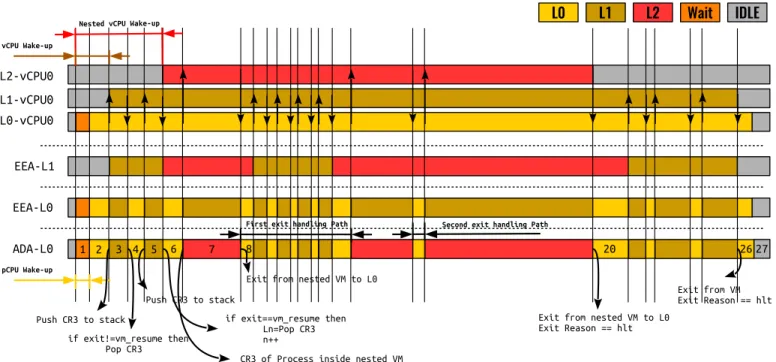
Fig. 6: vCPU states using different algorithms
TABLE I: Sequence of events from the host related to Figure 6
# Event Payload
1 wake up comm=vcpu thread
2 sched switch comm=vcpu thread, pCPU=0
3 vm entry vcpu = 0, CR3 = cr3, SP = sp
4 vm exit exit = exit reason
5 vm entry vcpu = 0, CR3 = cr3, SP = sp’
6 vm exit exit = vm resume
7 vm entry vcpu = 0, CR3 = cr3’, SP = sp”
8 vm exit exit = exit reason
. . . . . . . . . 20 vm exit exit = hlt . . . . . . . . . 26 vm exit exit = hlt
logging mechanism. An event is generated by the tracer when it encounters an enabled tracepoint at run-time. Events can carry some information like a timestamp and a payload. The payload holds extra information about an event. For example, the payload of a context switch event contains the pCPU and name of the two switched tasks. A timestamp is recorded as time of an event, upon encountering the tracepoint.
A. Any-Level VM Detection Algorithm (ADA)
In this subsection, we propose an algorithm to detect execution flows for arbitrary depths of nesting from the vCPU thread of a VM in the host. Before introducing Any-Level VM Detection Algorithm (ADA), we explain a very simple VMX root and non-root state detection algorithm called as Entry-Exit Algorithm (EEA). Executing any privileged command in the VM (in any level) causes an exit to the hypervisor host (VMX root or L0) which is labeled as vm_exit event. After handling the privileged command in VMX root mode,
the VM enters the VMX non-root mode which is called as vm_entry event. EEA uses vm_entry and vm_exit events to find out whether the code of the VM is running or the code of the host hypervisor. This algorithm is simplistic and could not detect other virtual levels. Figure 6 shows an example of EEA algorithm using the events from L0 (EEA-L0). The states are built using the sequence of events which are shown in Table I. The wake_up event shows that vCPU0 is woken up and it goes to the Wait state. The next event is sched_switch, which shows that the vCPU0 is being scheduled in and the state changes to L0 (VMX root). When receiving the vm_entry event, the state changes to L1 (VMX non-root) and then vm_exit changes the state to L0. This algorithm could not reveal if the VMX non-root mode is L1, L2, L3, etc.
In another example, we use the events from the VM in level 1 and then run the EEA algorithm. The result of this example is shown in Figure 6 as EEA-L1. As shown, the states are built incorrectly since the exit from L2 goes directly to L0, and L1 does not receive any event.
Using the ADA algorithm, the exact level of code execution can be detected. The ADA algorithm is illustrated with an example in Figure 6. When receiving the sched_switch event, the vCPU status goes to L0. The vm_entry event changes the status to L1 and the CR3 value of the guest is stored as the expected hypervisor CR3. CR3 points to the page directory of a process in any level of virtualization, and could be used as an unique identifier of a process. The next event, vm_exit, modifies the status of vCPU to L0 and, since the exit reason is not vm resume, it pops the CR3 value from expected hypervisor stack. Upon receiving the 5th event, the vCPU status changes to L1 again. The vm_exit with exit reason vm resume shows that the VM is running a nested VM inside. In this case, the expected hypervisor CR3 is marked as the CR3 of the hypervisor in L1. The next vm_entry(Event #7), changes the status of vCPU to L2. As mentioned, executing any privileged instruction in any level of nested VM causes an exit to L0. Therefore, the vm_exit modifies the vCPU state to L0. The algorithm uses the marked CR3 to distinguish between L1 and L2.
The pseudocode for the ADA algorithm is depicted in Algorithm 1. The ADA algorithm receives a sequence of events as input and updates the vCPU state. In this algorithm, we uses an array of List of hypervisors for level n. The candidates[m] (m is the level of nesting available) variable is an array of stacks which holds the hypervisor candidate for level n. In case the event is wake_up, the state of the vCPU is modified to the Wait state (Line 11). The most important event, sched_switch, shows when a vCPU is running on a pCPU. When a vCPU is scheduled in, it goes to the L0 state (Line 15) to load the previous state of the VM from the VMCS. It also updates the lastCR3 hash map to unkown (Line 16) since there is no previous process running on the VM. In contrast, when a vCPU is scheduled out, it goes to either the Idle state (Line 20) or the preempted state (Line 22). The getLastExit(vCPU) function returns the last exit for
existing vCPU. If the last last exit is hlt, which means that the VM runs the idle thread, the state will be modified as Idle. In other cases of exit reason, it will be changed to the preempted state. When receiving a vm_entry event, the state of the vCPU is adjusted to VMX non-root state. First, it uses the getCandidateLevel() function to find out the level of entry. The getCandidateLevel() function uses CR3, lCR3 (last hypervisor CR3), and a HashMap variable (levels) to find out the level of code execution for CR3. It compares CR3 with the available hypervisor lists in all levels to find out if the CR3 belongs to an hypervisor. In case CR3 is not found in the hypervisor list, it checks lCR3 to find out the last level of code execution (Line 26). The last exit reason is compared if it is VMRESUME or VMLAUNCH (Line 28). If the condition is true, it means that the VM in level n is running another VM. As a result, the last CR3 that was pushed to the hypervisor candidate list will be popped (Line 30), and will be added to hypervisors list in level n (Line 32). If the condition is false, the CR3 will be pushed to the candidate list for level n (Line 38). After calculating the level at the end of this event the state of vCPU will be updated to Ln (Line 39). Receiving any vm_exit changes the status to L0 (Line 42). We implemented the proposed algorithm in TraceCompass [28] as a new graphical view for vCPU threads inside the host, and vCPUs inside the VM. The vCPU state is stored in a tree shaped data based named State History Tree (SHT). In the next section, we present the results of some experiments using the ADA algorithm.
B. Nested VM State Detection Algorithm (NSD)
As mentioned in the previous section, each vCPU could be in one of VMX root, VMX non-root Lk, Preemption Lk, Wait, or Idle states. Among the aforementioned states, only in the VMX non-root Ln (n is the last level of code execution) state is the actual code of the nested VM being executed directly on a physical CPU. Other states increase completion time of the task inside a nested VM. As a result, finding these states lets the cloud administrator diagnose their VMs and nested VMs better. When a VM or nested VM does not have any code to execute, it exits with the hlt exit reason. If and only if a VM or nested VM is scheduled out from a pCPU without exiting with the hlt reason, it implies preemption. By observing where this preemption occurs, we are able to distinguish whether it was preempted by the scheduler of the VM or host. For example, in Figure 6, event #20 (vm exit) with exit reason hlt shows that the process inside the nested VM does not have any code to run, and the scheduler of the VM runs the idle thread (Event #26). As a result, the scheduler of the host schedules out the vCPU thread from the pCPU.
The Nested VM State Detection (NSD) algorithm is shown in Algorithm 2. The Ln preemption detection happens when the NSD receives the vm_entry event. It first inquires whether the CR3 value is a CR3 of the process, and if it was changed or not (Line 14). If the condition is true and the last exit reason is not hlt, the vCPU is being preempted by another process in Ln. Using the NSD algorithm, the cloud
Algorithm 1: Any-Level VM Detection Algorithm (ADA) Input : Trace T
Output: State of vCP U s
1 Initialization
2 VCPUs ←− {inital tid} 3 HashMap levels, lastCR3; 4 List hypervisorsList[m] ; 5 Stack candidates[m];
6 Main Procedure
7 for all event e ∈ T do 8 j = getVMvCPU(e.tid); 9 if e.type is wake up then 10 if tid == vCP Ujtid then
11 vCP UjState = Wait ;
12 else if e.type is sched switch then
13 k = getVMvCPU(prev tid);
14 if next tid == vCP Ujtid then
15 vCP UjState = L0 ;
16 putLastCR3(vCP Ujtid,unknown); 17 if prev tid == vCP Uktid then
18 last exit = getLastExit(vCP Uktid) ;
19 if last exit == hlt then
20 vCP UkState = Idle ;
21 else
22 vCP UkState = Preempted L0
23 else if e.type is vm entry then 24 last exit = getLastExit(vCP Ujtid) ; 25 lCR3 = getLastCR3(vCP Ujtid) ; 26 n = getCandidateLevel(CR3,lCR3) ; 27 hypervisors = getHypervisorsList(n);
28 if last exit == VMRESUME or VMLAUNCH
then 29 cHyperviors = getCandidateStack(n); 30 hCR3 = cHyperviors.pop(); 31 if !hypervisors.contains(hCR3) then 32 hypervisors.add(hCR3) ; 33 putHypervisorList(n,hypervisors) ; 34 levels.put(hCR3,n); 35 levels.put(CR3,n+1) ; 36 n ++; 37 if !hypervisors.contains(CR3) then 38 putCandidateStack(n,CR3) ; 39 vCP UkState = Ln ;
40 else if e.type is vm exit then 41 putLastExit(vCP Uj, exit reason) ; 42 vCP UjState = L0 ;
43 Utilities
44 Function getCandidateLevel(currentCR3, lastCR3): 45 int n;
46 if lastCR3 == unknown then
47 n = 0;
48 else
49 n = levels.get(currentCR3); 50 return n;
infrastructure provider could detect if the VM in any level is being preempted, by another VM or process in any level of nested virtualization.
Algorithm 2: Nested VM State Detection (NSD) Algo-rithm
Input : Trace T
Output: State of vCP U s
1 Main Procedure
2 for all event e ∈ T do 3 j = getVMvCPU(e.tid); 4 if e.type is sched switch then 5 else if prev tid == vCP Ujtid then 6 last exit = getLastExit(vCP Ujtid) ;
7 if last exit == hlt then
8 vCP UjState = Idle ;
9 else
10 vCP UjState = Preempted L0 ;
11 else if e.type is vm entry then 12 lCR3 = getLastCR3(vCP Ujtid) ; 13 last exit = getLastExit(vCP Ujtid) ; 14 if last exit != hlt and lCR3 != CR3 then
15 n = levels.get(CR3);
16 vCP UjState = Preempted Ln ;
C. Guest (Any-Level) Thread Analysis (GTA)
As we mentioned in the previous section, in each transition between root mode and non-root mode, the processor state is saved in the VMCS fields. The guest state is stored in the guest-state area in each vm_exit and is loaded from the guest-state area at each vm_entry. Also, the host state is retrieved at each vm_exit. The instruction pointer (IP), stack pointer (SP) and control registers (CR) are some of the registers that are modified during each transition in the VMCS guest-state area.
The process identifier (PID) and process name of each thread inside the guest are not directly accessible from host tracing. The only information which can be uncovered by host tracing about the threads inside the VMs is written in CR3 and SP. CR3 and SP can identify the process and thread, respectively. Indeed, CR3 points to the page directory of a process in any level of virtualization. All threads of a process use the same page directory, therefore switching between two threads within the same process does not change the CR3 value. SP points to the stack of the thread inside the VM. As a result, by retrieving these two identifiers, we can find out which thread is executing on a vCPU. To have more information about threads inside the VMs or Nested-VMs, we need to map CR3 and SP to the PID and process name. This is not strictly necessary, since CR3 and SP are unique identifiers of threads, but it is more convenient and human readable if we can map the process info inside the guest with the information we get from the vm_entry trace point.
The Guest (Any-Level) Thread Analysis (GTA) is illustrated in Algorithm 3. When the event is vm_entry, the stack pointer and CR3 of that thread are gathered from the VMCS guest state, and the process information of the VM is updated. If the mapping information from the VM is available, the CR3 and SP values are converted to the name of the process and threads (Line 9). With vm_entry and vm_exit events, it queries the state of the vCPU to update the state of the process and thread running on that vCPU (Line 6,13).
Algorithm 3: Guest (Any Level) Thread Analysis (GTA) Input : Trace T
Output: State of P rocesses
1 Main Procedure
2 for all event e ∈ T do 3 j = getVMvCPU(e.tid); 4 if e.type is vm entry then
5 n = getProcessLevel(CR3,lCR3) ; 6 Status = Query the status of vCP Uj ; 7 P rocessCR3n = Status ;
8 if Mapping == TRUE then
9 Map SP and CR3 with process memory map
of VM ;
10 Change the status of Thread to VMX
non-root ;
11 else if e.type is vm exit then 12 n = getProcessLevel(CR3,lCR3) ; 13 Status = Query the status of vCP Uj ; 14 P rocessCR3n = Status ;
15 if Mapping == TRUE then
16 Map SP and CR3 with process memory map
of VM ;
17 Change the status of Thread to Status ;
V. USE-CASES
This section covers a variety of known problems for the VMs that our technique could detect. First, the GTA algorithm is being evaluated to profile VM threads and processes. Then, we evaluate our VM tracing technique for the case of detect-ing issues for different resource types like CPU (subsection V-C), Memory (subsection V-D), and I/O (subsection V-E). Furthermore, different OS types (Linux and Windows) in VM levels are being compared in terms of overhead.
A. Analysis Architecture
Our approach is independent of the Operating System (OS) and could work on different architectures using Intel or AMD processors. Due to good nesting support, we have chosen KVM under the control of OpenStack, which is the most commonly used hypervisor for Openstack [29]. Our experiments with nested VMs is limited to one level of nesting because of KVM. For the userspace part of the hypervisor, we installed Qemu to execute the OS support for the VM. We also use the same architecture for nested VMs and VM
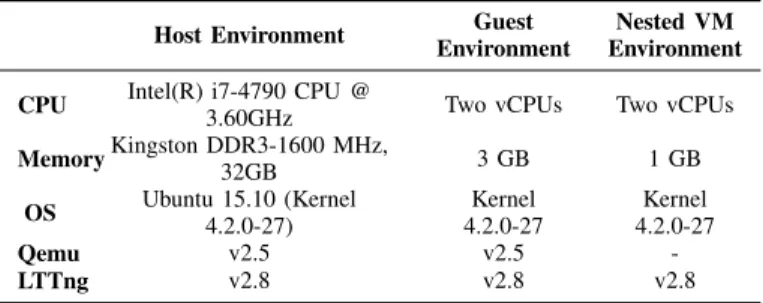
hypervisors. Our architecture is shown in Figure 7. As we can see, events are gathered by our tracer (LTTng) from the host hypervisor first, and then the events are sent to the trace analyzer (TraceCompass). Our experimental setup is described in Table II. The Qemu version is 2.5 and the KVM module is based on Linux kernel 4.2.0-27.
TABLE II: Experimental Environment of Host, Guest, and NestedVM
Host Environment Guest
Environment
Nested VM Environment
CPU Intel(R) i7-4790 CPU @
3.60GHz Two vCPUs Two vCPUs
MemoryKingston DDR3-1600 MHz, 32GB 3 GB 1 GB OS Ubuntu 15.10 (Kernel 4.2.0-27) Kernel 4.2.0-27 Kernel 4.2.0-27 Qemu v2.5 v2.5 -LTTng v2.8 v2.8 v2.8 Host Kernel Trace KVM Module Trace LTTng TraceCompass Openstack Virtual Machine VM Kernel KVM Module Host Kernel KVM Module Nested VM #1 Hardware Nested VM #n
Fig. 7: Architecture of our implementation
The analysis is performed according to the following steps :
1) Start tracing on the host; 2) Run the VMs of interest; 3) Stop tracing;
4) Run the analyses;
5) Display the result in the interactive viewer;
Among the available Linux tracers, we choose a lightweight tracing tool called the Linux Tracing Toolkit Next Generation (LTTng) [20] due to its low overhead kernel and userspace tracing facilities. Furthermore, in Linux, the KVM module is instrumented with static tracepoints and LTTng has appropriate kernel modules to collect them. Therefore, LTTng is particu-larly suitable for our experiment, since it collects Linux kernels and KVM module events with a low impact on VMs. We also added our own tracepoint (vcpu enter guest) to retrieve the CR3 and SP values from the VMCS structure, on each VMX transition, using kprobe. After the relevant events are generated and collected by LTTng, we study those with the trace analyzer, as elaborated in the next subsection. The events required for the analysis and the instrumentation method, along with their name in LTTng, are shown in Table III.
We implemented our event analyzers as separate modules in TraceCompass [28]. TraceCompass is an Open-source
soft-TABLE III: Events required for analysis
Category Event LTTng Event Method
scheduler sched switch sched switch tracepoint
scheduler wake up sched wakeup tracepoint
hypervisor vm exit kvm exit tracepoint
hypervisor vm entry kvm entry tracepoint
hypervisor vcpu enter guest kprobe
ware for analyzing traces and logs. It provides an extensible framework to extract metrics, and to build views and graphs.
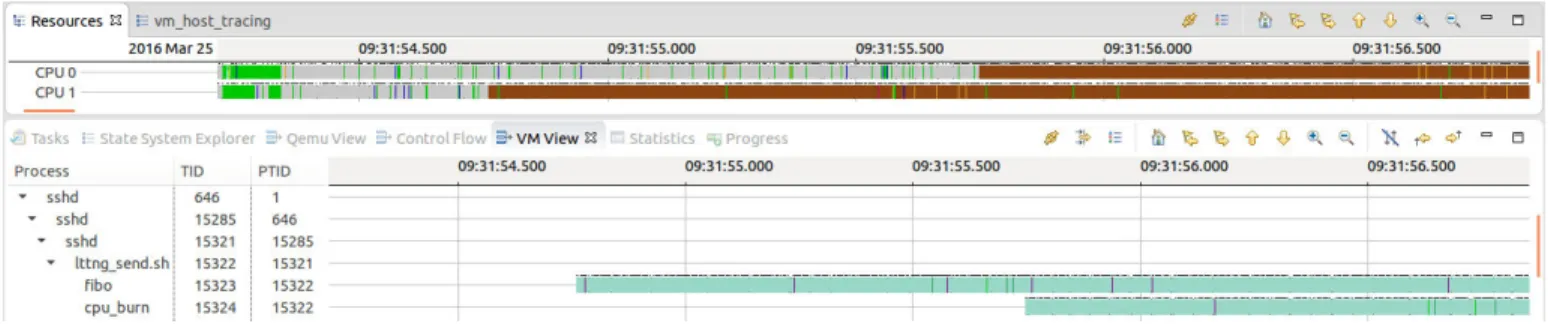
B. Thread-level and Process-level Execution Time Profiling We implemented the GTA algorithm in TraceCompass as a new graphical view for threads inside the VM. To examine our algorithm, we wrote two C programs that calculate Fibonacci numbers in a busy loop. We named them Fibo and cpu burn. We used ssh to connect to the VM. The Fibo program is run and, after 1 second, the cpu burn program is run. Figure 8 shows the resource view of the host and the VM thread view at the same time. We see that first a vCPU thread runs on pCPU1 and, after 1 second, another vCPU thread executes on pCPU0. We traced the host hypervisor and we used the GTA algorithm. The VM Thread view displays the threads running on these two pCPUs at that time. We observe that the Fibo program was running on pCPU1 and cpu burn was executing on pCPU0. As this result shows, the GTA algorithm could profile a process in a VM or Nested VM, without internal access.
The analysis of our tool reveals that just enabling the sched_switchtracepoint inside the guest adds almost 3% overhead to the guest execution. We claim that our approach adds a much lower, mostly negligible, overhead to the VM when the process information is dumped once during the whole trace.
C. CPU Cap and CPU Overcommitment Problem
Predicting VM workloads is a big challenge. Sometimes, cloud users set the VM CPU cap too low, which causes inad-equate CPU allocation. In another case, the cloud administrator overcommits CPU resources and shares among too many VMs. In both cases, these problems cause latency for the VMs. In our first experiment (S1-DiffGrp), we use Hadoop to calculate the nth binary digit of pi by using the Bailey Borwein Plouffe (BBP) formula. Any digit of pi can be calculated by BBP without calculating prior numbers. Therefore, calculating pi could be split into different tasks and could be mapped to several nodes. We conducted our experiment on a cluster where each VM had 2 vCPUs with 3 GB of memory. One VM is designated as master and 3 VMs are configured as Slave. All VMs are assigned to different resource groups in order to reduce the interference between VMs. In our experiment, each resource group had 2 physical CPUs (pCPU) and 6 GB of memory. The Hadoop version was 2.7 and Java version was 8. We used the YARN framework for job scheduling and resource management, and the Docker Container Executor (DCE) to allow the YARN NodeManager launching YARN
containers and running user code. During our experiment, the Hadoop resource manager created 8 containers on each slave node and the Hadoop application manager submitted 8 tasks to each of them. A job to calculate 500 digits of pi is submitted and is split into 24 maps. We realized that sometimes the execution time for calculating pi is more than expected. We investigated further and found out that node VM-Slave 2 finishes its associated task after other nodes (the application manager was in node VM-Slave 4). The same job is submitted again and the host is traced with LTTng. In our investigation with LTTng and NSD (shown in Figure 9), we found that node VM-Slave 2 is using more CPU compared to other VM-slaves. VM-Slave 2 is compared with VM-Slave 3 by looking at their processes (GTA Algorithm). Based on the comparison, VM-Slave 3 had 8 active processes, but VM-Slave 2 had 9 active processes. Comparing processes of VM-Slave 2 and VM-Slave 3 shows that process with CR3 5263425536 is not a Hadoop container and uses one CPU most of the time. This process could be another application that is scheduled to run at a specific time (e.g., update). In this scenario, Hadoop containers should share vCPU with another application inside the VM-Slave 2, which is the cause for the delay in finishing associated task.
In the second experiment (S2-SameGrp), we used the same configuration except that we put two VM-Slaves (VM-Slave 1 and VM-Slave 2) in the same resource group. We observed that the tasks submitted to VM-Slave 1 and VM-Slave 2 took more time to be completed (around 49% increase). The results of S2-DiffGrp and S2-SameGrp are shown in Table IV. We investigated the reason by using the NSD and found that VM-Slave 1 and VM-VM-Slave 2 are preempting each other most of the time. The reason is that the tasks submitted to both VM-Slaves were a CPU intensive job and VMs fought for existing CPUs.
TABLE IV: Completion time for Hadoop VM-Slaves in dif-ferent scenarios.
Scenario VM name Completion
Time (sec) Usage Time (sec) Preemption Time (sec) VM-Slave 1 27.5 46.832 0.102 S2-DiffGrp VM-Slave 2 35.6 70.795 0.104 VM-Slave 3 26.7 49.144 0.238 VM-Slave 1 53.917 55.971 13.89 S2-SameGrp VM-Slave 2 53.328 53.532 13.47 VM-Slave 3 27.904 54.756 0.141
As discussed, preemption could happen in any level of virtualization, which is a cause of latency. In this new scenario, we show how our analysis could reveal unexpected delays in nested VMs. For these experiments (S3-Nest1VM), we configure our testbed as explained in section V-A. Sysbench is set to run 60 times and compute the first 1000 prime numbers. After each task execution, it waits for 600 ms and then re-executes the task. We start a VM with two vCPUs and a nested VM with two vCPUs inside. We pin the nested VM vCPUs to the vCPU 0 of the VM and we pin the vCPUs of the VM to
Fig. 8: Control flow view of threads inside the virtual machine
Fig. 9: Three slaves running one submitted task- VM-Slave 2 responses late to each task
the pCPU 0 of the host. We do this to ensure that the code of nested VMs executes on pCPU 0. As expected, the execution time for the same task should be almost equal. On average, the completion time for finding the first 1000 prime numbers is 327 ms, with a standard deviation of 8 ms.
In the next experiment (S4-Nest2VM), we launch two nested VMs in VM testU1. Both nested VMs have two vCPUs that are pinned to vCPU 0 and vCPU 1 of the VM. The rest of the configuration is kept the same as in the previous experiment, with the exception of Sysbench executing in the nested VM2, being configured to wait 1 sec after each execution. We start Sysbench at the same time for both nested VMs and we start tracing the nested VM1 with LTTng. In our investigation with LTTng, we realized that the execution time for the same task varied more than expected. Figure 10 shows the execution time for the same load. We see that it varies between 339 and 661 ms. The execution time for 60 executions of the same load is 465 ms with a standard deviation of 120 ms. To investigate the cause of the execution time variation, we traced the host and used our NSD algorithm to detect the different states of nested VMs. Figure 11 shows the result of our analysis as a graphical view. By tracing only the host, we first detect that the testU1 VM is running two nested VMs. Then, we further find out when the code of each nested VM is running on the physical CPU. By looking at the view, we can infer that, during the execution, two nested VMs are preempting each other several times. For more details, we zoom in a section where the two nested VMs are preempting each other, and can observe the events along with fine-grained timing. This preemption occurs at the VM hypervisor level and
is more or less imperceptible by the host hypervisor.
In another experiment (S5-2VM1NestVM), we turn off one of the nested VMs and launch two other VMs in the host. The VMs and Nested VM are configured as before, except that now we set Sysbench to wait 800 ms after each execution in the VMs. Our investigation shows that the completion time on average for 60 runs of the same load on the nested VM is 453 ms, with a standard deviation of 125 ms. We traced the host hypervisor and exploit our NSD algorithm to investigate the problem further. As Figure 12 shows, the nested VM inside VM testU1 is being preempted. In this experiment, the preemption occurs at the host hypervisor level, when VMs are preempting each other.
In the next experiment (S6-2VM2NestVM), we launch another nested VM inside VM testU1 (NestedVM 2). We also start VM testU2 and set Sysbench to find the first 1000 prime numbers, like in the previous experiment. In this experiment, each VM and nested VM have one CPU and all CPUs are pinned to pCPU 0. We start the test at the same time for the VM and all nested VMs. As a result of this experiment, we find that the completion time for the same task varies a lot. On average, the execution time for each task takes 651 ms, compared to 327 ms in the first experiment. Moreover, the standard deviation for 60 Sysbench runs was 371 ms. We investigated the cause of this problem by executing the NSD algorithm. Figure 13 shows that nested VMs were preempting each other along with VM testU2. In this test, we have preemptions from L0 and L1, which cause serious delays in the completion time of tasks. It is worth mentioning that none of these observed preemptions, at any level, are detectable with conventional state-of-the-art tools.
There is a trade-off between CPU utilization and preemp-tion. As CPU utilization increases, more preemptions occur. IaaS providers wish to increase resources utilization to gain profit while maintaining a high QoS to stay in the business. Overcommitment of CPUs may cause serious latencies for VMs. Therefore, preemption can be one of the most important factors in the service level agreement (SLA) between the VM user and the Cloud provider. Using our analysis, the cloud provider could find out when preemption occurs and which VM is preempting others more.
Fig. 10: Execution time of the prime thread (CPU view)
Fig. 11: Resource view of CPU for two nested VMs inside VM testU1 by host tracing - L1 Level Preemption
Fig. 12: Resource view of CPU for one nested VM inside VM testU1 preempted by testU2 by host tracing - L0 Level Preemption
Fig. 13: Resource view of CPU for two different nested VMs inside VM testU1 preempted by VM testU2 and each other by host tracing - L0 and L1 Levels Preemption
D. Memory Overcommitment Problem
In this section, we represent how overcommitting the mem-ory could increase the latency in VMs. Real-time informa-tion delivery, which uses in-memory storage, is an emerg-ing topic that comes with cloud computemerg-ing technology. In-memory databases are faster than disk-optimized databases, since access to memory is faster than disk. MemSQL, Redis, and Memcached are examples of in-memory data storage. Github, Twitter, and Flickr use different in-memory storage applications on top of cloud infrastructures to deliver real-time information to their users [30]. In this experiment, we show the ability of our technique to detect memory problems. Each vm_exit event has a reason, which is written in the
exit reason field. For example, if a syscall_read executes in the VM, it causes a vm_exit with exit reason of 30, which is I/O instruction [26]. The frequency of each different exit reason contains a lot of information about the instructions running in the VM. For example, a high frequency of exit reason 30 shows intense I/O activity in a VM.
EPT violation is another vm_exit reason that changes the state of the vCPU from VMX non-root to root. It occurs when a VM attempts to access a page that is not allowed by the EPT paging structure, known as a VM page fault. IaaS providers overcommit virtual resources to maximize utilisation and thus use fewer servers. However, sometimes overcommitting virtual resources saturates the resources and causes some issues for
VMs. In order to find out frequent exit reasons, we wrote an analysis that could determine the more frequent exit reasons and the associated execution duration. This analysis can help us to guess the behavior of the thread running in the VM and uncover any undue latency.
The same architecture as described in section V-C is being used for our new experiment. We wrote a C program that writes random numbers into 1GB of memory, named eat mem. This program executes frequently in VM1, VM2, and VM3. We also wrote another program that randomly executes a small CPU intensive task inside VM4 and VM5. Furthermore, in order to overcommit the memory, we modified the eat mem program to use 25 GB of RAM in the host. The result of our experiment is found in Table V. We observed that VM1, VM2, and VM3 suffered more from overcommitting the memory since they were executing a memory intensive program. VM1, VM2, and VM3 were executing eat mem for 1.5s in average, but 15% of their time is wasted in average, because of overcommitting the memory. Also, we can infer that VM1 is suffering more from memory overcommitment. Our technique is also able to detect memory overcommitment inside a VM. We could find out memory overcommitment over any level of virtualization by using the NSD algorithm.
TABLE V: Execution time for different VMs when the host is suffering from Memory overcommitment.
VM name Execution Time(ms) Freq EPT Violation Violation EPT Time(ms) Percentage(%) VM1 1329.0 3554 237.4 17.8 VM2 1834.5 18801 260.5 14.2 VM3 1332.4 15288 141.2 10.6 VM4 1169.1 0 0 0 VM5 1857.8 30 0.2 0
E. Overhead of Virtualization Layer for Different Types of Workload
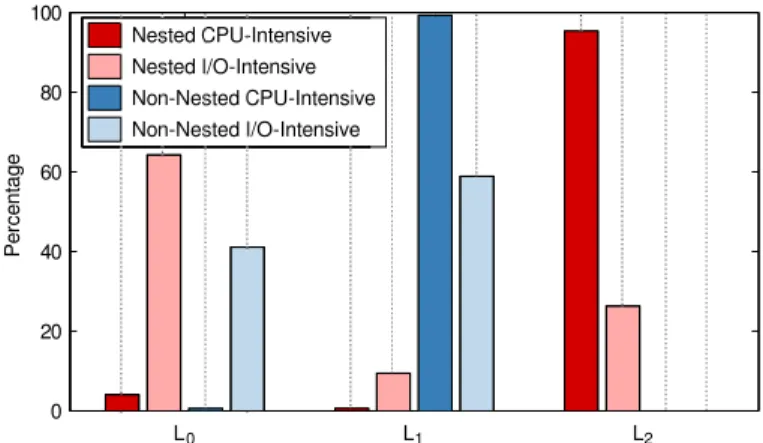
In this section, the latency added to the applications inside a VM in any level is discussed. In addition, two possible ways of handling any privileged instruction are studied. For the first handling path, where L0handles the instruction and forwards it to L1, we wrote an application to read 32 sectors of the disk. This type of workload is I/O intensive and needs nu-merous interactions between the different virtualization layers. For another possible path, where L0 handles the privileged instruction and then directly executes the VM code, we used our Fibo application to calculate 10000 Fibonacci numbers. We execute these applications inside a VM and a Nested VM. Figure 14 depicts the percentage of the elapsed time in the different layers of virtualization. When a VM or a nested VM runs a CPU-intensive job, the percentage of application code executing is much higher than handling privileged instructions (around 99%). As can be inferred from this figure, in this case, the nested VM rarely exits to L0 and updates L1. In contrast, the VM exits to L0 and then enters L1 to update the
necessary information when it is executing an I/O intensive job. In average, in our experiment for a nested VM, our application runs 26.31% of the time, and otherwise executes code of different levels of the hypervisor (around 73%).
L0 L1 L2 0 20 40 60 80 100 Percentage Nested CPU-Intensive Nested I/O-Intensive Non-Nested CPU-Intensive Non-Nested I/O-Intensive
Fig. 14: Overhead of Virtualization for different types of workload
In another experiment, an RPC server and client are written to experiment the effect of wake-up latency on applications inside VMs and nested VMs. In this experiment, our RPC server could accept any command from the RPC client and executes it. The RPC client sends a sleep(0.1) command to the RPC server to execute every 100 ms. This causes our RPC server to run frequently. As Figure 15 shows, for a nested VM the added overhead is higher than for a VM without nesting. The reason is that different layers of virtualization need to be updated. L0 L1 0 5 10 15 20 25 30 35 Time (ms) 2−Level 1−Level
Fig. 15: Average wake up latency for Nested VMs and VMs
F. Overhead of Virtualization for Different Operating Systems In this subsection, we present the results of virtualization overhead imposed by different levels of virtualization, when the OS in the VM is not Linux. The added overhead, imposed by the different layers of virtualization is,
OV Mj =
n−1 X i=0
Where TLi is the elapsed time in different levels of
hypervi-sors. The utilisation rate of the application running inside the VM is calculated in Equation 2. It is defined as the time when the actual code of the VM is running divided by total time of running an application on the pCPU.
UV Mj =
TLn
Pn i=0TLi
(2)
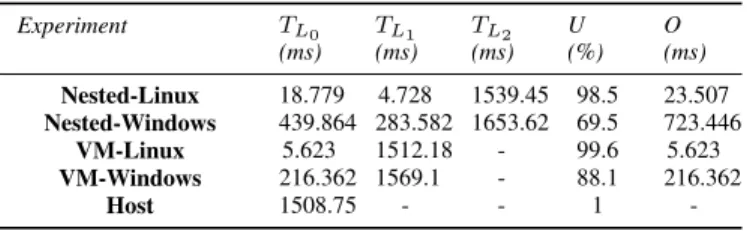
In this experiment, we used Qemu-KVM as hypervisor. In Qemu-KVM, two levels of nested virtualization are imple-mented and the main thread of Qemu-KVM is responsible for reacting to events that are dispatched to event handlers. If the received event is an I/O event, the task will be submitted to worker threads. Otherwise, the main thread wakes up the vCPU thread and injects the event as an interrupt to the vCPU. We tested our method for a simple C program, named as Fibo, that calculates 10000 Fibonacci numbers. We executed our Fibo program on one level of virtualization and two levels of virtualization. Furthermore, to show that our method works for any VM OS, we tested the Fibo program on the Windows and Linux OS. We observed that running the Fibo program on Windows takes more time than on Linux, for both one level and two levels of virtualization. We investigated this further with our thread analyzer and found out that a specific thread named System is running periodically inside Windows. The System process inside Windows OS is responsible for handling interrupts. We also discovered that the main thread of Qemu-KVM injects interrupts periodically to the VM, and the System process inside Windows handles it. Further investigation showed that the injected IRQ is the timer interrupt which we did not observe when using Linux. Newer Linux VM on the Qemu-KVM hypervisor uses the kvm-clock as paravirtual clock device. When the guest starts, it creates a memory page that shares the kvm-clock data with the hypervisor. The hypervisor constantly updates the clock data with the time information. Therefore, the guest does not need to use a local APIC timer interrupt on each CPU to generate the scheduler interrupt. Contrary to Linux VM, Windows VM on KVM uses periodic RTC clocking that requires interrupt rescheduling for time keeping. When running Windows, this paravirtualization optimisation is not programmed in Windows, and even if the VM is idle, the main thread of Qemu-KVM injects timer interrupt almost every 15.6 ms. Otherwise, when a program is running, the main thread of Qemu-KVM injects the timer interrupt more frequently. As a result, more computing power will be wasted. We did this experiment 10 times and the average of our results is depicted in Table VI. In the case of Nested Windows, the VM frequently exits from L2 to L1, and then, to resume the nested VM, it goes to L1to update V M CS12. The added overhead is mainly because of the injected timer update interrupt. We can see that the utilization rate decreases from 98.5% to 69.5% when we use a nested Windows VM. Using nested VMs with Linux for CPU intensive tasks does not add much overhead to the execution of our jobs. As we observed, the nested VM adds 0.1% overhead to the execution of our Fibo program.
TABLE VI: Execution time for Fibo program on different levels of virtualization and different Operating Systems.
Experiment TL0 (ms) TL1 (ms) TL2 (ms) U (%) O (ms) Nested-Linux 18.779 4.728 1539.45 98.5 23.507 Nested-Windows 439.864 283.582 1653.62 69.5 723.446 VM-Linux 5.623 1512.18 - 99.6 5.623 VM-Windows 216.362 1569.1 - 88.1 216.362 Host 1508.75 - - 1 -VI. EVALUATION
A. virtFlow Overhead Analysis
In this subsection, we compare two other existing ap-proaches with the NSD algorithm in terms of added overhead to the nested VMs.
The first approach is to trace the host and guest hypervisors (L1L0) and then use the method that is proposed in [23]. Another technique is to trace both hypervisors and each nested VM (L2L1L0) [22]. In both approaches, the cloud administrator needs the authorization to access each VM and Nested VM. Table VII presents the added overhead to the nested VMs for the different algorithms. We configured the Sysbench benchmark to study the overhead by running 60 times CPU, Disk I/O, and Memory intensive evaluations. To evaluate the network overhead, iperf is being configured. Then, we averaged all results, to avoid unexpected latencies in our analysis. We enabled all the necessary events for each analysis. It is worth mentioning that other approaches need to access VMs and nested VMs, as compared to our new proposed approach which is purely a host hypervisor-based algorithm. As shown in the table, our approach adds less overhead to the nested VMs, since it only traces the host hypervisor. In the CPU, Memory, and Network intensive workloads, we add negligible overhead. For the I/O intensive evaluation, the overhead is 34.6 %, which is expected since LTTng is also using the same Disk to store the trace. Indeed, the performance of a disk degrades significantly when two processes compete to access the disk, since each may have an efficient sequential access load, but the mix of the two becomes an inefficient seemingly random access load. This is a well-known problem and using a separate disk for storing the trace data is recommended whenever I/O bound processes are being traced.
TABLE VII: Comparison of our approach and the other multi-level tracing approaches in term of overhead for synthetic loads
Benchmark Baseline L2L1L0L1L0 NSD L Overhead(%)
2L1L0L1L0 NSD
File I/O (ms) 546 809 773 735 48.2 41.5 34.6
Net I/O (GB) 50.2 12.7 33.3 48.2 28.65 6.72 3.98
Memory (ms) 497 505 503 502 1.6 1.2 1
B. Ease of Deployment
Our technique for analyzing VMs uses a few (four events) host hypervisor tracepoints. Other available methods ( [22] and [21]), trace each relevant VM and the host. In the absence of a global clock, between the host and each VM, a synchronization method must be used. A big challenge of synchronization methods is that they need extra events in order to be sufficiently precise. This adds extra overhead to the VMs and host. It also increases the completion time for the analysis part. Our method does not need any synchronization, since it receives all the events from the same clock source in the host. It could be implemented on other OS types, since it only needs to enable the events illustrated in Table III.
C. Limitations
Our technique is limited to the host data, and guest OS specific information is not accessible with our method. For example, our technique could not detect a container in a VM, but it could show it as a separate process using the GTA algorithm. In contrast, other trace-based methods ( [22] and [21]) provide more useful insights about running processes and their interaction with the guest kernel.
VII. CONCLUSION
Nested virtualization is frequently used for software scaling, compatibility, and security in industry. However, in the nested virtualization context, current monitoring and analysis tools do not provide enough information about VMs for effective debugging and troubleshooting. In this paper, we address the issue of efficiently analyzing the behavior of such VMs. Our technique can detect different problems along with their root causes in nested VMs and their corresponding VMs. Furthermore, our approach can uncover different levels of code execution among all the host and nested VMs layers. Our approach is based exclusively on host hypervisor tracing, which adds less overhead as compared to other approaches. Our benchmarks show that the added overhead in our ap-proach was around 1%. In contrast, the overhead of other approaches ranged from 1.2 to 4.9%. We also proposed a way to effectively visualize the different levels of code execution in nested VMs along with their state. These graphical views show the timing at high-resolution of all VMs and nested VMs executions. Our technique is being tested for different types of guest OS to investigate performance issues. As future work, our current technique can be enhanced to further investigate interferences between VM and nested VMs. It could be used to understand the cause of waiting for each process inside the VM. In addition, based on the extracted metrics, we could group VMs and Nested VMs based on their behavior.
ACKNOWLEDGMENT
We would like to gratefully acknowledge the Natural Sci-ences and Engineering Research Council of Canada (NSERC), Ericsson, Ciena, and EffciOS for funding this project. We thank Suchakrapani Datt Sharma, Francis Giraldeau, Naser Ezzati and Genevieve Bastien for their comments.
REFERENCES
[1] G. Aceto, A. Botta, W. de Donato, and A. Pescap, “Cloud monitoring: A survey,” Computer Networks, vol. 57, no. 9, pp. 2093 – 2115, 2013.
[2] “Linux kenrel github,” https://git.kernel.org/pub/scm/linux/
kernel/git/torvalds/linux.git/log/arch/x86/kvm/vmx.c, 2018, accessed: 2018-02-12.
[3] “Support for running esxi/esx as a nested virtualization solution,” https://kb.vmware.com/s/article/2009916, 2017, accessed: 2018-02-12. [4] “Nested virtualization in xen,” https://wiki.xenproject.org/wiki/
Nested Virtualization in Xen, 2017, accessed: 2018-02-12.
[5] F. Zhang, J. Chen, H. Chen, and B. Zang, “Cloudvisor:
Retrofitting protection of virtual machines in multi-tenant cloud with nested virtualization,” in Proceedings of the Twenty-Third ACM
Symposium on Operating Systems Principles, ser. SOSP ’11. New
York, NY, USA: ACM, 2011, pp. 203–216. [Online]. Available: http://doi.acm.org/10.1145/2043556.2043576
[6] Intel, “s,” in McAfee Deep Defender Technical Evaluation and Best
Practices Guide. 2821 Mission College Boulevard Santa Clara, CA
95054: Intel Press, Aug 2012, pp. 1–48.
[7] “Windows xp mode,”
https://www.microsoft.com/en-ca/download/details.aspx?id=8002, 2009, accessed: 2018-02-12.
[8] “Ravello systems: Virtual labs using nested virtualization,”
https://www.ravellosystems.com/, 2018, accessed: 2018-02-12. [9] “Amazon cloudwatch,” https://aws.amazon.com/cloudwatch/, 2018.
[10] “Cisco cloud consumption service,”
http://www.cisco.com/c/en/us/solutions/cloud/cloud-consumption-service.html, 2016, accessed: 2018-02-12.
[11] “OpenStack telemetry measurements metrics
defini-tion,”
http://docs.openstack.org/admin-guide-cloud/telemetry-measurements.html, 2017, accessed: 2018-02-12.
[12] D. Novakovi´c, N. Vasi´c, S. Novakovi´c, D. Kosti´c, and R. Bianchini, “Deepdive: Transparently identifying and managing performance inter-ference in virtualized environments,” in USENIX Coninter-ference on Annual Technical Conference. USENIX Association, 2013, pp. 219–230. [13] K. N. Masao Yamamoto, Miyuki Ono, “Unified performance profiling
of an entire virtualized environment,” in International Journal of Net-working and Computing, January 2016, pp. 124–147.
[14] J. Du, N. Sehrawat, and W. Zwaenepoel, “Performance profiling of virtual machines,” in Proceedings of the 7th ACM SIGPLAN/SIGOPS International Conference on Virtual Execution Environments, ser. VEE
’11. New York, NY, USA: ACM, 2011, pp. 3–14.
[15] A. Khandual, “Performance monitoring in linux kvm cloud environ-ment,” in Cloud Computing in Emerging Markets (CCEM), 2012 IEEE International Conference on, Oct 2012, pp. 1–6.
[16] A. Anand, M. Dhingra, J. Lakshmi, and S. K. Nandy, “Resource usage monitoring for kvm based virtual machines,” in Advanced Computing and Communications (ADCOM), 2012 18th Annual International Con-ference on, Dec 2012, pp. 66–70.
[17] S. Wang, W. Zhang, T. Wang, C. Ye, and T. Huang, “Vmon: Monitoring and quantifying virtual machine interference via hardware performance counter,” in Computer Software and Applications Conference (COMP-SAC), 2015 IEEE 39th Annual, vol. 2, July 2015, pp. 399–408. [18] M. Graziano, A. Lanzi, and D. Balzarotti, Hypervisor Memory Forensics,
2013, pp. 21–40.
[19] D. J. Dean, H. Nguyen, P. Wang, X. Gu, A. Sailer, and A. Kochut, “Per-fcompass: Online performance anomaly fault localization and inference in infrastructure-as-a-service clouds,” IEEE Transactions on Parallel and Distributed Systems, vol. 27, no. 6, pp. 1742–1755, June 2016. [20] M. Desnoyers and M. R. Dagenais, “The lttng tracer: A low impact
performance and behavior monitor for gnu/linux,” in OLS (Ottawa Linux Symposium) 2006, 2006, pp. 209–224.
[21] M. Gebai, F. Giraldeau, and M. R. Dagenais, “Fine-grained preemption analysis for latency investigation across virtual machines,” Journal of Cloud Computing, vol. 3, no. 1, p. 23, Dec 2014. [Online]. Available: https://doi.org/10.1186/s13677-014-0023-3
[22] C. Biancheri, N. Eezzati-Jivan, and M. R. Dagenais, “Multilayer virtu-alized systems analysis with kernel tracing,” in 2016 IEEE 4th Interna-tional Conference on Future Internet of Things and Cloud Workshops (FiCloudW), Aug 2016, pp. 1–6.
[23] H. Nemati and M. R. Dagenais, “Virtual cpu state detection and execution flow analysis by host tracing,” in 2016 IEEE International Conferences on Big Data and Cloud Computing (BDCloud), Social Computing and Networking (SocialCom), Sustainable Computing and
Communications (SustainCom) (BDCloud-SocialCom-SustainCom), Oct 2016, pp. 7–14.
[24] S. D. Sharma, H. Nemati, G. Bastien, and M. Dagenais, “Low overhead hardware-assisted virtual machine analysis and profiling,” in 2016 IEEE Globecom Workshops (GC Wkshps), Dec 2016, pp. 1–6.
[25] H. Nemati, S. D. Sharma, and M. R. Dagenais, “Fine-grained nested virtual machine performance analysis through first level hypervisor
tracing,” in Proceedings of the 17th IEEE/ACM International
Symposium on Cluster, Cloud and Grid Computing, ser. CCGrid ’17. Piscataway, NJ, USA: IEEE Press, 2017, pp. 84–89. [Online]. Available: https://doi.org/10.1109/CCGRID.2017.20
[26] I. Corporation, “Intel 64 and ia-32 architectures software developers manual,” December 2015, pp. 1–3883.
[27] M. Ben-Yehuda, M. D. Day, Z. Dubitzky, M. Factor, N. Har'El, A. Gordon, A. Liguori, O. Wasserman, and B.-A. Yassour, “The turtles project: Design and implementation of nested virtualization,” in 9th USENIX Symposium on Operating Systems Design and Implementation
(OSDI 10). Vancouver, BC: USENIX Association, 2010.
[28] “Trace compass,” https://projects.eclipse.org/projects/tools. tracecom-pass, 2018.
[29] “Open source software for creating clouds ,” https://www.openstack.org/, 2018, accessed: 2018-02-12.
[30] “Who’s using redis,” http://redis.io/topics/whos-using-redis, 2018, ac-cessed: 2018-02-12.