Titre:
Title:
temperature conditions in multimodal environments: thermal
versus visible spectrum video-based systems
Auteurs:
Authors:
Ting Fu, Joshua Stipancic, Sohail Zangenehpour, Luis Miranda-
Moreno et Nicolas Saunier
Date: 2017
Type:
Article de revue / Journal articleRéférence:
Citation:
Fu, T., Stipancic, J., Zangenehpour, S., Miranda-Moreno, L. & Saunier, N. (2017). Automatic traffic data collection under varying lighting and temperature
conditions in multimodal environments: thermal versus visible spectrum video-based systems. Journal of Advanced Transportation, 2017, p. 1-15.
doi:10.1155/2017/5142732
Document en libre accès dans PolyPublie
Open Access document in PolyPublieURL de PolyPublie:
PolyPublie URL: https://publications.polymtl.ca/3532/
Version: Version officielle de l'éditeur / Published versionRévisé par les pairs / Refereed
Conditions d’utilisation:
Terms of Use: CC BY
Document publié chez l’éditeur officiel
Document issued by the official publisherTitre de la revue:
Journal Title: Journal of Advanced Transportation Maison d’édition:
Publisher: Hindawi URL officiel:
Official URL: https://doi.org/10.1155/2017/5142732 Mention légale:
Legal notice:
Ce fichier a été téléchargé à partir de PolyPublie, le dépôt institutionnel de Polytechnique Montréal
This file has been downloaded from PolyPublie, the institutional repository of Polytechnique Montréal
Research Article
Automatic Traffic Data Collection under Varying Lighting and
Temperature Conditions in Multimodal Environments: Thermal
versus Visible Spectrum Video-Based Systems
Ting Fu,
1Joshua Stipancic,
1Sohail Zangenehpour,
1Luis Miranda-Moreno,
1and Nicolas Saunier
21Department of Civil Engineering and Applied Mechanics, McGill University, Room 268, Macdonald Engineering Building,
817 Sherbrooke Street West, Montr´eal, QC, Canada H3A 0C3
2Department of Civil, Geological and Mining Engineering, Polytechnique Montr´eal, CP 6079, Succ. Centre-Ville,
Montr´eal, QC, Canada H3C 3A7
Correspondence should be addressed to Ting Fu; [email protected] Received 20 June 2016; Accepted 21 September 2016; Published 9 January 2017 Academic Editor: Yue Liu
Copyright © 2016 Ting Fu et al. This is an open access article distributed under the Creative Commons Attribution License, which permits unrestricted use, distribution, and reproduction in any medium, provided the original work is properly cited.
Vision-based monitoring systems using visible spectrum (regular) video cameras can complement or substitute conventional sensors and provide rich positional and classification data. Although new camera technologies, including thermal video sensors, may improve the performance of digital video-based sensors, their performance under various conditions has rarely been evaluated at multimodal facilities. The purpose of this research is to integrate existing computer vision methods for automated data collection and evaluate the detection, classification, and speed measurement performance of thermal video sensors under varying lighting and temperature conditions. Thermal and regular video data was collected simultaneously under different conditions across multiple sites. Although the regular video sensor narrowly outperformed the thermal sensor during daytime, the performance of the thermal sensor is significantly better for low visibility and shadow conditions, particularly for pedestrians and cyclists. Retraining the algorithm on thermal data yielded an improvement in the global accuracy of 48%. Thermal speed measurements were consistently more accurate than for the regular video at daytime and nighttime. Thermal video is insensitive to lighting interference and pavement temperature, solves issues associated with visible light cameras for traffic data collection, and offers other benefits such as privacy, insensitivity to glare, storage space, and lower processing requirements.
1. Introduction
In transportation management, planning, and road safety, collecting data for both motorized and nonmotorized traffic is necessary [1]. Collecting vehicle data was traditionally limited to manual data collection or inductive loops at fixed locations [2], to the point that loops became standard in many jurisdictions and are still widely used today [3]. However, traditional loops do not provide any spatial coverage and do not capture all road user types (loop detectors exist for bicycles but do not count vehicles or pedestrians). Trajectory data for all users (pedestrians, bicycles, and vehicles) is essential to understand microscopic behaviour and surrogate safety analysis in critical road facilities such as intersections
with high nonmotorized traffic volumes [4]. These factors have spurred the development of nonintrusive traffic sensors of which video-based devices are among the most promising [1]. Vision-based monitoring systems are widely used in ITS applications [5], can complement or substitute conventional sensors [6], enable multiple lane detection [2], and provide rich positional and classification data [7] beyond the capabil-ities of traditional devices [8].
These benefits notwithstanding, there are several critical limitations associated with using regular video cameras, also referred to as visible spectrum video cameras, for traffic data collection. As these cameras rely on the visible light spectrum, the accuracy of detection, tracking, and classifi-cation is “sensitive to environmental factors such as lighting,
Volume 2017, Article ID 5142732, 15 pages https://doi.org/10.1155/2017/5142732
shadow, and weather conditions” [5, 9]. Perhaps the greatest limitation of regular cameras is varied performance in low light conditions and darkness [10]. Considering detection and classification at nighttime, “the light sensitivity and contrast of the camera. . .are generally too weak” [1] to compensate for “the interference of illumination and blurriness” [11]. This is particularly problematic because the increased injury risk associated with nighttime conditions leads to more, and more severe, road traffic crashes [12]. During daytime, shadows and glare degrade the accuracy of extracted data [5, 8]. This is why typical computer vision approaches developed for daytime surveillance may not work under all conditions [1], and the advancement of vision-based traffic sensors is a pressing matter [8].
Recently, new camera (sensor) technologies, including thermal or infrared sensors for traffic surveillance, have become available. Although the present cost of these cameras has prevented their widespread use in traffic analysis, cost will continue to decrease as the technology advances. Recogniz-ing that it “is difficult to cope with all kinds of situations with a single approach” [5], the performance of thermal cameras must be compared to regular cameras across varied lighting and visibility conditions to satisfy the desire for an “around-the-clock” video-based traffic sensor [8]. In recent years, var-ious computer vision techniques for tracking, classification, and surrogate safety analysis have been developed [7, 13], though nearly all these methods were developed and tested using regular video cameras. It is unclear if these methods can be directly applied to thermal video and whether thermal cameras offer a performance advantage compared to regular cameras across lighting and temperature conditions.
The purpose of this study is (i) to integrate existing track-ing and classification computer vision methods for automated thermal video data collection under low visibility conditions, nighttime and shadows, and (ii) to evaluate the perfor-mance of thermal video sensors under varying lighting and temperature conditions compared to visible light cameras. Performance is evaluated with respect to road user detection, classification, and vehicle speed measurements. Lighting and temperature conditions where each camera outperformed the other are identified to provide practical recommendations for the implementation of video-based sensors. An early version of this paper has been presented previously [14, 15].
2. Literature Review
The difficulties associated with collecting traffic data using regular cameras, and attempts to rectify these issues, have been well documented in the existing literature, though many existing studies do not appropriately report performance, be it for detection, classification, or tracking. Yoneyama et al. [5] demonstrated that nighttime detection misses are up to 50% and false alarms are 3.4% of the ground truth total, much higher than for daytime detection. Robert [1] showed that vehicle counts were accurate in various lighting, weather, and traffic conditions when using a headlight detection method, although sample sizes were generally 100 vehicles or less. Methods that detect headlights or taillights are typically only applicable at night, and the headlight detection method
may increase the difficulty of vehicle classification [8]. Thi et al. [11] proposed a methodology using eigenspaces and machine learning for classification from regular video at nighttime. The authors found a successful classification rate of 94% compared to 70% or lower for other classification schemes. Coifman et al. [17] suggested that “to be an effective traffic surveillance tool. . .a video image processing system. . .should. . .function under a wide variety of lighting conditions.” The authors proposed feature-based tracking as an improvement over those methods dependent on identify-ing an entire vehicle, because even under different lightidentify-ing or visibility conditions “the most salient features at the given moment are tracked” [17]. The proposed algorithm was evaluated on highways where it was generally successful at tracking vehicles in situations including congestion, shadows, and varying lighting conditions.
With the limited success of regular cameras in adverse conditions, many researchers have considered alternative technologies for traffic data collection. Balsys et al. [18] identified that weather interference could be avoided using infrared (thermal) cameras, demonstrating that the cameras eliminated issues associated with headlight glare at night and cast shadows during the day. Thermal video demonstrated a 15% improvement in detection rate over visible light cameras. Sangnoree and Chamnongthai [10] presented a method for detecting, classifying, and measuring speeds of vehicles at night using thermal videos. Although classification and speed estimation were successful, detection worked best when only a single vehicle was present in the video frame (84% success) but suffered when two or more vehicles were present (41–76% success). Iwasaki [19] developed a vision-based monitoring system that works robustly around the clock using infrared thermography. Iwasaki et al. [8] achieved 96% successful detection of vehicles using thermal video in poor visibility conditions. MacCarley et al. [20] compared several infrared and visible light cameras and found that many infrared cameras were “virtually immune to headlight or streetlight backscatter” and therefore performed best in darkness, fog, or the combination of darkness and fog. However, without fog or with light fog, the visible light camera outperformed infrared cameras, and “there appears to be a limited number of situations for which non-visible spectrum imaging appears to be justified,” including dense fog or scenes with glare or shadows [20].
Thermal video has been used successfully for night-time pedestrian detection, an area of particular importance because pedestrians may be less visible to drivers at night and are therefore at a greater risk of collision [12]. Xu et al. [21] used a support vector machine (SVM) to detect and classify pedestrians using a thermal camera mounted to a moving vehicle. Although detection was successful in many cases, occlusion of pedestrians in heavy traffic was a significant limitation. Krotosky and Trivedi [22] analyzed multiple camera technologies. Recognizing that regular and thermal cameras provide “disparate, yet complementary information about a scene,” the authors recommend combining visible light and infrared technologies [22].
Despite this existing work, several shortcomings exist. Although several studies have addressed detecting vehicles
or pedestrians, there has been limited work on detecting and classifying multiple road user types (including bicycles) from thermal video in mixed-traffic environments such as urban intersections. No studies have attempted to identify the effect of pavement temperature on the quality of thermal video. Although thermal video sensors are promising, their perfor-mance must be comprehensively evaluated and the adapta-tion of existing computer vision software must be studied. Most studies do not appropriately report performance and cannot be reproduced since the software code and/or datasets are not available. Detection rate alone is too limited to represent performance. The whole confusion matrix should be presented and receiver operating characteristic (ROC) curves should be used to evaluate detectors or classifiers as parameters that are adjusted. Separate data sets for calibration and performance measurements should be required. When available, researchers should use standard metrics such as the Measure of Tracking Accuracy (MOT) [23]. This research aims to address these gaps and integrate thermal sensors into existing data collection and safety tools, in particular under conditions where regular video presents limitations.
3. Methodology
The methodology considers three steps: (i) technology inte-gration and data collection, (ii) implementation of detection and classification algorithms, and (iii) vehicle speed valida-tion. The three steps are detailed below.
3.1. Technology Integration and Data Collection. The two technologies involved in this study are thermal video sensors with a resolution of 368× 296 pixels and visible light cameras with a resolution of 1920× 1080 pixels. The thermal camera system consists of a thermal sensor, a signal converter, and a power supply unit. Thermal video data is stored on a simple chip microcomputer (SCM). The thermal sensor, the ThermiCam by FLIR, is connected to an X-stream edge card that reads the thermal signal and converts and outputs the signal to a video file. The video file from the X-stream edge card is transferred to the SCM using an Ethernet connection where it is saved using the VLC software [24]. The camera and X-stream edge card are powered using a battery with an output of 12–24 V. The SCM, the battery, and the X-stream edge card are placed in a small enclosure which can be easily installed for data collection. Figure 1 presents the components of the thermal camera system and a sample frame from the thermal camera recorded at night in Figure 1(d).
Three primary sources of data are required: thermal video data, visible spectrum video data, and environmental and pavement temperature data. The regular visible spectrum camera and thermal camera systems are installed simulta-neously using a telescoping-fibreglass mast to ensure nearly identical fields of view. The regular camera system, intro-duced previously [25], uses an inexpensive and commercially available video camera which stores video and is powered internally.
Since the road pavement is the primary background in the video scenes, pavement temperature is regarded as the main temperature variable affecting thermal video performance.
Pavement temperature data were collected using the FLIR ONE thermal camera [16], which attaches to an iPhone to capture thermal video and temperatures using the FLIR ONE iPhone application. The camera was held close to the road surface to get an accurate temperature as suggested in the user manual [26]. Based on field-testing, the temperature meas-ured by the FLIR ONE camera was within 2∘C of the actual pavement temperature. Figure 2 shows the camera system, its user interface, and field measurement of the pavement temperature data.
3.2. Implementation of Detection and Classification Algo-rithms. As thermal videos detect thermal energy, they are expected to solve the issues associated with visible light cameras under different lighting conditions. Though existing detection and classification algorithms are used for auto-mated data collection, they must be retrained and evaluated under different lighting and temperature conditions. Addi-tional details of the methods for detection, tracking, and classification are presented in the next subsections.
3.2.1. Detection and Tracking Algorithm. The videos were processed using the tracker available in Traffic Intelligence, an open-source computer vision software project [27]. Individ-ual pixels are first detected and tracked from frame to frame and recorded as feature trajectories using the Kanade-Lucas-Tomasi feature tracking algorithm [28]. Feature trajectories are then grouped based on consistent common motion to identify unique road users. The techniques used in the tracker are further explained by Shi and Tomasi [28] and Saunier and Sayed [27]. Algorithm parameters were calibrated through trial and error, in order to minimize both false alarms and misses. False alarms and misses, respectively, result mostly from oversegmentation (one user being tracked as multiple users) and overgrouping (multiple users being tracked as one user).
3.2.2. Classification Algorithm. Road user classification was performed using the method developed by Zangenehpour et al. [7]. Classifier V classifies detected road users as vehi-cles, pedestrians, or cyclists based on the combination of appearance, aggregate speed, speed frequency distribution, and location in the scene. An SVM is used to learn the appearance of each road user type as described by the well-known Histogram Oriented Gradients (HOG). The SVM was trained based on a database containing 1500 regular images of each road user type. The overall accuracy of this classification method at intersections with high volumes and mixed road user traffic is approximately 93%, an improvement over simpler algorithms using only one or two classification cues [7]. The classifiers are available in Traffic Intelligence [13]. For more details regarding the original classification method, readers are referred to [7].
3.2.3. Algorithm Retraining. Considering that the classifier uses the appearance of the road user as a parameter, and the fact that road users in thermal videos appear quite differently than they do in visible light videos, the SVM classifier for appearance classification, as part of the Classifier V [7] that
TI X-stream ThermiCam, FLIR SCM with screen Ethernet TCP/IP Battery: output,12∼36 V
(a) System components (b) System enclosure (c) Installation
(d) Sample video frame
Figure 1: Thermal camera system (note that, in the field, the battery, SCM, and the TI X-stream are enclosed in a small waterproof case).
(a) FLIR ONE camera [16] (b) App user interface (c) Field measurement
Figure 2: Pavement temperature measuring sensor—FLIR ONE thermal camera.
is used in this study, needs to be retrained on a dataset of thermal images for all road user types. Although the shape and proportions of the road users should be roughly equi-valent, it is unclear how their appearance described by HOG varies between the visible and thermal images. Furthermore, the reduced resolution of the thermal video may impact the classification performance as less information and fewer details are available. The accuracy of the classification algo-rithm must therefore be explored further.
The retraining work mainly consists of three steps: (1) extracting the square subimages of all moving objects as tracked by the algorithm in the sample videos;(2) manually labeling images of the different road user types and preparing the database for training; (3) using the database to train
the SVM classifier. The steps of the retraining work for the SVM classifier are presented in Figure 3. For retraining purpose, this study used a database containing 1500 thermal images from several videos (separate from the ones used for performance evaluation) for each type of road user to train the SVM. Figure 4 shows the samples of the images of the road users in the database which covers different lighting and temperature conditions. Results using Classifier V with the SVM trained, respectively, on the regular and the thermal datasets are compared in the experimental results.
3.2.4. Detection and Classification Performance Metrics. The detection and classification performance are measured using different metrics and by extracting video data from frames
Manual classification and dataset preparation Subimages of all moving objects HOG feature descriptors Train the SVM model
Input: video and
trajectory data
Output: SVM
model trained on thermal images
Figure 3: Steps involved in retraining the classifier [7].
every 10 seconds. This corresponds to 150 frames considering a frame rate of 15 frames per second (fps). Data (detection, user class, and speed) is then extracted by observing the results of the tracking and classification algorithms and compared visually with the ground truth. The interval of 10 s was chosen to be large enough in order to avoid evaluating the same road user twice. Most road users are tracked for less than 10 s continuously as the tracking algorithm tracks only moving road users (if stopped, a road user is not tracked anymore: tracking resumes when the road user starts moving again): trajectories are typically less than 5 s long for vehicles and less than 10 s for pedestrians and cyclists. Also, 10 s is short enough to provide enough observations to evaluate the detection and classification performance. For the extracted frames, detection and classification errors are counted as shown in Figure 5.
Different metrics are computed to evaluate the perfor-mance of thermal versus regular video. For the classification problem, the confusion matrix is used to investigate the technology performance and derive metrics. In the general case with𝑁 classes, the confusion matrix is an 𝑁 × 𝑁 matrix that contains in each cell𝑐𝑖𝑗, the number of objects of true class𝑖 predicted as class 𝑗. The detection and tracking step can be also evaluated as a binary classification problem (a matrix with𝑁 = 2 classes, missed and detected), where the class of objects to be detected is the positive class. The matrix in this binary case is presented in Table 1 with the particular names taken by the instances depending on their true and predicted class. Misses are the false negatives and false alarms are the false positives.
The most common metric is the global accuracy defined as the proportion of correct predictions and is computed as
Accuracy= ∑ 𝑐𝑘𝑘
∑𝑖∑𝑗𝑐𝑖𝑗. (1)
The majority of existing studies have used global accuracy to measure classification performance, for both road user detection and classification methods. This is however insuf-ficient to properly report the performance, both for two-class two-classification, that is, detection (since false alarms are not accounted for by a single detection rate), and for classi-fication with three and more classes such as in multimodal environments, for example, with pedestrians, cyclists, and vehicles. As used widely in the field of machine learning, this study relied on the confusion matrix to derive the following disaggregate metrics per class:
Precision𝑘= 𝑐𝑘𝑘 ∑𝑖𝑐𝑖𝑘.
Recall𝑘= 𝑐𝑘𝑘 ∑𝑗𝑐𝑘𝑗.
(2) In the case of a binary classification problem, precision and recall are typically reported only for the positive class and can be written in terms of true/false positives/negatives as follows:
Precision= TP TP+ FP = 𝑐11 𝑐11+ 𝑐21 Recall= TP TP+ FN = 𝑐11 𝑐11+ 𝑐12 (3)
from which the miss rate can be derived as miss rate = 1 − Recall= FN/(TP + FN).
The above metrics are computed by populating the confusion matrix through the visual assessment of each frame extracted every 10 s or 150 frames as shown in Figure 5. Since pedestrians often move in groups, and detecting and tracking individual pedestrians within groups is difficult (and actually an open problem in all conditions in computer vision), the unit of analysis is individual pedestrians or groups of pedestrians. In Figure 5, the groups of pedestrians labeled c (overgrouping) are then considered correctly detected. Miss rate is the main metric reported for detection performance used for all test cases in the experimental results, while precision and recall at the individual level, overall and per known (true) type of road user, are also reported for two test cases for a more complete assessment.
The road user classification problem has three classes: pedestrians, cyclists, and vehicles. Precision and recall are reported for each class, as well as global accuracy, from the confusion matrix accumulated over all extracted frames. 3.3. Vehicle Speed Validation. Once road users have been detected and classified, parameters such as vehicle speed are of interest for traffic studies. Many existing studies have used mean relative error (MRE) to quantify the error of video speeds extracted automatically from video. However, a previous study by Anderson-Trocme et al. [29] showed that it “is insufficient at capturing the true behaviour of detectors and other measures are necessary to define device precision and accuracy separately,” where accuracy is the systematic error or bias and precision is the residual error. However, because video-based sensors tend to overestimate speed, and because this overestimation is roughly constant with respect to speed, simple methods for calculating relative precision error and relative accuracy error were developed.
The vehicle speed validation process begins by plotting automatically extracted speeds against manually measured speeds (speeds calculated based on known distances and video frame rate) in order to observe trends across visibility and temperature conditions. The line 𝑦 = 𝑥 represents ideal detector performance, and data points above the line indicate overestimation of speed, while points below the line indicate underestimation. As the overestimation bias is typically constant, a line with slope equal to one is fitted to the data. The𝑦-intercept and 𝑅-squared values of this fitted line represent accuracy and precision, respectively. However,
(a) Sample of vehicles (b) Sample of cyclists (c) Sample of pedestrians
Figure 4: Sample of extracted road user images used for retraining.
Frame t
Frame t + 150
Extracted frame and errors
(a) (b) (c) (c) (d) (a) (c) (d) Classification error (b) Oversegmentation (a) Miss (c) Overgrouping Description Error type 1 cyclist, 1 pedestrian
3 pedestrian groups, IDs: 360, 364, and 368 1 pedestrian classified as cyclist, ID 359
1 vehicle with 2 trajectories Time (f rames) Extracti on interval (10 sec s= 150 fr ames)
Figure 5: Video sampling and data extraction for detection and classification performance.
converting these results to relative error values “matches the approach utilized in existing literature, and provides an intuitive and communicable comparison” between multiple environments [29]. Relative precision error (RPE) is quanti-fied similarly to mean relative error, with the subtraction of a correction factor equal to the𝑦-intercept of the fitted line. To normalize the intercept value consistently with the relative mean error, the𝑦-intercept is evaluated at every data point (divided by the harmonic mean of observed speed) for the relative accuracy error (RAE). The RAE represents the over-or underestimation bias present in the video data. The RPE can be seen as the best possible performance that could be expected from calibrated video data [29]. Values for relative error, relative precision, and accuracy error are calculated as
Mean Relative Error (MRE) = 1 100∑𝑉𝑒
− 𝑉𝑜 𝑉𝑜 Relative Precision Error (RPE)
= 1
100∑(𝑉𝑒
− 𝑦 intercept) − 𝑉𝑜 𝑉𝑜
Relative Accuracy Error (RAE)
= 1
100∑𝑦 intercept𝑉𝑜 ,
(4) where𝑉𝑒 and 𝑉𝑜 stand for the automatically extracted and manually measured speeds, respectively.
4. Data Description
To evaluate the performance of the thermal and regular cam-eras, 14 test cases (camera installations), with approximately one to four hours of video data for each case, were used. The lighting test cases, presented in Table 2, include videos during the day and at night. Daytime test cases focussed
Table 1: Corresponding table of confusion and basic terms from confusion matrix. Predicted class
Positive Negative
True class Positive True positives (TP) False negatives (FN) Recall= TP TP+ FN Negative False positives (FP) True negatives (TN)
Precision= TP TP+ FP
Table 2: Summary of lighting test cases.
(a)
Lighting condition
Vehicle speed Classification
Sample Size Season Road type Video
length Season Road type Daytime Overcast 100 vehicles Winter Segment Every 10 s for 30 minutes Summer Intersection
Sun, little shadow Spring Summer Intersection
Sun, slight shadows Spring N/A N/A
Sun, strong shadows Summer Summer Intersection
Nighttime High visibility 100 vehicles Spring Segment Every 10 s for 30 minutes Winter Intersection
Medium visibility Intersection
Low visibility Intersection
(b) Sample camera views under different lighting conditions
Daytime
conditions Thermal camera Regular camera
Nighttime
conditions Thermal camera Regular camera
Overcast High visibility Sun, little shadow Medium visibility Sun, strong
shadows Low visibility
on various sun exposures and shadow conditions, while nighttime test cases focussed on the level of visibility, with one case in near complete darkness, one nearly completely illuminated, and one in between. Speed performance was evaluated on a sample size of 100 vehicles for each test case, while classification and detection performance was evaluated on 30 minutes of sample videos.
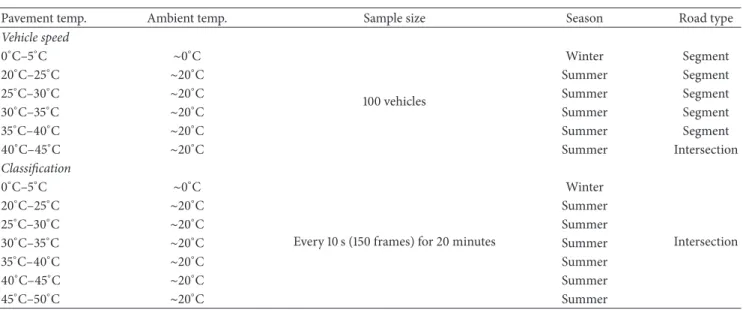
A similar approach was adopted for the temperature test cases, shown in Table 3. To evaluate detection and classifi-cation performance under different temperature conditions, thermal video data were collected from the same site with the same camera angle throughout a sunny summer day when the pavement temperature rose from 20∘C in the morning to 50∘C in the afternoon. Data collected from the same site in
Table 3: Summary of temperature test cases.
(a)
Pavement temp. Ambient temp. Sample size Season Road type
Vehicle speed 0∘C–5∘C ∼0∘C 100 vehicles Winter Segment 20∘C–25∘C ∼20∘C Summer Segment 25∘C–30∘C ∼20∘C Summer Segment 30∘C–35∘C ∼20∘C Summer Segment 35∘C–40∘C ∼20∘C Summer Segment 40∘C–45∘C ∼20∘C Summer Intersection Classification 0∘C–5∘C ∼0∘C
Every 10 s (150 frames) for 20 minutes
Winter Intersection 20∘C–25∘C ∼20∘C Summer 25∘C–30∘C ∼20∘C Summer 30∘C–35∘C ∼20∘C Summer 35∘C–40∘C ∼20∘C Summer 40∘C–45∘C ∼20∘C Summer 45∘C–50∘C ∼20∘C Summer
(b) Sample camera views under different temperature
Pavement temp. Camera view Pavement temp. Camera view
0∘C–5∘C 35∘C–40∘C
20∘C–25∘C 40∘C–45∘C
25∘C–30∘C 45∘C–50∘C
30∘C–35∘C
winter when the pavement temperature was close to 0∘C was included. As with the lighting test cases, speed performance was evaluated on a 100-vehicle sample, and classification and detection performance was evaluated on 20-minute video samples. In Table 3, the thermal images change drastically from cold to hot pavement temperature. Road users are light on a dark background when the pavement temperature is low and dark on a light background when pavement temperature is high.
5. Results
5.1. Detection and Classification
5.1.1. Lighting. Results of detection and classification for the thermal and regular video are presented in Table 4 for the lighting test cases. The thermal camera reported a miss rate of 5% or less for all road user types in nearly all test cases. While the vehicle miss rate of the regular camera was also
T able 4 :D et ec ti o n an d classifica tio n p er fo rm an ce fo r diff er en t lig h tin g co n di ti o n s—t her m al an d regula r video . L ig h ti n g co ndi tio n Ther m al video R egula r video Nu m b er o f ro ad us er s p res en t Nu m b er o f m is se d in st an ces/miss ra te C lassifica tio n p recisio n C lassifica tio n re ca ll Ro ad us er p res en t Nu m b er o f miss ed in st an ces/miss rate C lassifica tio n p recisio n C lassifica tio n re ca ll V eh ic le d et ec tio n an d clas si fica tio n D ayt ime Ov er ca st 121 0/0.0% 53.3% 97 .0% 19 2 0/0.0% 78.9% 9 9.3% Sun, li tt le shado w 52 2/3.8% 4 6.3% 10 0.0% 74 0/0.0% 67 .9% 10 0.0% Sun, st ro n g shado w s 77 0/0.0% 4 4.2% 10 0.0% 83 3/3.6% 55.0% 10 0.0% N ig h tt ime Hi gh vi si bi li ty 10 2 1/1.0% 6 6.7% 9 1.2% 10 2 4 /3.9% 74 .5% 9 7.6% M edi um visib ili ty 24 9 4/1.6% 9 9.0% 9 6.2% 241 11/4.6% 97 .2% 9 9.5% Lo w vi si b il it y 4 2 1/2.4% 56.3% 9 6.4% 4 2 2/4.8% 9 1.4% 10 0.0% C yc li st d et ec tio n an d clas si fica tio n D ayt ime Ov er ca st 26 1/3.8% 36.1% 81.3% 38 1/2.6% 30.9% 9 6.7% Sun, li tt le shado w 4 6 1/2.2% 95.8% 54.8% 57 4/7 .0% 87 .8% 78.3% Sun, st ro n g shado w s 6 8 4/5.9% 9 0.3% 50.0% 67 11/16.4% 6 3.0% 6 8.0% N ig h tt ime Hi gh vi si bi li ty 4 4 1/2.3% 70.2% 93.0% 4 4 36/8 1.8% 4 2.9% 37 .5% M edi um visib ili ty 12 0/0.0% 6 4.7% 10 0.0% 12 12/10 0.0% 0.0% In valid Lo w vi si b il it y 10 0/0.0% 6 9.2% 9 0.0% 10 10/10 0.0% In valid In valid P edes tr ia n det ec tio n and cl as si fica tio n D ayt ime Ov er ca st 31 4 9/2.9% 98.3% 6 8.5% 35 6 14/3.9% 9 9.1% 6 8.3% Sun, li tt le shado w 78 2/2.6% 82.1% 56.1% 6 3 0/0.0% 93.8% 6 6.2% Sun, st ro n g shado w s 118 9/7 .6% 10 0.0% 4 6.8% 13 0 19/1 4.6% 86.6% 59 .2% N ig h tt ime Hi gh vi si bi li ty 14 9 5/3.4% 97 .8% 6 8.9% 14 9 10 9/7 3.1% 9 0.0% 25.7% M edi um visib ili ty 85 3/3.5% 94.5% 9 4.5% 77 6 8/88.3% 10 0.0% 14.3% Lo w vi si b il it y 28 6 4/1.4% 9 9.5% 89 .5% 28 6 27 8/97 .2% In valid 0.0% T ot ald et ec ti on an dc la ss ifi ca ti on Ac cu ra cy Ac cu ra cy D ayt ime Ov er ca st 4 6 1 10/2.2% 74.9% 586 15/2.6% 79 .1% Sun, li tt le shado w 17 6 5/1.8% 6 6.2% 194 4/2.1% 80.2% Sun, st ro n g shado w s 26 3 13/4.9% 6 2.8% 28 0 33/11.8% 6 9.1% N ig h tt ime Hi gh vi si bi li ty 295 7/2.4% 79 .4% 295 15 9 /5 0.5% 74.0% M edi um visib ili ty 34 6 7/2.0% 9 6.1% 33 0 9 1/2 7.6% 9 6.8% Lo w vi si b il it y 33 8 5/1.5% 9 0.3% 33 8 29 0/8 5.8% 9 1.4%
lower than 5% in all test cases, the rate increased significantly for pedestrians and cyclists in all nighttime test cases, where very few pedestrians and cyclists were detected with the regular camera (more than 75%). Vehicles were well detected by both technologies under all conditions, possibly because their lit headlights and larger size provide more features for tracking compared to pedestrians and cyclists. In conditions without interference of darkness or shadows (test cases of “overcast” and “sun, little shadow”), excellent performance was obtained for the regular videos. However, daytime cases with shadows showed a decrease in performance, as shadows inhibit the tracking and detection of pedestrians, cyclists, and some vehicles. The miss rates of pedestrians and cyclists both increased to around 15% and 10% points higher than those in the thermal videos.
For classification performance, the measures of recall and precision are also presented in Table 4. Higher values of recall and precision in classifying vehicles using reg-ular videos indicate that, in general, the performance of classifying vehicles was improved when using the regular camera over the thermal camera. However, from medium to low visibility conditions, regular cameras perform poorly in the classification of cyclists and pedestrians. For cases with medium and low visibility specifically, the algorithm failed to recognize pedestrians and cyclists in regular videos. In such cases, since classification is performed only for tracked road users, computing the precision may not be possible when no road user of the class was detected or representative if too few were detected. Thermal videos perform reliably in nighttime cases, even when using the classification algorithm trained on the regular, or visible spectrum, images of road users. In daytime conditions, the classification of pedestrians and cyclists is only slightly better by regular camera, as the global accuracy values are slightly higher in regular videos than those in thermal videos in most cases. The classification performance per class indicates the need for improving the classification algorithm for thermal videos by training the algorithm on images from thermal cameras. Nevertheless, even with the algorithm trained only on regular video data, the thermal camera correctly classifies road users more often in low visibility conditions, especially at night-time.
A more complete detection performance evaluation, in particular for individual pedestrians, is reported for two extreme test cases: (i) the sunny daytime case without the interference of shadow, which has the best lighting envi-ronment, presented in Figure 6, and (ii) the worst lighting condition case shown in Figure 7, which is nighttime condi-tion with low visibility. From the results, the thermal camera and the regular camera perform similarly well in detecting different road users in the good lighting environment. For low visibility condition at night, the two camera systems have similar capability in detecting vehicles; however, the regular camera failed to detect the cyclists and pedestrians under such a low visibility condition (low recall) where the thermal camera can still work efficiently—this is in accordance with the previous analysis. With similar performance for good lighting conditions and much better performance for low vis-ibility conditions, compared to the visible spectrum camera
66.3%
98.5% 94.2% 86.8%
65.2%
94.4% 97.8% 81.5%
Vehicle Cyclist Pedestrian Overall Thermal camera Regular camera 0 25 50 75 100 (%) (a) Precision Thermal camera Regular camera 93.0% 82.3% 79.0% 82.8% 95.6% 91.1% 81.3% 88.5%
Vehicle Cyclist Pedestrian Overall 0 25 50 75 100 (%) (b) Recall
Figure 6: Detection performance results—test case: daytime, sun, little shadow. 57.7% 100.0% 99.7% 91.6% 64.5% Invalid 88.9% 67.6%
Vehicle Cyclist Pedestrian Overall Thermal camera Regular camera 0 25 50 75 100 (%) (a) Precision 97.6% 100.0% 75.1% 77.8% 95.2% 0.0% 2.1% 11.1%
Vehicle Cyclist Pedestrian Overall Thermal camera Regular camera (%) 0 25 50 75 100 (b) Recall
Figure 7: Detection performance results—test case: nighttime, low visibility.
system, thermal cameras can be used for all weather and lighting conditions.
5.1.2. Temperature. The classifier trained on the thermal dataset was applied in the different temperature test cases where the outputs of the thermal videos changed greatly with the change of temperature. Table 5 presents the results of detection and classification performance for the classifier trained on the regular or thermal dataset for each test case. Again, the thermal video provided detection rates exceeding 95% for nearly all test cases, and temperature had little impact on detecting different road users. Even when the pavement temperature approaches that of the road users, miss rate
Table 5: Detection and classification performance for different pavement temperatures—thermal camera.
Pavement temp. Number ofroad users present Number of missed instances/miss rate Classifier trained on regular data Classifier trained on
thermal data Improvement (% points) Precision Recall Precision Recall Precision Recall
Vehicle detection and classification
0∘C–5∘C 42 1/2.4% 56.3% 96.4% 67.4% 96.7% 11.2% 0.2% 20∘C–25∘C 58 0/0.0% 89.1% 100.0% 96.1% 100.0% 7.0% 0.0% 25∘C–30∘C 37 2/5.4% 67.6% 100.0% 83.9% 100.0% 16.2% 0.0% 30∘C–35∘C 20 0/0.0% 27.9% 100.0% 68.4% 100.0% 40.5% 0.0% 35∘C–40∘C 45 1/2.2% 35.6% 100.0% 67.5% 100.0% 31.9% 0.0% 40∘C–45∘C 31 1/3.2% 23.6% 100.0% 65.4% 100.0% 41.7% 0.0% 45∘C–50∘C 19 0/0.0% 12.1% 100.0% 47.6% 100.0% 35.5% 0.0% Average 44.6% 99.5% 70.9% 99.5% 26.3 % 0.0%
Cyclist detection and classification
0∘C–5∘C 10 0/0.0% 69.2% 90.0% 64.3% 100.0% −4.9% 10.0% 20∘C–25∘C 33 0/0.0% 72.1% 96.9% 64.6% 96.9% −7.5% 0.0% 25∘C–30∘C 22 0/0.0% 70.0% 46.7% 70.8% 94.4% 0.8% 47.8% 30∘C–35∘C 36 0/0.0% 93.8% 51.7% 75.8% 86.2% −18.0% 34.5% 35∘C–40∘C 27 2/7.4% 88.9% 33.3% 67.9% 76.0% −21.0% 42.7% 40∘C–45∘C 40 0/0.0% 88.9% 22.9% 83.8% 86.1% −5.1% 63.3% 45∘C–50∘C 26 0/0.0% 100.0% 6.7% 85.0% 85.0% −15.0% 78.3% Average 83.3% 49.7% 73.2% 89.2% −10.1% 39.5%
Pedestrian detection and classification
0∘C–5∘C 286 4/1.4% 99.5% 89.5% 100.0% 92.0% 0.5% 2.5% 20∘C–25∘C 71 0/0.0% 100.0% 66.0% 100.0% 66.7% 0.0% 0.7% 25∘C–30∘C 39 0/0.0% 86.4% 67.9% 100.0% 66.7% 13.6% −1.2% 30∘C–35∘C 53 3/5.7% 75.0% 42.9% 97.0% 74.4% 22.0% 31.6% 35∘C–40∘C 51 2/3.9% 62.5% 12.5% 96.7% 63.0% 34.2% 50.5% 40∘C–45∘C 44 2/4.5% 50.0% 23.3% 96.3% 70.3% 46.3% 46.9% 45∘C–50∘C 44 2/4.5% 61.1% 33.3% 100.0% 71.1% 38.9% 37.7% Average 76.4% 47.9% 98.6% 72.0% 22.2% 24.1%
Total detection and classification
Accuracy Accuracy Accuracy
0∘C–5∘C 338 5/1.5% 90.3% 92.8% 2.6% 20∘C–25∘C 162 0/0.0% 86.3% 85.9% -0.3% 25∘C–30∘C 98 3/3.1% 74.2% 84.4% 10.2% 30∘C–35∘C 109 3/2.7% 54.2% 82.4% 28.1% 35∘C–40∘C 123 5/4.1% 43.3% 76.5% 33.2% 40∘C–45∘C 115 3/2.6% 35.9% 82.2% 46.3% 45∘C–50∘C 89 2/2.2% 30.8% 79.4% 48.6% Average 59.3% 83.4% 24.1%
remained low. Observing the videos, temperature variation within each road user likely explains this good performance: features are still detected for the areas of high and low temperature within road users.
Although miss rate was low, classification results were generally poor before retraining the algorithm, and clas-sification accuracy reduced systematically as temperature increased from 90.3% in the lowest temperature case to 30.8%
in the highest. This result indicates that, for the thermal video, the object appearance described by HOG [7] varies with pavement temperature, and therefore the SVM should be trained on thermal images to account for the different appearance of road users. The classification accuracy after the new training showed improvements, particularly at higher pavement temperatures. At 45–50∘C, overall classification accuracy improved by 48.6% points, from an accuracy of
30.8 to 79.4%. The excellent performance of detection and the higher classification accuracy rates for the algorithm trained on thermal data indicate the possibility of using this algorithm to correctly detect and classify different types of road users under different temperature conditions.
Looking at the per-class performance measures, better recall and precision were found in almost all temperature cases for vehicles and pedestrians when using the algorithm trained with thermal data (with an average increase of 26.3% points in precision for vehicles and an average increase of 24.1% points in recall and 22.2% points in precision for pedestrians). The recall for cyclists increases in all cases by 39.5% points on average; however, precision decreases in most of the cases by 10.1% points on average. This is explained by considering that, before training the algorithm on thermal data, a smaller portion of the detected cyclists is successfully classified which leads to a deceptively high precision. In other words, fewer cyclists were classified as such by the algorithm trained with regular videos, but the algorithm made few mistakes, and the other cyclists were classified as pedestrians or vehicles resulting in lower precision for these road user types. With the newly trained algorithm, more road users, including actual cyclists, are classified as cyclists, which increases cyclist recall; but in doing so, more vehicles and pedestrians are also misclassified as cyclists, causing a decrease in cyclist precision. A general issue for both types of cameras is confusing pedestrians and cyclists since they have similar appearances. Global accuracy improved by as much as 50% points in the multimodal environments. Moreover, the % point improvement was larger for high temperature cases, indicating that training the algorithm for data collection using thermal videos is both necessary and effective. 5.2. Vehicle Speed Validation. To compare the performance of the camera systems in vehicle speed extraction accuracy, a data visualization exercise was completed for all test cases. One example, shown in Figure 8, demonstrates the performance of the two camera systems under sun with strong shadows.
5.2.1. Speed and Lighting. Table 6 provides the equation of the fitted line, its 𝑅-squared value, MRE, RAE, and RPE for each lighting conditions test case. The first important observation was that the intercept value in nearly all test cases was positive for both technologies. This result is consistent with previous research and shows that video sensors tend to overestimate speeds [29]. The 𝑅-square values for thermal video are significantly higher for daytime with shadows as well as median and low visibility conditions. RPE is perhaps the most critical value in Table 6. The thermal camera had a lower RPE in all test cases other than overcast sky, in which the regular camera was expected to perform well without lighting interference. In the other test cases, the thermal video consistently provided 2-3% points improvement in RPE over the regular camera. Despite this good performance, the RAE was highly variable both across conditions and across cameras. This again supports previous research and indicates that the overestimation bias is less a function of camera or conditions as it is a function of user calibration error [29]. In
general, the RPE was within 5–10% of ground truth, which is consistent with previously measured performance of video sensors [29].
5.2.2. Speed and Temperature. Similarly for the temperature test cases, parameters of the fitted line and the segregated relative errors values are presented in Table 7. The RPE for all but one test case was 0.06 or less, and was not observed to vary greatly with temperature. For one test case (35– 40∘C), several outliers greatly increased the reported error. A slight increase in RPE was noted between 20 and 30∘C. These pavement temperatures most closely match the surface temperature of vehicles, and so a slight performance decrease may be explained by tracking issues associated with the low contrast with the pavement temperature. Despite the slight effect of temperature, the thermal videos performed reliably and consistently across all temperature test cases, with errors equal to what is expected from existing research. Thermal videos can be an effective substitute for regular videos with regard to speed data extraction under various lighting and temperature conditions.
6. Conclusions
This paper presents an approach to integrate and evaluate the performance of thermal and visible light videos for the auto-mated collection and traffic data extraction under various lighting and temperature conditions in urban intersections with high pedestrian and bicycle traffic. The two technologies were evaluated in terms of road user detection, classification, and vehicle speed estimation. Considering the above results, several key conclusions are drawn.
(1) The regular camera only narrowly outperformed the thermal camera in terms of detection and classifi-cation of all road users during daytime conditions. Also, the regular camera detects and classifies vehicles adequately under nighttime conditions. However, the performance of the regular camera deteriorates for pedestrians and cyclists in all nighttime test cases, while miss rate by the thermal camera remained around 5%, showing stability across the tested condi-tions.
(2) Based on the results at the individual level from the two test cases, the two cameras performed similarly in the favorable case, while, for the night, low visibility case, the advantage of using thermal camera was more significant compared to the results at the group level. (3) Training of the classifier to account for variation in the appearance of road users in the thermal video was observed to increase classification performance (recall, precision, and global accuracy) for the thermal camera, particularly at higher temperatures. Training the algorithm using more thermal videos is expected to improve the classification performance by thermal video also during the day, where the thermal camera was slightly inferior to regular video.
(4) Speed measurements by the thermal camera were consistently more accurate than measurements by
Thermal camera Regular camera R2= 0.8747 R2= 0.56 y = 1x − 2 y = 1x + 0.2 0 10 20 30 40 50 60 70 Extrac te d sp eed (km/h) 10 20 30 40 50 60 70 0 Ground truth (km/h) 10 20 30 40 50 60 70 0 Ground truth (km/h) 0 10 20 30 40 50 60 70 Ext rac te d sp ee d (km/h)
Figure 8: Example of vehicle speed estimation performance for thermal and regular cameras under sun with strong shadows.
Table 6: Vehicle speed performance for different lighting conditions—thermal and regular video.
Lighting condition Thermal video Regular video
Calibration model 𝑅2 Calibration model 𝑅2 Daytime
Overcast 𝑦 = 𝑥 − 1.97 0.91 𝑦 = 𝑥 − 0.04 0.95
Sun, little shadow 𝑦 = 𝑥 + 2.91 0.96 𝑦 = 𝑥 + 1.77 0.92
Sun, slight shadows 𝑦 = 𝑥 + 2.50 0.93 𝑦 = 𝑥 + 5.75 0.90
Sun, strong shadows 𝑦 = 𝑥 + 0.20 0.88 𝑦 = 𝑥 − 2.00 0.56
Nighttime
High visibility 𝑦 = 𝑥 + 4.49 0.93 𝑦 = 𝑥 + 0.01 0.92
Medium visibility 𝑦 = 𝑥 + 2.45 0.86 𝑦 = 𝑥 + 4.14 0.46
Low visibility 𝑦 = 𝑥 + 0.17 0.97 𝑦 = 𝑥 + 0.83 0.93
Lighting condition Thermal video Regular video
MRE RAE RPE MRE RAE RPE
Daytime
Overcast 0.067 0.058 0.067 0.059 0.001 0.059
Sun, little shadow 0.106 0.116 0.045 0.069 0.071 0.062
Sun, slight shadows 0.103 0.105 0.047 0.226 0.242 0.063
Sun, strong shadows 0.061 0.005 0.061 0.108 0.053 0.097
Nighttime
High visibility 0.150 0.151 0.047 0.051 0.000 0.051
Medium visibility 0.104 0.082 0.072 0.150 0.138 0.104
Low visibility 0.036 0.026 0.033 0.060 0.005 0.059
the regular video. Additionally, speed measurement accuracy was observed to be generally insensitive to lighting and temperature conditions.
Summarizing these points, regular video works well for “overcast” and “sun, little shadow” conditions without light-ing interference such as shadow, glare, low visibility, or reflec-tion. The thermal camera performs similarly in these condi-tions (although classification must be improved by training
the algorithm on thermal data). However, with shadows or at night, the performance of the regular camera was greatly reduced, and the thermal camera was superior in terms of detection, classification, and vehicle speed measurement. The thermal videos are insensitive to lighting interference and solve the issues associated with visible light cameras for traffic data collection, especially for active road users such as pedestrians and cyclists. The thermal camera is also
Table 7: Vehicle speed performance for different pavement temperature—thermal video.
Pavement
temp. Calibration model 𝑅
2 MRE RAE RPE
0∘C–5∘C 𝑦 = 𝑥 + 2.50 0.930 0.103 0.105 0.047 20∘C–25∘C 𝑦 = 𝑥 + 0.20 0.870 0.061 0.005 0.061 25∘C–30∘C 𝑦 = 𝑥 + 1.52 0.770 0.066 0.039 0.056 30∘C–35∘C 𝑦 = 𝑥 + 2.88 0.830 0.106 0.087 0.046 35∘C–40∘C 𝑦 = 𝑥 + 2.63 0.930 0.103 0.126 0.114 40∘C–45∘C 𝑦 = 𝑥 + 2.48 0.900 0.087 0.081 0.058
generally insensitive to the effects of pavement temperature. Thermal videos are more reliable and stable compared to regular videos in an around-the-clock collection campaign. Furthermore, greyscale thermal videos with lower resolution provide comparable results during the day, yet require less storage space and processing power, which are key concerns. Finally, thermal videos cause no privacy issues, which are a major hurdle for the application of video-based sensors, especially in the US and European countries.
As part of its contributions, this paper provides an approach for integrating existing tracking and classification algorithms for automated thermal video collection and analy-sis under varied lighting and weather conditions. The pro-posed approach can be used for automated counting, speed studies, and surrogate safety analyses in particular during low visibility conditions and in environments with high pedestrian and bicycle traffic activity.
Though general improvement of the classification perfor-mance was achieved by training the classifier on thermal data, the results (average 83.4% global accuracy over all cases, in Table 5) are lower than what has been reported previously for regular videos (93.3%) [7]. Reasons for this reduced perfor-mance must be considered in future work, including lower resolution of thermal videos and the need for more training image samples of road users under different temperature con-ditions. Validation of the classification algorithms on thermal videos will be better characterized using the ROC curve to compare different methods over several parameter settings. Although past literature shows visual improvements when using thermal cameras in foggy conditions, no work has been done to quantify the improvement of thermal videos during adverse weather conditions. The evaluation of thermal video in adverse weather conditions, such as heavy precipitation and fog, is a key focus of future work. Finally, a hybrid system that combines the advantages of both technologies can be designed to automatically calibrate and process video data from both thermal and visible spectrum sensors.
Competing Interests
The authors declare that they have no competing interests.
Acknowledgments
Funding for this project was provided in part by the McGill Engineering Doctoral Award and the Natural Sciences and
Engineering Research Council. The authors wish to thank Asad Lesani for his assistance in developing the thermal camera system.
References
[1] K. Robert, “Night-time traffic surveillance: a robust frame-work for multi-vehicle detection, classification and tracking,” in Proceedings of the 6th IEEE International Conference on
Advanced Video and Signal Based Surveillance (AVSS ’09), pp.
1–6, Washington, DC, USA, September 2009.
[2] S. J. Bahler, J. M. Kranig, and E. D. Minge, “Field test of nonin-trusive traffic detection technologies,” Transportation Research
Record, vol. 1643, pp. 161–170, 1998.
[3] B. Coifman, “Freeway detector assessment: aggregate data from remote traffic microwave sensor,” Transportation Research
Record, vol. 1917, pp. 150–163, 2005.
[4] S. Zangenehpour, J. Strauss, L. F. Miranda-Moreno, and N. Saunier, “Are signalized intersections with cycle tracks safer? A case—control study based on automated surrogate safety analysis using video data,” Accident Analysis and Prevention, vol. 86, pp. 161–172, 2016.
[5] A. Yoneyama, C.-H. Yeh, and C.-C. J. Kuo, “Robust vehicle and traffic information extraction for highway surveillance,”
EURASIP Journal on Advances in Signal Processing, vol. 2005,
Article ID 912501, pp. 2305–2321, 2005.
[6] Y. Cho and J. Rice, “Estimating velecoty fields on a freeway from low-resolution videos,” IEEE Transactions of Intelligent
Transportation Systems, vol. 7, no. 4, pp. 463–469, 2006.
[7] S. Zangenehpour, L. F. Miranda-Moreno, and N. Saunier, “Auto-mated classification based on video data at intersections with heavy pedestrian and bicycle traffic: methodology and appli-cation,” Transportation Research Part C: Emerging Technologies, vol. 56, pp. 161–176, 2015.
[8] Y. Iwasaki, S. Kawata, and T. Nakamiya, “Vehicle detection even in poor visibility conditions using infrared thermal images and its application to road traffic flow monitoring,” in Emerging
Trends in Computing, Informatics, Systems Sciences, and Engi-neering, T. Sobh and K. Elleithy, Eds., pp. 997–1009, Springer
Science+Business Media, New York, NY, USA, 2013.
[9] T. Fu, S. Zangenehpour, P. St-Aubin, L. Fu, and L. F. Miranda-Moreno, “Using microscopic video data measures for driver behavior analysis during adverse winter weather: opportunities and challenges,” Journal of Modern Transportation, vol. 23, no. 2, pp. 81–92, 2015.
[10] A. Sangnoree and K. Chamnongthai, “Robust method for ana-lyzing the various speeds of multitudinous vehicles in nighttime traffic based on thermal images,” in Proceedings of the 4th
Inter-national Conference on Computer Sciences and Convergence Information Technology (ICCIT ’09), pp. 467–472, Seoul, South
Korea, November 2009.
[11] T. H. Thi, K. Robert, S. Lu, and J. Zhang, “Vehicle classification at nighttime using eigenspaces and support vector machine,”
Congress on Image and Signal Processing, vol. 2, pp. 422–426,
2008.
[12] H. Huang, C. Zegeer, and R. Nassi, “Effects of innovative pedestrian signs at unsignalized locations: three treatments,”
Transportation Research Record, vol. 1705, pp. 43–52, 2000.
[13] N. Saunier, “Traffic Intelligence,” https://bitbucket.org/Nicolas/ trafficintelligence/.
[14] T. Fu, J. Stipancic, S. Zangenehpour, L. Miranda-Moreno, and N. Saunier, “Comparison of regular and thermal cameras for
traffic data collection under varying lighting and temperature conditions,” in Proceedings of the Transportation Research Board
Annual Meeting Compendium of Papers, Washington, DC, USA,
2016.
[15] T. Fu, J. Stipancic, S. Zangenehpour, L. Miranda-Moreno, and N. Saunier, “Automatic traffic data collection under varying lighting and temperature conditions in multimodal environ-ments: thermal vs visible spectrum video-based systems,” in
Proceedings of the 26th Canadian Association of Road Safety Professionals (CARSP ’16) Conference, Halifax, Nova Scotia,
Canada, 2016.
[16] FLIR Systems Inc, FLIR ONE is Lightweight, Easy to Connect
and Easy to Use, FLIR Systems Inc, Wilsonville, Ore, USA, 2015,
http://www.flir.com/flirone/content/?id=62910.
[17] B. Coifman, D. Beymer, P. McLauchlan, and J. Malik, “A real-time computer vision system for vehicle tracking and traffic surveillance,” Transportation Research Part C: Emerging
Technologies, vol. 6, no. 4, pp. 271–288, 1998.
[18] K. Balsys, A. Valinevicius, and D. Eidukas, “Urban traffic control using IR video detection technology,” Electronics and Electrical
Engineering, no. 8, pp. 43–46, 2009.
[19] Y. Iwasaki, “A method of robust moving vehicle detection for bad weather using an infrared thermography camera,” in
Proceedings of the International Conference on Wavelet Analysis and Pattern Recognition (ICWAPR ’08), pp. 86–90, IEEE, Hong
Kong, August 2008.
[20] C. A. MacCarley, B. M. Hemme, and L. Klein, “Evaluation of infrared and millimeter-wave imaging technologies applied to traffic management,” Society of Automotive Engineers 2000-01-1303, 2000.
[21] F. Xu, X. Liu, and K. Fujimura, “Pedestrian detection and track-ing with night vision,” IEEE Transactions on Intelligent
Trans-portation Systems, vol. 6, no. 1, pp. 63–71, 2005.
[22] S. J. Krotosky and M. M. Trivedi, “On color-, infrared-, and multimodal-stereo approaches to pedestrian detection,” IEEE
Transactions on Intelligent Transportation Systems, vol. 8, no. 4,
pp. 619–629, 2007.
[23] K. Bernardin and R. Stiefelhagen, “Evaluating multiple object tracking performance: the CLEAR MOT metrics,” EURASIP
Journal on Image and Video Processing, vol. 2008, Article ID
246309, 10 pages, 2008.
[24] VideoLAN Organization, “VideoLAN,” http://www.videolan .org/vlc/index.html.
[25] S. Zangenehpour, L. F. Miranda-Moreno, and N. Saunier, “Video-based automatic counting for short-term bicycle data collection in a variety of environments,” in Proceedings of the
Transportation Research Board 94th Annual Meeting,
Washing-ton, DC, USA, 2015.
[26] FLIR Systems, “FLIR ONE User Manual,” 2014, http://www.flir .com/flirone/press/FLIR-ONE-User-Manual.pdf.
[27] N. Saunier and T. Sayed, “A feature-based tracking algorithm for vehicles in intersections,” in Proceedings of the 3rd Canadian
Conference on Computer and Robot Vision (CRV ’06), p. 59,
IEEE, Quebec, Canada, June 2006.
[28] J. Shi and C. Tomasi, “Good features to track,” in Proceedings of
the IEEE Conference on Computer Vision and Pattern Recogni-tion (CVPR ’94), pp. 593–600, Seattle, Wash, USA, June 1994.
[29] P. Anderson-Trocme, J. Stipancic, L. Miranda-Moreno, and N. Saunier, “Performance evaluation and error segregation of video-collected traffic speed data,” in Proceedings of the
Trans-portation Research Board Annual Meeting, Washington, DC,
Internatfional Journal of
A
e
ro
spa
c
e
Eng
fin
e
e
r
fing
H findawfi Publfishfing Corporatfion
http://www.hfindawfi.com Volume 2014
Robo
Journal ot
fics
fH findawfi Publfishfing Corporatfion
http://www.hfindawfi.com Volume 2014
H findawfi Publfishfing Corporatfion
http://www.hfindawfi.com Volume 2014
Actfive and Passfive Electronfic Components
Control Scfience and Engfineerfing
Journal of
H findawfi Publfishfing Corporatfion
http://www.hfindawfi.com Volume 2014
Machfinery
H findawfi Publfishfing Corporatfion
http://www.hfindawfi.com Volume 2014 H
findawfi Publfishfing Corporatfion http://www.hfindawfi.com
Journal of
En
g
fin
e
er
fin
g
Volume 2014
Subm
fi
t
your
manuscr
fip
ts
a
t
h
t
tps
:
/
/www
.h
findaw
fi
.com
VLSI Desfign
Hfindawfi Publfishfing Corporatfion
http://www.hfindawfi.com Volume 2014
H findawfi Publfishfing Corporatfion
http://www.hfindawfi.com Volume 2014
Shock and Vfibratfion
H findawfi Publfishfing Corporatfion
http://www.hfindawfi.com Volume 2014
C
Advancesfiv
fi
l
Eng
finfinee
r
fing
AcousAdvancestficsfin and Vfibratfion
H findawfi Publfishfing Corporatfion
http://www.hfindawfi.com Volume 2014 H
findawfi Publfishfing Corporatfion
http://www.hfindawfi.com Volume 2014
Electrfical and Computer Engfineerfing
Journal of
Advancesfin OptoElectronfics
Hfindawfi Publfishfing Corporatfion
http://www.hfindawfi.com Volume 2014
The
Sc
fient
fific
Wor
ld
Journa
l
H findawfi Publfishfing Corporatfion
http://www.hfindawfi.com Volume 2014
Senso
JouHfindawfi Publrnafishfing Corporatl ofionfrs
http://www.hfindawfi.com Volume 2014
Modellfing & Sfimulatfion fin Engfineerfing
Hfindawfi Publfishfing Corporatfion
http://www.hfindawfi.com Volume 2014
H findawfi Publfishfing Corporatfion
http://www.hfindawfi.com Volume 2014
Chemfical Engfineerfing
InternatfionalJournal of Antennas and
Propagatfion
InternatfionalJournal of
H findawfi Publfishfing Corporatfion
http://www.hfindawfi.com Volume 2014 H findawfi Publfishfing Corporatfion
http://www.hfindawfi.com Volume 2014
Navfigatfion and Observatfion
InternatfionalJournal of
H findawfi Publfishfing Corporatfion
http://www.hfindawfi.com Volume 2014