Evolution of microstructure and elevated-temperature properties with Mn addition in Al-Mn-Mg alloys
K. Liu*, X.–G. Chen
University of Quebec at Chicoutimi, Saguenay, QC, Canada, G7H 2B1
*Corresponding author: kun.liu @uqac.ca; Tel.: 1-4185455011 ext.7112; Fax: 1-4185455012
Abstract
In the present work, various Mn amounts (up to 2 wt. %) have been added into Al-Mn-Mg 3004 alloy to study their effect on the evolution of microstructure and elevated-temperature properties. Results showed that the dominant intermetallics are interdendritical Al6(MnFe) until to 1.5 wt. % Mn. With further addition of Mn to 2 wt. %,
the blocky primary Al6Mn/Al6(MnFe) and high volume of fine Al6(MnFe) intermetallics
form in the matrix, leading to the rapid increase on the volume fraction of intermetallics. After the precipitation heat treatment (375°C/48h), the precipitation of dispersoids increased with increasing Mn contents and reached the peak condition in the alloy with 1.5 wt. % Mn, resulting in the highest yield strength and creep resistance at 300°C. However, the elevated-temperature properties became worse in the alloy with 2 wt. % Mn due to the lowest volume fraction of dispersoids and highest volume of dispersoid free zone.
Keywords : Al-Mn-Mg 3004 alloy; Dispersoids; Mn contents; Elevated-temperature properties.
1. Introduction
Dispersoid-strengthening mechanism is reported to be one of the most promising hardening mechanisms at elevated temperatures in aluminum alloys, especially in non-heat-treatable Al-Mn-Mg 3xxx alloys [1-4]. It is reported that the yield strength (YS) at 300°C can reach to 78MPa via the dispersoid strengthening in Al-Mn-Mg 3004 alloys under a proper heat treatment (375°C/48h) and even get higher with the modification of alloying elements, such as Fe, Si and Mo [3, 5-7]. Another significant advantage of dispersoid-strengthening mechanism is the excellent thermal stability of dispersoids at elevated temperatures, leading to the stable elevated-temperature properties, which is much higher than that of traditional precipitation-strengthening aluminum alloys, such as 2xxx, 6xxx and 7xxx [8]. For instance, after long-term thermal holding (300°C/1000h), the YS at 300°C of 3004 alloy after the peak precipitation treatment can keep stable at 77-78 MPa while it is sharply reduced to 55 MPa from 95 MPa at the peak-aging condition in 7075-T6 alloys due to the rapid coarsening of precipitates [8]. Therefore, it is a great opportunity for developing and optimizing dispersoid-strengthening 3xxx alloys to meet the rapidly increasing demand for aluminum alloys that are applicable at elevated temperatures in weight-sensitive automobile and aerospace industries.
Mn is one of the principal alloying elements in Al-Mn-Mg 3004 alloys and some of them are dissolved into the Al matrix to form the supersaturated solid solution during solidification, providing the concentration gradient for the precipitation of dispersoids during heat treatment [2], which is one of the most significant factors influencing the elevated-temperature properties. However, limited research is performed to study the influence of Mn on the formation of dispersoids, especially at elevated temperature. It is
reported the dispersoids can form in 3xxx alloys with increasing Mn (up to 0.9 %) and Si contents (up to 0.5 %), leading to the increase of YS at room-temperature (RT) [5] (All of the alloy compositions are shown in wt. % in the present work unless indicated otherwise). In addition, the crystal structure of dispersoids also relate to the Mn/Fe ratio, in which the simple cubic dispersoids form at high ratio while it changes to the body centered cubic structure at low ratio [5, 9, 10]. However, the relationship between Mn content, formation of dispersoids and elevated-temperature properties is still not fully established up to date. Furthermore, the solubility of Mn in Al is relatively higher [11, 12], which provides a favorable condition for dispersoid precipitation. Therefore, it is of great technical importance to investigate the influence of Mn on the dispersoid precipitation and elevated-temperature properties, especially at higher contents (> 1%).
In the present work, various Mn (~ 2.0 %) have been added to study their influence on the evolution of dispersoids and elevated-temperature properties. The formation of dispersoids at various Mn contents is quantitatively analyzed while the YS and creep resistance at 300°C are measured to reveal the relationship between the Mn contents, dispersoid precipitation and elevated-temperature properties.
2. Experimental
Al-Mn-Mg 3004 alloys with different Mn additions were prepared using commercially pure Al (99.7%), pure Mg (99.9%), Al-25%Mn, Al-25%Fe and Al-50%Si master alloys. In each batch, approximately 3 kg of materials were prepared in a clay-graphite crucible using an electric resistance furnace. The temperature of the melt was maintained at ~750°C for 30 min. The melt was degassed for 15 min and then poured into
30 mm × 40 mm × 80 mm. The chemical compositions of experimental 3004 alloys analyzed by optical emission spectrometer are shown in Table I.
Table I Chemical compositions of experimental alloys used in the present work
Alloy Elements (wt. %) Mn Mg Si Fe Al M10 1.06 1.12 0.23 0.52 Bal. M12 1.19 1.14 0.25 0.49 Bal. M15 1.52 1.15 0.25 0.53 Bal. M20 2.05 1.19 0.19 0.54 Bal.
Four alloys with different Mn contents were heat-treated at 375°C for 48 hours to study their effects on the dispersoid precipitation. The as-cast and heat-treated samples were polished for metallographic observation. Keller etching solution was used to show the segregation of elements and Al dendrites in as-cast condition [13]. To reveal the dispersoids clearly, the polished samples were etched in 0.5% HF solution for 30 seconds [2]. An optical microscopy (OM) and a scanning electron microscopy (SEM) were used to observe the as-cast and heat-treated microstructures. A transmission electron microscopy (TEM) was used to observe the distribution of dispersoids in details. The thickness of the TEM sample was measured with electron energy loss spectroscopy (EELS). All the TEM images shown in the present work were taken in the dispersoid area with the thickness about 100 nm. The size and number density of dispersoids were measured using Clemex PE 4.0 image analysis software on the TEM images. In this study, the volume fraction (vol. %) of dispersoid free zone (DFZ) was converted from the area fraction of DFZ measured by image analysis on optical images according to Delesse’s principle [14, 15], while the volume fraction of dispersoids was calculated according to the method introduced in the literature [4] and is shown in Eq. (1):
Vv = Ad K̅D̅
K̅D̅+ t(1 − ADFZ) (1)
where D ̅ is the average equivalent diameter of dispersoids, which was calculated according to the literature [4]; t is the TEM foil thickness; Ad is the area percentage of
dispersoids from TEM observation; ADFZ is the area percentage of DFZ from OM
measurements; and K̅ is the average shape factor of dispersoids.
Additionally, electrical conductivity (EC), Vickers microhardness, YS and creep properties were measured. Both EC and microhardness were measured at room temperature. The mechanical property (YS) at 300°C was obtained from compression tests at a strain rate of 10-3/s, which were performed on a Gleeble 3800 thermomechanical
simulator unit using cylindrical specimens (15 mm in length and 10 mm in diameter). In the Gleeble compression tests, the specimen was heated to the required temperatures with a heating rate of 2°C/s and held for 3 minutes to stabilize. The compressive creep tests were performed at 300°C for 100 hours with a constant load of 45 MPa. The creep specimens were the same size as the Gleeble samples. Details of test methods can be found in our previous paper [2].
3. Results and discussion
3.1 Evolution of as-cast microstructure with various Mn contents
Fig. 1 shows the as-cast microstructure of experimental 3004 alloys with various Mn contents. It can be seen that when the Mn is lower than 1.5% (Alloy M15 in Fig. 1c), the as-cast microstructure is mainly composed of Al6(MnFe) intermetallics with minor Mg2Si,
as shown in Fig. 1a-1c. However, the primary Al6Mn/Al6(MnFe) and high volume of fine
Fig. 1d and 1e. Beside the majority of Al6(MnFe) intermetallics, stable but low volume of
α-Al(MnFe)Si intermetallics (~ 0.4 %) is also observed in all experimental alloys but they are not specifically shown in Fig. 1 due to their similarity with Al6(MnFe)
intermetallics. The difference between these two phases can be found in our previous paper [2].
Fig. 1 As-cast microstructure of experimental alloys: (a) Alloy M10, (b) Alloy M12, (c) Alloy M15 and (d)-(e) Alloy M20
As shown in Fig. 1, it is found that the volume fraction of Al6Mn/Al6(MnFe)
intermetallics is gradually increased from Alloy M10 to Alloy M15 but sharply rise in Alloy M20, which is 1.8 % in Alloy M10 to 2.1 % in Alloy M12 and 2.9 % in Alloy M15 but rapidly to 6.1 % in Alloy M20 from the image- analysis results. This is further confirmed by the X-ray diffraction shown in Fig. 2. The principal peaks of Al6Mn/Al6(MnFe) are indicated in the red square according to the literature [10, 18]. It
can be seen that there is a moderate increase from Alloy M10 to Alloy M15 but a remarkable increase in Alloy M20, confirming the increasing volume fraction of intermetallics with Mn addition, especially with higher Mn (2.0 %).
Fig. 2 XRD results of experimental alloys in as-cast condition
Fig. 3 shows the simulated equilibrium phase diagram of experimental alloys as well as the mole fraction of Al6(MnFe) intermetallics with various Mn contents from
likely shifts to higher Mn content due to the non-equilibrium condition with high cooling rate in the permanent mold casting used in the present work. Therefore, it is reasonable to classify Alloys M10, M12 and M15 as hypoeutectic alloys, in which Al dendrites first solidify before the eutectic intermetallics. Therefore, the Al6(MnFe) intermetallics are
always formed after Al dendrites and present in the interdendrites area. However, when the Mn content increases to 2 % in Alloy M20, which is higher than the eutectic point even though under non-equilibrium solidification, it becomes a hypereutectic alloy. Therefore, the first solidified phase changes to primary Al6Mn/Al6(MnFe) in Alloy M20,
as shown in Fig. 3a, and appears as the blocky form of intermetallics in Fig. 1d. This is also confirmed by Fig. 3b, which shows that the formation temperature of Al6Mn/Al6(MnFe) in Alloy M20 is higher than that of Al (~ 650°C). Moreover, the mole
fraction of Al6(MnFe) intermetallics in Fig. 3b also confirms the observation in Fig. 1
that the volume fraction of intermetallics initially gradually increases from Alloy M10 to Alloy M15 but rapidly rises in Alloy M20. One small peak on the evolution of Al6(MnFe)
intermetallics can be observed in Fig. 3b, which can be attributed to the formation of α-Al(MnFe)Si intermetallics during solidification (Fig. 3a). However, the difference between peak and plateau in four experimental alloys is similar, meaning a similar and small volume of α-Al(MnFe)Si intermetallics formed, which is consistent with our observation.
Fig. 3 The phase diagram (a) and mole fraction of Al6(MnFe) intermetallics (b) of
experimental alloys
The evolution of as-cast microstructure is greatly related to the various solidification sequences with increasing Mn contents. As shown in Fig. 3a, the Al6(MnFe)
intermetallics are solidified after the Al dendrite network in Alloys M10, M12 and M15. Therefore, they only occur in the interdendrite areas. As an example, the distribution of intermetallics in Alloy M12 is shown in Fig. 4a. It can be clearly seen that all of the intermetallics distribute in the interdendrite areas. In addition, it can be found that the solid solution level of Mn in the Al dendrites is high and Mn-rich areas are large (Keller etching effect [13]), providing the necessary condition for the precipitation of dispersoids during heat treatment. On the other hand, if the Mn content passes over the eutectic point, such as 2% in Alloy M20, primary Al6Mn/Al6(MnFe) intermetallics will first solidify,
which consumes many of Mn in the liquid. After that, most of Mn left in unsolidified liquid are still participated to the formation of fine Al6(MnFe) intermetallics in aluminum
matrix. Therefore, the solid solution level of Mn in aluminum matrix is generally low. As shown in Fig. 4b, only a small percentage of Mn-rich areas in the matrix can be found in
Alloy M20, leading to an unfavorable condition for the precipitation of dispersoid during subsequent heat treatment.
Fig. 4 Distribution of intermetallics in experimental alloys (Keller etched): (a) Alloy M12 and (b) Alloy M20
3.2 Evolution of dispersoids with addition of Mn
In the present work, the peak precipitation treatment of 375°C/48h was applied to experimental alloys according to the previous works [2, 6] and the microstructures etched with 0.5% HF solution after heat treatment are shown in Fig. 5. The distribution tendency of the dispersoid zone and the dispersoid free zone (DFZ) is clearly illustrated in Fig. 5. There is a gradual decrease of DFZ from Alloy M10 to Alloy M15 but a sharp increase in Alloy M20 with increasing Mn contents. As shown in Figs. 5a-5c, DFZ is only present in the interdendrite area surrounding Al6(MnFe) intermetallics and its volume fraction is
gradually decreased from 28 % in Alloy M10 to 20 % in Alloy M15, as shown in Table II. However, in Alloy M20 (Fig. 5d), DFZ seems to present over a large area of the aluminum matrix and its volume fraction is much higher than that of other three alloys in Fig. 5a-5c, which reaches as high as 45 % (Table II).
Fig. 5 Microstructure of experimental alloys treated after 375°C/48h (0.5% HF etched): (a) Alloy M10, (b) Alloy M12, (c) Alloy M15 and (d) Alloy M20
The evolution of DFZ can be attributed to the different solid solution levels of Mn in the matrix with Mn additions. When Mn content is lower than the eutectic point (Alloys M10, M12 and M15 in the present work), only the formation of Al6(MnFe) intermetallics
in the interdendrite areas consumes Mn, leading to the presence of interdendrite DFZ. As shown in Fig. 1, a moderate increase on the volume fraction of Al6(MnFe) among Alloys
M10, M12 and M15 is observed, which is from 1.8 % to 2.9 %, meaning a similar consumption of Mn. On the other hand, the Mn content in the alloys increases from Alloy M10 to Alloy M15, resulting in an increased Mn solid solution. Therefore, the distribution of Mn-rich areas in the matrix increases with increasing Mn contents, resulting in the gradually decreasing volume of DFZ from Alloy M10 (28 %) to Alloy M15 (19 %). However, in Alloy M20 with Mn higher than eutectic point, a large amount primary Al6Mn/Al6(MnFe) and fine Al6(MnFe) form during solidification, which
M15, leading to a lower Mn solid solution level in the matrix. Therefore, much higher volume fraction of DFZ (41 %) presents and DFZs appear almost everywhere in Alloy M20 (Fig. 5d).
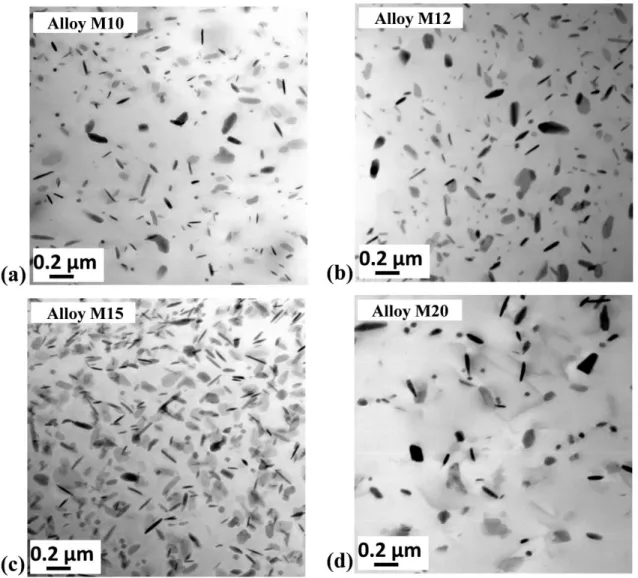
The distribution of dispersoids in the dispersoid zone was studied in details using TEM due to their submicro size and results are shown in Fig. 6. It is to mention that all the dispersoids in the present work are the α-Al(MnFe)Si dispersoids based on the TEM-EDS results and the previous works [2, 9]. It is shown that the size of dispersoids slightly decreases from Alloy M10 to Alloy M15 but it becomes bigger in Alloy M20. Meanwhile, the volume fraction of dispersoids initially increases from Alloy M10 (Fig. 6a) to Alloy M12 (Fig. 6b) and further to Alloy M15 (Fig. 6c). However, much less dispersoids can be observed in Alloy M20 shown in Fig. 6d. As shown in Table II, the size of dispersoids is found to be 71 nm in Alloy M10, 64 nm in Alloy M12 and 62 nm in Alloy M15 but 77 nm in Alloy M20. On the other hand, the volume fraction of dispersoids increases from 2.68 % in Alloy M10 to 3.16 % in Alloy M15 but it drops to 1.67 % in Alloy M20.
Fig. 6 Distribution of dispersoids in experimental alloys after 375°C/48h: (a) Alloy M10, (b) Alloy M12, (c) Alloy M15 and (d) Alloy M20
Table II Characters of dispersoids and DFZ in experimental alloys
Alloys Dispersoids DFZs Equivalent diameter (nm) vol. % vol. % M10 71 (12) 2.68 (0.58) 28 (11) M12 64 (15) 2.89 (0.64) 23 (14) M15 62 (9) 3.16 (0.39) 19 (8) M20 77 (23) 1.67 (0.67) 41 (19)
Due to the fact that rapid decomposition of supersaturated solid solution of Mn in the matrix during heat treatment provides the essential condition for the precipitation of dispersoids, therefore, the evolution of dipsersoids is greatly related to the gradient difference of Mn concentration between as-cast and after-treated conditions. According to the literature [4, 5, 19], the concentration of Mn solutes in solid solution can be estimated by the evolution of EC with the following equation (2):
1/EC=0.0267+0.032Fess%+0.033Mnss%+0.0068Siss%+0.003Mgss%+0.0021particle% (2)
where, Fess%, Mnss%, Siss% and Mgss% and particle% are all the solid solution level of various alloying elements (wt.%) while particle% is the volume fraction of particles (vol.%). As can be seen from Eq. (2), Siss and Mgss and particles have less effect on EC than Mnss and Fess. In addition, almost all of Fe precipitated in the form of intermetallics
during solidification. Therefore, the change of EC during the heat treatment mainly depends on the concentration of Mn in solid solution. Table III lists the measured EC, volume fraction of all intermetallics including dominant Al6Mn/Al6(MnFe) as well as
minor Mg2Si and α-Al(MnFeSi) intermetallics, and the calculated Mn concentrations in
the solid solution at both as-cast and after heat-treatment conditions.
Table III Calculated Mn concentrations in the solid solution
Alloy EC Intermetallics (Vol. %) Concentration of Mn solutes (wt. %) AC P AC P AC P ΔC M10 26.6 39.1 2.5 (0.5) 2.7(0.6) 0.87 0.23 0.65 M12 25.2 38.8 2.7(0.4) 3.1(0.5) 0.97 0.21 0.76 M15 23.6 38.6 3.5(0.6) 3.8(0.5) 1.06 0.17 0.89 M20 23.9 31.6 6.8(1.2) 7.2(1.5) 0.82 0.26 0.56
Note: “AC” and “P” stands for “as-cast” and “after-treated” condition, respectively. Standard deviation is shown in bracket
As shown in Table III, the concentration of Mn in as-cast condition increases with Mn addition until to 1.5 %. However, with further addition of Mn to 2 % (Alloy M20), the formation of a large amount of primary and fine Al6(MnFe) intermetallics (Fig. 1d)
consumes most of Mn in the matrix, leading to the lowest Mn concentration in the matrix, which is 0.82 % compared to 1.06 % in Alloy M15. The Mn concentration after heat treatment (375°C/48h) and the difference of Mn concentration (ΔC) between as-cast and after-treated are also calculated in Table III. It is found that ΔC increases from Alloy M10 (0.65 %) to M12 (0.76 %) and further to M15 (0.89 %). Because most Mn solute atoms precipitated in dispersoids, the volume fraction of dispersoids increases with rising Mn contents in Alloys M10, M12 and M15. However, when the Mn is higher (2 % in Alloy M20), ΔC even becomes smaller than that of Alloy M10, resulting in the lowest volume fraction of dispersoids in the experimental alloys.
3.3 Elevated-temperature properties
In order to evaluate the influence of Mn contents on the mechanical properties, the
evolution of microhardness at RT was measured in different Mn-containing alloys (Fig. 7a). It can be found that the microhardness initially increases from Alloy M10 (1.0 % Mn) to M12 (1.2 % Mn) and further to M15 (1.5 % Mn), indicating the positive
effect of Mn addition on improvement of mechanical properties at RT. However, the microhardness decreases with further addition of Mn to 2 % (Alloy M20) when compared to Alloy M15.
Fig. 7 Evolution of microhardness at RT (a) and YS at 300 °C (b) with Mn contents Meanwhile, the YS at 300°C was also measured and results are shown in Fig. 7b. Similar tendency to the microhardness at RT, the YS at 300°C increases with increasing Mn contents until to 1.5 % but it decreases when 2.0 % Mn was added. For instance, the YS at 300°C first increases from 78 MPa in Alloy M10 to 80 MPa in Alloy M12 and 84 MPa in Alloy M15 with increasing Mn contents from 1 % to 1.5 % but it drops to 75 MPa in Alloy M20 with further increasing Mn content to 2 %.
It is reported [2, 20] that the microhardness at RT and the YS at 300°C in 3004 alloys with 1.0-1.2 % Mn were 50 HV and 55 MPa respectively after the industrial homogenization treatment (600°C/24h), in which there was almost no dispersoids precipitated, is. Although the properties at both RT and 300°C in Alloy M20 after 375°C/48h are the worst among four alloys, they are still higher than that after the homogenization-treated 3004 alloys, which is still 59 HV on microhardness at RT and is 75 MPa on YS at 300°C, indicating the important effect of dispersoid strengthening on mechanical properties both at RT and elevated temperature. Furthermore, it is noted that the improvement on mechanical properties at 300°C is larger than at RT, confirming the remarkable enhancement on elevated-temperature properties from dispersoids. For
instance, the microhardness at RT is improved from 50 HV to 67 HV (34% increase) and the YS at 300°C is increased from 55 MPa to 84 MPa (54% increase) compared the homogenization condition without the presence of dispersoids to the optimized condition in the present work (Alloy M15 after 375°C/48h).
For applications at elevated temperature, the creep resistance is one of the most important considerations in alloy selections [21, 22]. Therefore, the creep properties at 300°C of experimental alloys after 375°C/48h were assessed. The typical creep curves of four alloys are shown in Fig. 8 and the creep properties are summarized in Table IV.
Fig. 8 Typical creep curves at 300°C of experimental alloys after 375°C/48h Table IV Creep properties of experimental alloys
Alloy M10 M12 M15 M20
Total creep stain 0.015 0.012 0.005 0.022
Minimum creep strain rate
(s-1) 3.5× 10
As shown in Fig. 8, it is clear to observe that the total creep strain decreases from Alloy M20 to M10 and M12 and finally to M15. As listed in Table IV, Alloy M20 possesses the highest values of the total creep stain and minimum creep rate. The total creep strain is 0.022 in Alloy M20 but decreases to the lowest value of 0.005 in Alloy M15. On the other hand, the calculated minimum creep rate is 5.3× 10⁻⁸ s-1 in Alloy M20 and it decreases to 3.5× 10⁻⁸ s-1 in Alloy M10, 3.1× 10⁻⁸ s-1 in Alloy M12 and further to the lowest value of 5.5× 10⁻⁹ s-1 in Alloy M15, showing the highest creep resistance in Alloy M15, which is in the agreement with the mechanical properties shown in Fig. 7. One thing to be mentioned is that though the creep resistance of Alloy M20 is the worst among four experimental alloys, it is still higher than that in the homogenization-treated 3004 alloy (600°C/24h), which was 1.4 × 10⁻⁶ s-1 from the literature [2].
For the evolution of mechanical properties, two important mechanisms should be considered in the present work, which are solid solution hardening and dispersoid strengthening [2, 3]. As shown in Table III, the concentration of Mn in matrix after 375°C/48h in four experimental alloys is more or less similar, indicating the similar contribution from Mn solid solution strengthening. Therefore, it is reasonable to believe that the changes of elevated-temperature properties (YS and creep resistance) are principally resulted from the difference of dispersoids (volume fraction and size) with Mn contents. Due to the partially coherence of dispersoids with Al matrix [1], they can make remarkable contribution on the improvement of alloy properties. According to the Orowan strengthening mechanism on strength and creep resistance [4, 23, 24], the elevated-temperature properties increase with the increasing volume fraction of dispersoids and the decreasing size of dispersoids (Table II), explaining the evolution of
strength and creep resistance with various Mn contents in the present work. In brief, as shown in Fig. 5-8, proper control of the Mn content (~1.5 % in the present work) can provide the best condition for dispersoid precipitation and hence the highest properties at both RT and elevated temperature, making a further progress in exploring the elevated-temperature applications using Al-Mn-Mg 3004 alloys.
4. Conclusions
In the present work, the influence of Mn contents on the microstructure and elevated-temperature properties has been investigated with the following obtained conclusions:
(1) In as-cast microstructure, Al6(MnFe) is the predominant intermetallics
distributed in the interdendrite areas when the Mn content is lower than 1.5 wt. %. With further increasing Mn content to 2 wt. %, the blocky primary Al6Mn/Al6(MnFe) and high
volume of fine Al6(MnFe) intermetallics form in the aluminum matrix, which consumed
a large amount of soluted Mn that are no more available for dispersoid precipitation. (2) After the precipitation heat treatment (375°C/48h), the volume fraction of dispersoids increases and the size decreases with increasing Mn contents and reaches the peak condition in the alloy with 1.5 wt. % Mn. However, with further addition to 2 wt. % Mn, the volume fraction of dispersoids rapidly decreases due to the increase in volume fraction of dispersoid free zones.
(3) The best combination of microhardness at room temperature, yield strength and creep resistance at 300°C obtained by heat-treated at 375°C/48h can be obtained when the Mn content is optimized at 1.5 wt. %, due to the important contribution of dispersoid strengthening.
Acknowledgments
The authors would like to acknowledge the financial support of the Natural Sciences and Engineering Research Council of Canada (NSERC) and Rio Tinto Aluminum through the NSERC Industry Research Chair in the Metallurgy of Aluminum Transformation at University of Quebec at Chicoutimi.
References
[1] Y. J. Li, A. M. F. Muggerud, A. Olsen, T. Furu: Precipitation of partially coherent α-Al(Mn,Fe)Si dispersoids and their strengthening effect in AA 3003 alloy. Acta Mater., 60, 1004 (2012).
[2] K. Liu, X. G. Chen: Development of Al–Mn–Mg 3004 alloy for applications at elevated temperature via dispersoid strengthening. Mater. Des., 84, 340 (2015).
[3] K. Liu, X. G. Chen: Evolution of Intermetallics, Dispersoids, and Elevated Temperature Properties at Various Fe Contents in Al-Mn-Mg 3004 Alloys. Metall. Mater. Trans. B, 47B, 3291 (2015).
[4] Y. J. Li, L. Arnberg: Quantitative study on the precipitation behavior of dispersoids in DC-cast AA3003 alloy during heating and homogenization. Acta Mater., 51, 3415 (2003). [5] A. M. F. Muggerud, E. A. Mørtsell, Y. Li, R. Holmestad: Dispersoid strengthening in AA3xxx alloys with varying Mn and Si content during annealing at low temperatures. Mater. Sci. Eng., A, 567, 21 (2013).
[6] K. Liu, H. Ma, X. G. Chen: Enhanced elevated-temperature properties via Mo addition in Al-Mn-Mg 3004 alloy. J. Alloys Compd. , 694, 354 (2017).
[7] K. Liu, A. M. Nabawy, X.-G. Chen: Influence of TiB2 nanoparticles on the elevated-temperature properties of Al-Mn-Mg 3004 alloy. Trans. Nonferrous Met. Soc. China, 27, 771 (2017).
[8] J. G. Kaufman. Properties of aluminum alloys : tensile, creep, and fatigue data at high and low temperatures. (ASM International ; Aluminum Association, Materials Park, Ohio; Washington, D.C., 1999), pp. 16-93, 162-232.
[9] Y. J. Li, L. Arnberg: Evolution of eutectic intermetallic particles in DC-cast AA3003 alloy during heating and homogenization. Mater. Sci. Eng., A, 347, 130 (2003).
[10] A. M. F. Muggerud, Y. Li, R. Holmestad: Composition and orientation relationships of constituent particles in 3xxx aluminum alloys. Philos. Mag., 94, 556 (2014).
[11] A. Shukla, A. D. Pelton: Thermodynamic Assessment of the Al-Mn and Mg-Al-Mn Systems. J. Phase Equilib. Diff., 30, 28 (2009).
[12] X. J. Liu, I. Ohnuma, R. Kainuma, K. Ishida: Thermodynamic assessment of the Aluminum-Manganese (Al-Mn) binary phase diagram. J. Phase Equilib. , 20, 45 (1999). [13] M. Mohammadtaheri: A New Metallographic Technique for Revealing Grain Boundaries in Aluminum Alloys. Metall. Microstruct. Anal., 1, 224 (2012).
[14] P. X. Liu, Y. Liu, R. Xu: Microstructure quantitative analysis of directionally solidified Al-Ni-Y ternary eutectic alloy. Trans. Nonferrous Met. Soc. China, 24, 2443 (2014).
[15] E. R. Weibel, H. Elias. Quantitative methods in morphology. (Springer-Verlag, Berlin, New York, 1967), pp. 89-98.
[16] A. Bahadur: Intermetallic phases in Al-Mn alloys. J. Mater. Sci., 23, 48 (1988). [17] H. Kang, X. Li, Y. Su, D. Liu, J. Guo, H. Fu: 3-D morphology and growth mechanism of primary Al6Mn intermetallic compound in directionally solidified Al-3at.%Mn alloy. Intermetallics, 23, 32 (2012).
[18] Y. Liu, G. Huang, Y. Sun, L. Zhang, Z. Huang, J. Wang, C. Liu: Effect of Mn and Fe on the Formation of Fe- and Mn-Rich Intermetallics in Al–5Mg–Mn Alloys Solidified Under Near-Rapid Cooling. Materials, 9, 88 (2016).
[19] Q. Zhao, B. Holmedal, Y. Li: Influence of dispersoids on microstructure evolution and work hardening of aluminium alloys during tension and cold rolling. Philos. Mag., 93, 2995 (2013).
[20] O. S. Es-Said, A. Zeihen, M. Ruprich, J. Quattrocchi, M. Thomas, K. H. Shin, M. O’Brien, D. Johansen, W. H. Tijoe, D. Ruhl: Effect of processing parameters on the earing and mechanical properties of strip cast type 3004 Al alloy. J. Mater. Eng. Perform., 3, 123 (1994).
[21] E. Arzt: Creep of dispersion strengtheded Materials: A critical assessment. Res Mechanica, 31, 399 (1991).
[22] K. E. Knipling, D. C. Dunand, D. N. Seidman: Criteria for developing castable, creep-resistant aluminum-based alloys - A review. Z. METALLKD, 97, 246 (2006). [23] G. E. Dieter. Mechanical metallurgy. (McGraw-Hill, New York, 1986), pp. 449-450. [24] R. A. Karnesky, L. Meng, D. C. Dunand: Strengthening mechanisms in aluminum containing coherent Al3Sc precipitates and incoherent Al2O3 dispersoids. Acta Mater., 55, 1299 (2007).