Détermination de l'influence de différentes teneurs en oxygène
dissous sur le succès d'éclosion et l'embryogenèse chez le flétan
du Groenland (Reinhardtius hippoglossoides)
MÉMOIRE PRÉSENTÉ
Comme exigence partielle de la Maîtrise ès Sciences en Océanographie
PAR
© SAHAR MEJRI
UNIVERSITÉ DU QUÉBEC À RIMOUSKI Service de la bibliothèque
Avertissement
La diffusion de ce mémoire ou de cette thèse se fait dans le respect des droits de son auteur, qui a signé le formulaire « Autorisation de reproduire et de diffuser un rapport, un mémoire ou une thèse ». En signant ce formulaire, l’auteur concède à l’Université du Québec à Rimouski une licence non exclusive d’utilisation et de publication de la totalité ou d’une partie importante de son travail de recherche pour des fins pédagogiques et non commerciales. Plus précisément, l’auteur autorise l’Université du Québec à Rimouski à reproduire, diffuser, prêter, distribuer ou vendre des copies de son travail de recherche à des fins non commerciales sur quelque support que ce soit, y compris l’Internet. Cette licence et cette autorisation n’entraînent pas une renonciation de la part de l’auteur à ses droits moraux ni à ses droits de propriété intellectuelle. Sauf entente contraire, l’auteur conserve la liberté de diffuser et de commercialiser ou non ce travail dont il possède un exemplaire.
Composition du jury:
Philippe Archambault, président du jury, Université du Québec à Rimouski Réjean Tremblay, directeur de recherche, Université du Québec à Rimouski Céline Audet, codirecteur de recherche, Université du Québec à Rimouski Yvan Lambert, codirecteur de recherche, Pêches et Océans Canada Patrick Ouellet, examinateur externe, Pêches et Océans Canada
REMERCIEMENTS
Les remerciements ... leur rédaction est le signe qui ne trompe pas que la maîtrise est bel et bien terminée ... c'est donc avec beaucoup d'émotion et de plaisir que je les écris mais aussi avec le cœur gros ...
Je tiens tout d'abord à remercier M. Philippe Archambault et M. Patrick Ouellet d'avoir accepté d'évaluer ce travail. Je remercie également le gouvernement tunisien, le CRSNG et le RAQ pour leur soutien financier.
Je m'adresse à Monsieur Réjean Tremblay. Réjean, comme j'ai l'habitude de t'appeler, les mots ne pourront jamais traduire toute ma gratitude et ma reconnaissance. Je n'oublierai jamais ce jour de mars 2009 où tu as répondu favorablement à ma candidature spontanée et qui a été le point de départ d'une merveilleuse aventure. Tu as été un «Chef» exemplaire, toujours zen et de bonne humeur, plein de bonnes idées, ouvert à la discussion et d'une pédagogie exemplaire.
C'est avec beaucoup d'émotion que je m'adresse à Madame Céline Audet: Céline, tu as été plus qu'une codirectrice pour moi. C'est incontestablement à toi que je dois mon plongeon dans le domaine de la recherche scientifique. Ton dynamisme, ta patience, ta disponibilité, ta rigueur scientifique, ton perfectionnisme et ton abnégation m'ont toujours fascinée. Un énorme merci!!
C'est avec la même émotion et la même gratitude que je m'adresse à Yvan Lambert. La pertinence de tes remarques et ta clairvoyance ont fait prendre à cette maîtrise un tournant passionnant. Tu n'as jamais lésiné sur les moyens ni sur le temps pour valoriser ce travail. Je n'oublierai jamais ta bonne humeur matinale malgré la journée surchargée qui t'attendait, ni toutes les discussions instructives que j'ai eues avec toi.
Un grand merci à Denis Chabot, qui s'est très vite passionné pour le sujet, de m'avoir fourni le montage pour l'oxygène dissous. Tu n'as pas hésité à te déplacer à la salle des bassins pour régler quelques problèmes techniques et à m'accueillir dans ton bureau pour discuter longuement des améliorations à apporter au montage malgré les nombreuses tâches qui t'accaparent. Je t'en suis vraiment reconnaissante. Un énorme merci à Mario Péloquin, Jean-François et Marie-Claude Lamarche qui m'ont énormément aidée pour la mise en place du dispositif expérimental et pour les nombreux échantillonnages. Je remercie également Jérôme, Tanya, Linda, Rosario Dominguez-Petit et Iften pour leur aide précieuse durant les analyses au laboratoire et la prise de différentes mesures. Je voudrais également remercier tout le personnel de l'ISMER, plus particulièrement Nycole, Jocelyne et Sylvie pour leur aide dans les formalités administratives.
Au tour maintenant des personnes qui ont fait de ces deux ans de maîtrise l'une des périodes de ma vie les plus inoubliables et les plus agréables sur le plan humain.
À Amélie, Isabelle, Lise, Lucie, Claire, Elodie, Cécile et Marie-Pier pour leur présence et leur soutien conti nus pendant les moments durs. Ce n'était pas facile de me supporter tous les jours!! Je ne te remercierai jamais assez Cécile pour m'avoir initiée au ski alpin. À Elyes et Héla, qui de l'autre côté du Pacifique et de l'Atlantique ont toujours su être des vrais amis. À Yasmine, pour avoir été ma meilleure amie depuis des années, pour les stages inoubliables passés à Tabarka et Sidi Mechreg, pour les sueurs froides que tu m'as données lors du séisme au Japon, pour les bons moments de folies et surtout pour nous consoler mutuellement la veille de chaque départ arrache cœur. Aux deux personnes qui ont eu la lourde tâche de m'avoir pour fille Ue sais que cela n'a pas été facile tous les jours), de m'armer pour la vie et de m'avoir donné la meilleure éducation qui soit: bien plus que des remerciements pour Papa et Maman. À ma petite sœur, pas si petite que ça d'ailleurs, pour son soutien et ses bons conseils. Aux jumeaux, qui étaient mon rayon de soleil tous les jours. J'espère être le bon exemple de la grande sœur !! À tous ceux que j'ai pu oublier par mégarde et qui m'ont sûrement épaulée d'une façon ou d'une autre.
RÉSUMÉ
Les eaux profondes (> 150 m) de l'estuaire et du golfe du Saint-Laurent (EGSL) sont hypoxiques avec le plus bas niveau de saturation en oxygène dissous (00) observé dans l'estuaire (20%sat, [pourcentage de saturation]). La forte abondance du flétan du Groenland (Reinhardtius hippoglossoides) dans les chenaux profonds de l'EGSL semble démontrer la tolérance de cette espèce aux conditions d' hypoxie. Cependant le développement et la survie des œufs bathypélagiques chez cette espèce pourraient être affectés par leur exposition à de faibles niveaux d'OD, ces stades de développement étant généralement plus sensibles aux conditions environnementales.
L'objectif de cette étude était de déterminer l'effet des différentes teneurs en 00 sur le taux de survie, le développement embryonnaire (DE), le succès d'éclosion et la dynamique des classes de lipides chez les œufs du flétan du Groenland. Pour ce faire, les œufs de six femelles fécondés artificiellement par la laitance d'un seul mâle ont été exposés à cinq niveaux d'OD. Les niveaux d'OD ont été répartis comme suit: deux conditions d'hypoxie sévère (10 et 20%sat ~ 0.7 et 1.4 mgL1), deux conditions d'hypoxie modérée (35 et 50%sat ~ 2.4 et 3.5 mgL1) et une condition de normoxie (100%sat ~ 6,9 mgL1). Le DE a été suivi à tous les 2-3 jours jusqu'à l'éclosion. Les niveaux d'OD et les différentes femelles utilisées ont démontré des effets significatifs sur les taux d'éclosion et le DE. Il n'y a pas eu éclosion et le DE a été bloqué en hypoxie sévère (lO%sat). Chez certaines femelles, des résultats similaires furent observés à tous les niveaux d'OD. Nos résultats ont également démontré que la variation des classes de lipides était fonction des niveaux d'OD et des femelles. La majeure partie des lipides présente dans les œufs du flétan du Groenland était constituée de phospholipides (PL). Cependant ils n'ont pas été utilisés ni durant le DE ni sous un stress d'hypoxie sévère. Une utilisation des triacylglycérols (TAG), se reflétant sur les lipides totaux a été observée, sous hypoxie sévère (lO%sat) seulement. Un gradient Est-Ouest de saturation en 00 au niveau de l'EGSL, où les niveaux d'OD diminuent de 50-60%sat dans le détroit de Cabot à 20-30%sat dans l'estuaire pourrait limiter le recrutement et le choix des aires de reproduction du flétan du Groenland. En hypoxie modérée (20-35%sat), un succès d'éclosion plus faible a été observé chez un certain nombre de femelles. Ceci semble démontrer que ces niveaux d'OD pourraient limiter le DE et le succès d'éclosion chez les femelles dont la qualité des œufs est inférieure.
ABSTRACT
The Estuary and Gulf of St. Lawrence (EGSL) ecosystem is threatened by the extent and severity of hypoxic conditions. The high abundance of Greenland halibut (Reinhardtius hippoglossoides) in deep channels of the EGSL suggests a high tolerance of this species to hypoxia. However, bathypelagic Greenland halibut eggs could be less tolerant to hypoxia since early life stages are usually more sensitive than adult stages to environmental stressors. The aim of this study was to determine the influence of different levels of dissolved oxygen (DO) on survival, embryonic development (ED), and hatching success of Greenland halibut eggs. In a laboratory-based experiment, fertilized eggs from six females were exposed to five DO levels: severely hypoxic (l0 and 20%sat [percent saturation]; ~0.7 and lA mg.L-l), moderately hypoxic (35 and 50%sat; ~2A and 3.5 mg.L-l), and normoxic (lOO%sat; ~6.9 mg.L-l). Embryonic development in the different DO conditions was assessed by sampling eggs every 2-3 days until hatching. Changes in lipid composition were also measured to investigate the effects of DO levels and female origin on the biochemical composition of eggs during ED: significant differences (p<0.05) were observed in hatch rates and embryonic development as a function of both factors. In severely hypoxic conditions (lO%sat) and for eggs from sorne females, no hatching occurred and ED was impaired. Among developmental stages, phospholipids (PL) were the dominant lipid classes. The effects of DO levels and female origin were visible on lipid class dynamics. Although triacylglycerols (TAG) were a minor lipid class in terms of abundance, they were used under severe hypoxia. The East-West DO saturation gradient in the EGSL, where DO levels fall from 50-60%sat in Cabot Strait to 20-30%sat in the estuary, could limit the breeding area and thus recruitment of Greenland halibut. At moderate hypoxia (20-35%sat), lower hatching occurred for eggs from sorne females. This shows that these saturation values are critical for ED and hatching success for females with lower eggs quality.
T ABLE DES MATIÈRES
REMERCIEMENTS ... IV RÉSUMÉ ... VI ABSTRACT ... VII TABLE DES MATIÈRES ... VIII LISTE DES TABLEAUX ... X LISTE DES FIGURES ... XI LISTE DES ANNEXES ... XII
INTRODUCTION GÉNÉRALE ... 1
CHAPITRE 1 INFLUENCE OF DIFFERENT LEVELS OF DISSOLVED OXYGEN ON THE SUCCESS OF GREENLAND HALIBUT (REINHARDTIUS HIPPOGLOSOIDES) EGG HATCHING AND EMBRYONIC DEVELOPMENT ... 7
1.1 INTRODUCTION ... 7
1.2 MATERIALS AND METHODS ... 9
1.2.1 Fish sampling ... 9
1.2.2 Fertilization and incubation ... 10
1.2.3 Experimental design ... 10
1.2.4 Egg samplings ... 13
1.2.5 Laboratory analysis ... 14
1.2.7 Statistical analyses ... 19
1.3 RESULTS ... 21
1.3.1 Physiological variables ... 21
1.3.2 Hatching rates ... 2 2 1.3.3 Early development ... 24
1.3.4 Variations in embryonic developmental ... 27
1.3.5 Lipid class analyses ... 31
1.4 DISCUSSION ... 36
1.4.1 Hatching and embryonic development ... 36
1.4.2 Characterization of Greenland halibut eggs and Iipid class dynamics38 DISCUSSION GÉNÉRALE ... 43
RÉFÉRENCES BIBLIOGRAPHIQUES ... 47
LISTE DES TABLEAUX
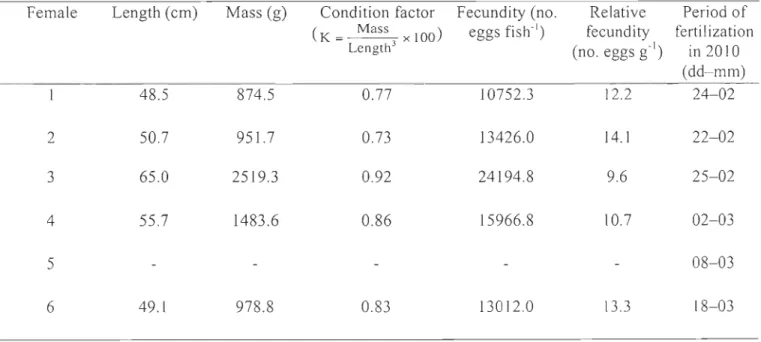
Table 1. Embryonic developmental stages in Greenland halibut. ... 16 Table 2. Length, mass, condition factor, fecundity, relative fecundity, and period of
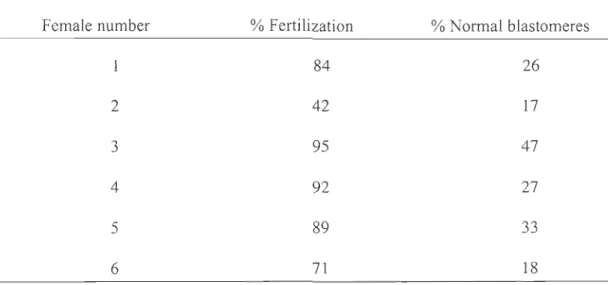
fertilization for the six Greenland halibut females used in the experiment. ... 21 Table 3. Percentages of fertilization and normal blastomeres obtained for each of the six females used in the experiment. ... 25
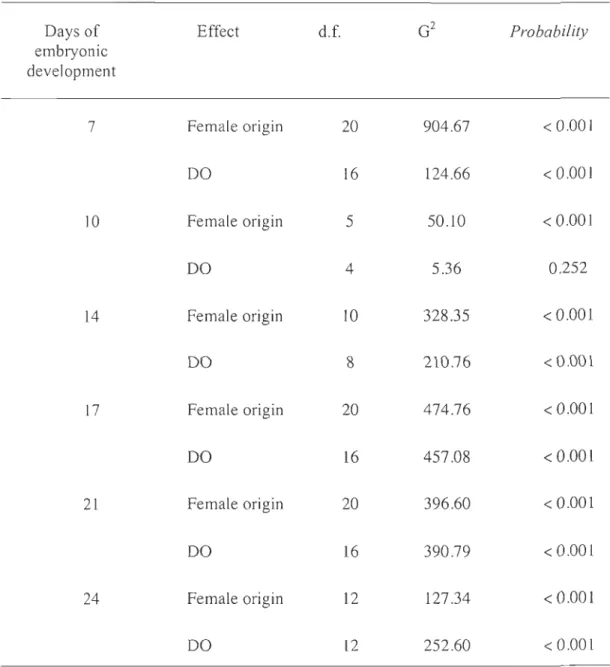
Table 4. Summary of Multinomial Logistic regression (MLogit) tests on the variations in embryonic developmental of Greenland halibut eggs sampled on days 7, 10, 14, 17, 21, and 24 as a function of female origin and dissolved oxygen (DO) levels ... 28
Table 5. Variations in total lipid contents and proportions of ketones (KET) , triacylglycerols (TAG) , and phospholipids (PL) from Greenland halibut eggs from females exposed to different dissolved oxygen (DO) levels on days 14, 17, and 21 (mean ± SD) ... 33
LISTE DES FIGURES
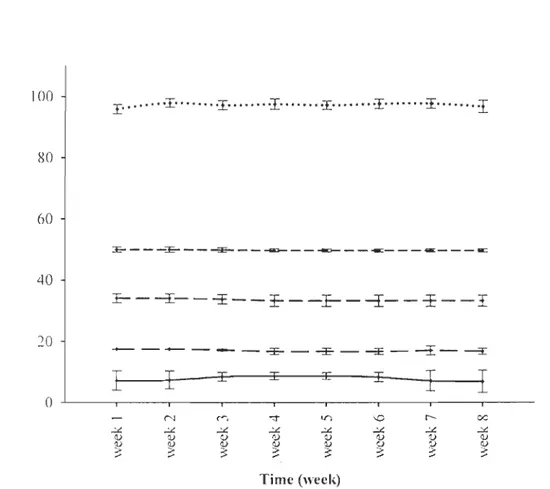
Figure 1. Weekly dissolved oxygen levels (percent saturation) in each treatment tank (mean
± SD) during the 8-week experiment on egg incubation ... 12
Figure 2. Mean hatch rates for Greenland halibut embryos obtained from four females and exposed to five levels of dissolved oxygen (DO) [mean ± SD] ... 23
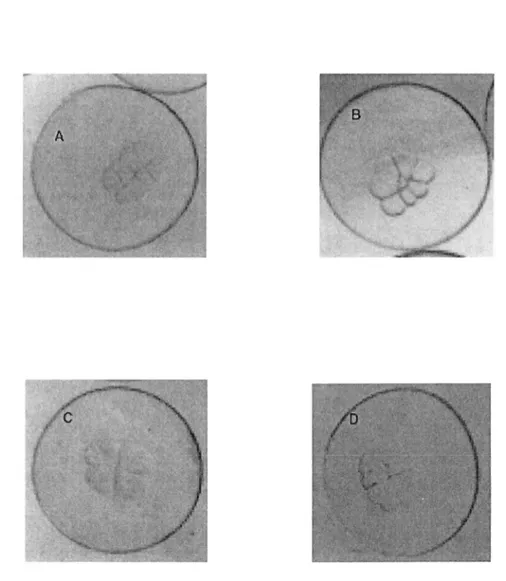
Figure 3. Greenland halibut blastomeres at the 8-cell stage ... 26
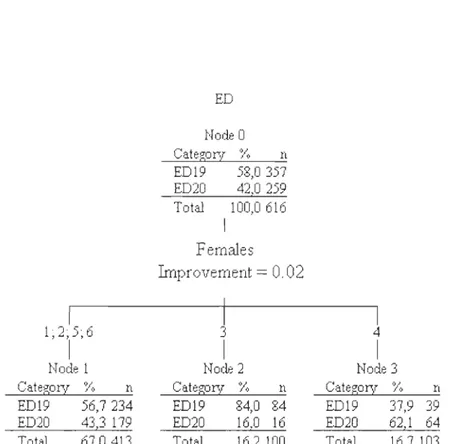
Figure 4. Classification tree for day 10 of embryonic development (ED) ... 29
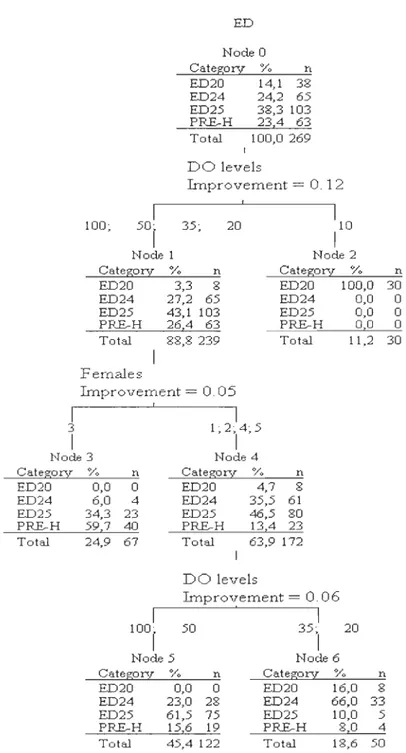
Figure 5. Classification tree for day 24 of embryonic development (ED) ... 30
Figure 6. Changes in totallipid content and proportions of triacylglycerols (TAG), ketones (KET), and acetone-mobile polar lipids (AMPL) in Greenland halibut eggs from different females on day 7 of embryonic development for eggs incubated at 1000/0sat in dissolved oxygen (DO) [mean ± SD] ... 32
LISTE DES ANNEXES
Annexe 1. Results of two-way ANOYAs, showing effects of dissolved oxygen (DO), female origin, and their interactions on hatch rate in Oreenland halibut eggs ... 57 Annexe 2. Results of one-way ANOY A, showing effects of female origin on total lipid contents and proportions of ketones (KET) , acetone-mobile polar lipids (AMPL), phospholipids (PL), and triacylglycerols (TAO) in Oreenland halibut eggs from different females on day 7 of embryonic development for eggs incubated at lOO%sat in dissolved oxygen (DO) ... 58 Annexe 3. Results of two-way ANOYAs, showing effects of female origin, dissolved oxygen (DO) and their interactions on total lipid contents and proportions of ketones (KET), phospholipids (PL), and triacylglycerols (TAO) from Oreenland halibut eggs from females exposed to different dissolved oxygen (DO) levels on days 14, 17, and 21 ... 59
INTRODUCTION GÉNÉRALE
L'hypoxie en milieu aquatique
L'oxygène dissous (00) est un des paramètres physico-chimiques important pour la croissance, la reproduction et la survie des organismes aquatiques (Diaz et al. 2009). Dans le milieu aquatique, diverses sources contribuent à l'apport d'oxygène: la diffusion atmosphérique, la photosynthèse phytoplanctonique et le mouvement des masses d'eau, ce dernier permettant surtout un mélange de 1'00 vers les couches profondes de la colonne d'eau (Diaz 2001). Dans les environnements marins et côtiers, aucun autre paramètre d'importance écologique n'a changé aussi drastiquement au cours des dernières décennies, ce changement conduisant parfois à l'apparition généralisée d'hypoxie (Diaz 2001).
Globalement, le nombre de zones côtières où l'hypoxie a été signalée s'est accru d'une façon exponentielle avec une moyenne de 5.5 % d'augmentation par année depuis 1916 (Vaquer-Sunyer et al. 2008). De façon générale, l'hypoxie est définie par une gamme de valeurs allant de 0.28 mg 02el ~ 3.7 %sat [pourcentage de saturation] (Kamykowski et al. 1990) à 4 mg 02L,l ~ 54.2 %sat (Paerl 2006). La majorité des études se réfère toutefois à un seuil de 2 mg 02el ~ 27.1 %sat pour définir 1 'hypoxie (Turner et al. 2005). Ce seuil correspond à la teneur en 00 à partir de laquelle on assiste à un effondrement de 1 '.abondance des espèces exploitées (Chesney et al. 2000). Cependant plusieurs études expérimentales indiquent que des impacts sont possibles à des niveaux supérieurs à ce seuil pour plusieurs organismes aquatiques (Vargo et al. 1977).
Les phénomènes hypoxiques sont principalement observés dans les estuaires et les régions côtières (Diaz 2001). En effet, dans ces milieux, la stratification verticale de la colonne d'eau limite les échanges entre les eaux profondes et celles de surface mieux oxygénées (Diaz et al. 20 Il). L' hypoxie naturelle est accentuée par l'eutrophisation due en partie aux apports anthropiques de nutriments (phosphore et nitrate principalement) (Gilbert et al. 2005). L'eutrophisation entraine une prolifération excessive du
phytoplancton à la surface. Celui-ci chute éventuellement dans la colonne d'eau, puis se dépose sur le fond. La dégradation de cette matière organique via la décomposition bactérienne réduit la disponibilité en OD dans les eaux profondes. Outre l'eutrophisation, l'augmentation de la température de l'eau provoquée par les changements climatiques accroît la demande en OD des organismes (Harris et al. 2006), réduit la solubilité de l'oxygène (Carpenter 1966) et la ventilation des eaux côtières en affectant les patrons de stratification (Stow et al. 2005). Cet accroissement des activités anthropiques et des changements climatiques globaux amplifie ainsi la fréquence et l'étendue des phénomènes d'hypoxie (Richmond et al. 2006). L'hypoxie est un phénomène commun dans la mer Baltique, la mer Noire, le golfe du Mexique, l'estuaire et le golfe du Saint-Laurent (EGSL) (Plante et al. 1998; Tomkiewicz et al. 1998; Rabalais et al. 2002).
L'hypoxie dans l'estuaire et le golfe du Saint-Laurent (EGSL)
Le système du Saint-Laurent (estuaire et golfe) compte parmi les écosystèmes où le niveau d'OD est inférieur à 100 %sat dans les eaux profondes. Au niveau de l'estuaire et du golfe de Saint-Laurent, les eaux profondes (> 200 m) ont un taux de saturation en OD inférieur à 65 %sat (Gilbert et al. 2005). Les niveaux d'oxygène diminuent dans le détroit de Cabot, avec des teneurs de 50 à 60 %sat, à environ 20 à 30 %sat dans l'estuaire (Thibodeau et al. 2006). Le golfe du Saint-Laurent reçoit à la fois les eaux froides et oxygénées du courant du Labrador et avec une plus grande proportion, celles provenant du Gulf Stream, qui sont chaudes et peu oxygénées (Gilbert et al. 2005). Ces eaux progressent
dans le chenal Laurentien et le golfe en direction de l'estuaire. Tout au long de leur
parcours, elles s'appauvrissent en OD suite à la respiration des organismes et à la décomposition bactérienne de la matière organique (MO) (Gilbert et al. 2005). Ce phénomène s'est accentué entre les années 1930 et 1980 suite aux changements survenus dans la contribution du courant du Labrador au mélange des eaux profondes, celle-ci passant de 72 % en 1930 à 53 % en 1980 (Faucher et al. 2004). De plus, l'augmentation des flux de MO marins et terrigènes ainsi que les différentes provenances des masses d'eau à densités inégales (Océan Atlantique, fleuve Saint-Laurent et bassins versants des Grands
3 Lacs) ont contribué à la détérioration des conditions d'OD dans les eaux les plus profondes. Les différentes densités des masses d'eau entrainent la stratification de la colonne d'eau en trois couches l'été et deux couches l'hiver (Thibodeau et al. 2006).
Réponse des organismes aquatiques à l'hypoxie
L'hypoxie devient une menace majeure pour les écosystèmes côtiers dans le monde entier et de faibles niveaux d'OD ont déclenché des mortalités d'organismes marins en de nombreux endroits (Chesney et al. 2000). Ces «zones mortes» sont dépourvues de ressources halieutiques incluant poissons, crevettes et crabes (Chesney et al. 2000; Rabalais et al. 2002). L 'hypoxie peut entrainer une perte importante de la biodiversité tout en limitant la distribution, la croissance et la reproduction des organismes aquatiques (Vaquer-Sunyer et al. 2008). Le seuil de tolérance à l'hypoxie varie selon les espèces et les écosystèmes (Kramer 1987; Wannamaker et al. 2000). Dans les régions sévèrement touchées, des conséquences comme des migrations forcées, un stress physiologique élevé, une réduction de l' habitat, une augmentation de la vulnérabilité à la prédation et une perturbation des cycles de vie peuvent être observés (Rabalais et al. 2002; Service 2004). Les espèces benthiques sont plus vulnérables que les espèces nectoniques qui sont mobiles et capables de migrer si l'habitat ne leur convient plus (Diaz et al. 1995). Les organismes benthiques qui vivent dans le sédiment appauvri en 00 sont éloignés de tout contact avec l'apport de l'oxygène atmosphérique et sont contraints à s'acclimater et/ou s'adapter jusqu'au retour aux conditions normales (Vaquer-Sunyer et al. 2008).
Dans l'EGSL, des espèces de foraminifères tolérantes à l 'hypoxie ont été retrouvées dans le fond de l'estuaire (Thibodeau et al. 2006) confirmant la baisse des niveaux d'OD. Malgré l'ampleur du phénomène d'hypoxie dans cette région, ses impacts n'ont été étudiés que pour la morue franche (Gadus marhua) dont le seuil létal a été établi à 28 %sat (Plante et al. 1998). Certaines espèces comme la crevette nordique (Pandalus borealis) ou le flétan du Groenland (Reinhardtius hypoglossoides) , encore abondantes dans les chenaux profonds
de l'EGSL, semblent plus tolérantes à l 'hypoxie (Gilbert et al. 2005). Cependant aucune étude n'a encore déterminé les effets de l'hypoxie sur celles-ci.
Problématique
Le flétan du Groenland (Reinhardtius hypoglossoides) est un poisson plat d'un grand intérêt commercial. En effet cette espèce représente 53 % de la biomasse des captures totales des poissons dans l'EGSL (DFO 2008). Les juvéniles, entre 15 et 30 cm, se concentrent principalement dans l'estuaire et au nord de l'île d'Anticosti alors que les poissons de plus grande taille (> 33 cm) sont répartis dans les différentes régions de l'EGSL (Treble et al. 2008). Ces observations suggèrent d'une part, que la tête du chenal Laurentien est la principale pouponnière pour cette population (DFO 2006) et d'autre part, que le flétan du Groenland tolère la baisse du niveau d 'OD avec un seuil létal pouvant se situer sous les 20-25 %sat communément mesuré dans l'estuaire. Les juvéniles semblent donc se retrouver dans des zones bien circonscrites. La principale période de frai du flétan du Groenland est en hiver entre les mois de janvier et de mars, mais peu d'informations sont disponibles sur les zones précises de reproduction dans l'EGSL (DFO 2006).
Malgré le grand intérêt pour la pêche de cette espèce, la biologie de la reproduction de celle-ci est encore peu connue (Gundersen et al. 2001). La connaissance des facteurs influençant la reproduction et la viabilité des œufs du flétan du Groenland est encore clairsemée. Cependant, nous savons que les œufs sont bathypélagiques (Àdlandsvik et al. 2004) ce qui augmenterait l'exposition de ces derniers à de faibles niveaux d'OD pendant leur développement.
Le développement embryonnaire (DE) des œufs de poissons plats comme le flétan du Groenland n'est pas très documenté et les stades de développement embryonnaire ont été partiellement définis (Stene et al. 1999). Toutefois, Stene et al. (1999) ont utilisé un nombre très limité d'échantillons d'œufs provenant d'une seule femelle. De plus, lors de cette expérience, seulement huit œufs ont complété leur DE et ont éclos. Aucune étude n'a encore relié le DE du flétan du Groenland dans l'EGSL aux facteurs environnementaux tels
5 que la température et l'OD ou des facteurs biotiques, tels que la qualité des œufs. Cependant, des études sur l'impact de l'hypoxie sur l'éclosion et la survie des œufs de poissons ont été effectuées sur diverses espèces comme la morue franche (Godus morhua) (Avery et al. 2009), le saumon Atlantique (Salmo salar) (Oppen-Berntsen et al. 1990), le flétan de l'Atlantique (Hippoglossus hippoglossus) (Helvik et al. 1993), le corégone Lavaret (Coregonus lavaretus) (Czerkies et al. 2002) et Acanthopagrus butcheri (Hassell et al. 2008).
La qualité des œufs pouvant être définie comme étant le potentiel de l'œuf à produire des alevins viables (Kj~rsvik et al. 1990) est liée au développement embryonnaire et au succès d'éclosion (Hansen et al. 2010). Elle peut être affectée par des facteurs génétiques, l'âge des femelles, des facteurs physico-chimiques, le moment de la ponte, les processus de surmaturation ainsi que les propriétés intrinsèques de l' œuf lui-même (Kj~rsvik et al. 1990; Bromage et al. 1992; Brooks et al. 1997). Bien que le taux de fécondation semble être un bon indicateur de la qualité des œufs chez les salmonidés, il n'est pas toujours corrélé avec la qualité des œufs chez certains poissons marins (Kj~rsvik et al. 1990). Kj~rsvik et al.
(1990) ont suggéré que l'évaluation de la symétrie des cellules aux premiers stades de clivage (blastomères normaux) peut être un bon indicateur de la qualité de l'œuf se reflétant par des corrélations positives avec le taux d'éclosion chez le flétan de l'Atlantique (Mangor-Jensen et al. 1998). Ce critère morphologique demeure le plus fiable à ce jour.
Les lipides sont considérés comme l'une des plus importantes sources d'énergie dans les œufs de poissons (R~nnestad et al. 1994; Wiegand 1996; Zhu et al. 2003). Ceci est particulièrement vrai pour les triacylglycérols (T AG), qui représentent la forme la plus courante de stockage d'énergie des œufs chez la plupart des poissons marins (Cowey et al. 1985). Toutefois, les œufs du flétan du Groenland sont caractérisés par une teneur en phospholipides (PL) beaucoup plus élevée que celle des TAG. Il a été observé que les espèces contenant moins de TAG dans leurs œufs, les PL peuvent être une importante source d'énergie durant le développement embryonnaire en plus de jouer leur rôle dans le maintien de la structure membranaire (Tocher et al. 1985; Fraser et al. 1988; Falk-Petersen
et al. 1989; Rainuzzo et al. 1997). Cependant, on peut observer au cours du développement embryonnaire une dynamique très variable dans les différentes classes de lipides, comme des variations importantes du contenu en PL. Ceci peut être expliqué par des processus de métabolisme complexes dus en partie aux variations du volume cellulaire et à la prolifération de la membrane cellulaire au cours du DE (Suthers 1992; Norton et al. 2001). Peu d'informations sont disponibles sur le métabolisme et la dynamique des classes de lipides au cours du DE chez les œufs des téléostéens (Suthers 1992).
Objectifs et Hypothèses
Cette étude fait partie d'un projet de recherche plus global qui VIse l'étude d'une problématique jugée préoccupante du point de vue des pêcheries commerciales du flétan du Groenland et de la crevette nordique dans l'estuaire et le golfe du Saint-Laurent, soit celle de l 'hypoxie. Ma maîtrise visait plus particulièrement l'étude de l'effet des concentrations
d'aD sur l'embryogénèse et le succès d'éclosion des œufs du flétan du Groenland. Les objectifs spécifiques étaient (1) évaluer les effets de faibles concentrations en 00 sur le taux de survie, le développement embryonnaire et le succès d'éclosion des œufs du flétan du Groenland, (2) décrire les changements dans la composition lipidique des œufs durant le développement embryonnaire en fonction de l'origine des femelles ainsi qu'en fonction des différents niveaux d'aD. À cette fin, des lots d'œufs produits par six femelles ont été suivis à partir de la ponte jusqu'à l'éclosion à des teneurs en 00 de 10,20,35,50 et 100 %sat. Au cours de cette étude les hypothèses testées sont (1) les faibles concentrations en 00 influencent le taux de survie, le développement embryonnaire et le succès d'éclosion des œufs du flétan du Groenland, (2) les faibles niveaux en 00 et l'origine des femelles induisent des changements au niveau de la composition lipidique des œufs du flétan du Groenland durant le développement embryonnaire.
CHAPITRE 1 INFLUENCE OF DIFFERENT LEVELS OF DISSOLVED OXYGEN ON THE SUCCESS OF GREENLAND HALIBUT (REINHARDTIUS
HIPPOGLOSOIDES) EGG HATCHING AND EMBRYONIC DEVELOPMENT
1.1 INTRODUCTION
Oxygen is necessary to sustain the respiration needs of all fishes and invertebrates (Lim et al. 2006). Over the last 50 years, no other environmental variable of ecological relevance to marine life has changed as dramatically-and as quickly-as dissolved oxygen (DO) (Diaz 2001). Low DO levels are responsible for reducing species abundance and distribution and causing fishery declines (Wu 2002; Breitburg et al. 2003). In the Estuary and Gulf of St. Lawrence (EGSL), oxygen concentrations in the deep waters (> 200 m) have decreased due to anthropic effects. Oxygen levels are now < 65%sat (percent saturation) in the gulf and < 35%sat in the estuary (Gilbert et al. 2005). These low DO levels could have a significant impact on deep-dwelling marine species. Greenland halibut (Reinhardtius hypoglossoides) is a commercially important flatfish species that lives at depths greater than 150 m in the EGSL. Fisheries and Oceans Canada (DFO) has reported that these fish are widely distributed throughout the EGSL and spawn in the deep waters of Laurentian channel (DFO 2006). These observations suggest that the Laurentian channel could be a main nursery for this species and that Greenland halibut may tolerate low levels of DO, with a probable lethal threshold level below 20-25%sat.
Despite the commercial importance of Greenland halibut, little is known about its
reproductive biology (Gundersen et al. 2001). Knowledge on the factors influencing reproduction and egg viability of Greenland halibut is still sparse. Eggs are bathypelagic
(Âdlandsvik et al. 2004), which increases the risk of exposure to low DO levels. Early
development of flatfishes such as the Greenland halibut has not been extensively
documented, the developmental stages for the embryonic period have been only partially
defined (Stene et al. 1999). Indeed, Stene et al. (1999) have used a very limited number of eggs samples from a single female. Moreover, in this experiment, only eight eggs achieved their ED and hatched. There have been no studies relating Greenland halibut embryonic development (ED) to abiotic or biotic factors such as temperature, DO, or egg quality.
Fish egg quality can be affected by maternai age and condition factor, timing of the
spawning cycle, overripening processes, genetic factors, and intrinsic properties of the egg
itself (Kj0rsvik et al. 1990; Bromage et al. 1992; Brooks et al. 1997). Kj0rsvik et al. (1990)
suggested that the assessment of cell symmetry at early cleavage stages (normal
blastomeres) might be a possible indicator of egg quality for marine fish and that this
criterion may be applicable for rapid egg quality assessment.
Lipids are considered to be one of the most important sources of stored energy in fish eggs. This is especially true for triacylglycerols (TAG), which are the most common form of energy storage in eggs as weil as in the later life stages of most marine fish (Cowey et al. 1985). For Greenland halibut eggs and many other marine species, phospholipids (PL) are the major lipids class. In species with lower T AG levels in the eggs, PL can also be a
9
source of energy during ED in addition to playing a role in membrane structure (Tocher et al. 1985; Fraser et al. 1988; Falk-Petersen et al. 1989; Rainuzzo et al. 1997).
The present study was undeliaken to assess the effects of low levels of DO (down to lO%sat) on the survival rate, ED, and hatching success of Greenland halibut eggs. In addition, we describe the changes in egg lipid composition depending on female origin as weil as changes occurring during ED in eggs exposed to different DO levels. Egg batches produced by individual females were followed from fertilization until hatching. We test the hypothesis . that the low levels of DO influence negatively the survival, embryonic development, and hatching success of Greenland halibut eggs. We suggest also the hypothesis that the lipid composition of Greenland halibut eggs during the embryonic development is modified not only by the low levels of DO, but also by the female origin.
1.2 MATERIALS AND METHODS
1.2.1 Fish sampling
Greenland halibut broodstock were obtained by longline fishing in the Gaspé area (48° 59' N; 64° 23' W; Quebec, Canada) in autumn 2009 at depths between 252 and 324 m. Fish (average length 52 ± 8 cm) were transported to the Maurice Lamontagne Institute (48° 27' N; 68° 32' W; Mont-Joli, Quebec, Canada) and kept in circular tanks with flow-through seawater at ~ 5°C and salinity 32. Fish were fed to satiation twice a week with a diet of capelin and shrimp.
1.2.2 Fertilization and incubation
Eggs from six females and sperm from one male were stripped manually from ripe fish in February and March 2010 as described by Jelmert et al. (1987). Females were selected by the swelling and redness of the genital pore and thickness of the abdomen. For each female, length, mass, and condition factor were estimated. Condition factor (K) is an index of condition, calculated as follows: K = [ Mass
lx
100. The better the condition ofLenght'
the fish, the higher the value of K (Fulton 1902). Both female and male fish were anaesthetized with a solution of metomidate (6 mg LOI) in a well-oxygenated bath of sea water (32-34 PSU) at 5°C with an added solution of Vidalife ™ (l ml per 10 L) as a water conditioner. Ali manipulations were carried out at low light intensity. Two or three samples of unfertilized eggs were first taken, weighed, and counted to estimate the fecundity of each female by the gravimetric method (extrapolation to the total wet-weight of released eggs). A wet fertilization method was used: ambient seawater and milt were mixed and added to the eggs at proportional volumes of 100: 1: 100, respectively.
1.2.3 Experimental design
Fertilized eggs from six females were used for the experiment. Equal proportions of total fertilized eggs from each female were randomly distributed in ten cone-shaped incubators (30 cm in diameter) representing two replicates of five dissolved oxygen level treatments (~ 800 eggs per incubator). DO lev el treatments consisted of two conditions of severe hypoxia (l0 and 20%sat; ~0.7 and 1.4 mgL\ two of moderate hypoxia (35 and 50%sat; ~2.4 and 3.5 mgL I) and one of normoxia (lOO%sat, ~6.9 mgLOI). Incubators (n=60) were placed in 10 circular tanks (diameter of 1 m) representing replicates of the different DO level treatments. Water circulation in each incubator was done using
Il
circulation pumps immersed in each tank. Seawater was circulated in each tank through external chillers to maintain the temperature at SoC; salinity was 32.4. The DO level in each tank was maintained using the experimental set-up developed by Plante et al. (1998). DO levels were measured by a polarographic O2 electrode (OxyGuard, model 420, Point Four Inc.) and controlled by a computerized system adjusting a bubbling mixture of air and nitrogen through a degassing column to maintain desired DO levels. Data from
polarographic O2 electrodes were validated weekly by the Winkler titration method. Stable DO levels were maintained for the whole incubation period using this experimental set-up. Kruskal -Wallis tests were applied to validate the stability of the different DO treatments and showed highly significant differences between each treatment (X2 := 37.46, dJ.
=
4, P < 0.01; Figure 1).100 80 60 40 20 0
l
' ....
.. ·
I
··
···
·I··
···
..
·
I··· ·
I
···
...
I
··· ..
± ...'
.:r
~---~--~--~--~--~---~---~ ~-~--~--r --~ -~--~--I ---.,:e... - ~-_:E-_:r- ___3:l
l
I l l Il
l
N C". '<:T V) \0 r- ex;~ ..:<: ...:oG ~ ..:.:: ...:oG ...:oG ~ (!) (!) (!) Il) (!) (!) (!) (!) ~ ?;! (!) ~ ~ ~ (!) ~
...
;$ ::; ::; ~ :$ Time (wcel\:) IO%sat 20%sat - - - 35%,sat - - - 50%sal ... IOO%satFigure 1. Weekly dissolved oxygen levels (percent saturation) in each treatment tank (mean
13
1.2.4 Egg samplings
Approximately 150-200 eggs from each female at 100%sat were randomly sampled after 24 h to determine fertilization success. At this time, embryos were at the 4- to 32-cell stage, and any egg observed with cel! division was considered as fertilized (Hansen et al. 2010).
Embryonic development was monitored on 10-25 eggs sampled in each incubator every 2-3 days. At each sampling time, egg samples were also stored in 1 mL of sterilized seawater at -80oe for lipid analysis and dry mass determination. Dry mass was determined by drying samples at 1l0oe for 48 h.
The experiment was conducted until hatching was completed in each incubator. Hatching rate (%) was estimated taking into account the number of dead, live, and eggs removed at each sampling.
N
Hatching success (0/0) = HL X 100 (Nto x fertilization success) - T ADE
N = Number of total hatched larvae HL
Nto = N
HL + number of de ad and alive eggs removed +number of sampled eggs
1.2.5 Laboratory analysis Developmental stages
Eggs and larvae were examined and digitized using a Leica MZ 75 system (Richmond Hill, Ontario, Canada). Digitized images were used to identify developmental stages and to measure egg diameter (mm) and larva length (mm) with Image ProPlus software 5.1 (Media Cybernetics, Silver Spring, MD, USA). We followed Shardo's method to define egg developmental stages, in which each stage is recognized on the basis of one or two landmark features (Shardo 1995). We also referred to the Hall et al. (2004) classification developed for Atlantic cod to identify developmental stages.
Lipid extraction and lipid c1ass analyses
Lipid extraction on egg samples was done according to Folch et al. (1957). Lipid classes were determined uSll1g an Iatroscan Mark-VI analyzer (Iatron Laboratories Ine., Tokyo, Japan). Lipid extracts were applied to Chromarods-SIII (Iatron Laboratories Inc., Tokyo, Japan) and developed in a four-solvent system (Parrish 1987; Parrish 1999). Chromatograms were analyzed using integration software Peak Simple 3.2 (SRI Ine). The separated lipid classes in this study were ketones (KET), triaeylglycerols (T AG), sterols (ST), acetone-mobile polar lipids (AMPL), and phospholipids (PL).
15
1.2.6 Definition of developmental stages
The embryonic development of Greenland halibut has never been fully described. EO was subdivided into nine periods: fertilization (EOl), cleavage (E02-ED8), blastula (E09-E011), gastrula (EOI2-E017), cephalization (EOI8-E021), neurulation (E022-E023), cranial regionalization (E024-E025), tail lift (prehatching period; EO PRE-H), and hatching (larva day-O) (Table 1). The stages between gastru lation and hatching encompassed the period of organogenesis.
EO proceeded with the formation of a small perivitelline space and subsequent meroblastic cleavage. The cleavage stage was characterized by many mitotic divisions; as long as the cleavage continued, the number of blastomeres increased and their size diminished and became less distinct (E08). At the blastula stage, cells became bound tightly together and the blastoderm highly flattened with uniform thickness (EO 11). The formation of the periblast was initiated at this stage.
The first epiboly movements characterized the end of this stage. At the gastrula stage, epiboly movements were predominant (expansion of the cellular blastoderm over the yolk). Major events during gastrulation included the formation of the thickened germ ring at the periphery of the blastoderm and the appearance of the embryonic shield. Ouring cephalization, the body axis became more clearly defined (E020). Neurulation occurred simultaneously with cephalization. From E022 to E023, the neural keel was present and projected ventrally into the yolk. Cranial regionalization was characterized by the continued
Table 1. Embryonic developmental stages in Greenland halibut. Embryonic development stages (ED) 2 3 4 5 6 7 8 Stage Fertilization Cleavage 1 Cleavage 2 Cleavage 3 Cleavage 4 Cleavage 5 Cleavage 6 Cleavage 7 No available Characteristics
Perivitell ine space appears; cytoplasm streams toward animal
pole
image 2 cells-Meroblastic cleavage 4 equal cells
8 ceUs in 2 paraUel rows
16 ce Us
32 cells; cells start to compact
~ 64 cells
9 10 Il 12 13 14 15 16 17 18 Blastula (early) Blastula (mid) Blastula (late) Gastrula (30% Epiboly) Gastrula (50% Epiboly) Gastrula (70% Epiboly) Gastrula (80% Epiboly) Gastrula (90% Epiboly) Gastrula (late) Cephalization ( early) No image available 17
Cells become bound tightly together
Blastodisc with the surrounding periblast
Blastoderm highly flattened with uniform thickness
Germ ring and embryonic shield are visible
Blastoderm covers 45-50% of the embryo. "Lem on wedge shape"
"Kidney bean" shape
The blastodenn covers 80% of the
embryo. "Crescent shape" First indication offold appearing where body axis will lie
Body axis fonning
Body axis formed, blastopore is large.
19 20 21 22 23 24 25 PRE-H H-O Cephalization ( early) Cephalization (mid) Cephalization (Jate) Neurulation ( early) Neurulation (Jate) Cranial
regionalization Cranial regional ization
Taillift
Larva day-O
Blastopore closing but not completely
Closed blastopore. First signs of somites. The body axis becomes more clearly defined.
Embryo length increases but it is lower than egg diameter
Embryo is longer than egg diameter. Beginning of development of optic vessicles The head region is broader and thicker than the tail region. First signs of fins
Embryo gets longer. Appears a structure at the back of developing embryo
Embryo gets longer. Optic vesicles are more prominent
Embryo gets longer. Sometimes tail is outside the egg
Embryo at early developmental stage, without pigmentation
19 emergence of craniofacial structures; in this stage, optic vesicles were more prominent. Tail lift refers to the separation of the tail from the yolk; it begins when the most posterior
portion of the trunk detaches from the yolk at ED PRE-H.
1.2.7 Statistical analyses
Analysis of variance (ANOV A)
Statistical analyses were performed using SPSS 16.0. All percentage data were arcsine-transformed and normality was tested using both Kolmogorov-Smirnov and Shapiro-Wilk tests. Homogeneity of variance was tested with Levene' s test. If necessary, data were transformed (log or arcsine square-root; lipid classes are in %) to achieve homogeneity of variances. Statistical significance was set at a
=
0.05. A two-way analysis of variance (ANOY A) was used to estimate the effects of DO and female origin on hatching success. A one-way ANOY A was conducted to test the effect of female origin on total lipid content and lipid classes in eggs 7 days post-fertilization that had been incubated at 100%sat. Finally, a two-way ANOY A was used to test the effects of DO 1evel and female origin on totallipid content and lipid classes for days 14, 17, and 21.Multinomial Logistic regression and decision tree analysis
To test the effect of DO and female origin on the early developmental stages of Greenland halibut eggs, a three-way contingency table was analyzed by a Multinomial Logistic regression (MLogit). This model has the same conceptual basis as a log-linear
model, which is an extension of multiway contingency tables, where the conditional relationship between two or more variables is analyzed by taking the natural logarithm of the cell frequency within the contingency table (Bishop 1969; Shelby 1973). The variables investigated by log-linear models are aIl treated as «response variables», with no distinction between independent and dependent variables (Agresti et al. 1996; Brant 1996). We used the MLogit regression instead: embryonic developmental stage (days 7, 10, 14, 17, and 21) was treated as a dependent variable and DO and female origin as independent variables. MLogit is based on the principles of Bayesian statistics and likelihood ratio; it replaces the familiar classic least-squares linear statistical mode!. Significance tests proceed from the likelihood ratio G2
where Ou and
T;
j
are respectively the observed and theoretical frequencies in each ceIl of the contingency table.Decision tree analysis was used in conjunction with MLogit models to interpret the results. Although decision tree analysis is a powerful predictive model (Zhao 2007), it was used here for a descriptive purpose. We used a X2 test to select discriminate variables (p <
0.05) (Singh et al. 2009). In tree structure, leaves represent classifications and branches represent conjunctions of features that lead to those classifications (Rudolfer et al. 1999).
Female 2 3 4 5 6 21 1.3RESULTS 1.3.1 Physiological variables
Females used in the experiment had lengths and masses between 48.5 and 65 cm and 875 and 2519 g, respectively. Fulton's K varied between 0.73 and 0.92 with the highest value observed for female 3. Relative fecundity was higher in females with lower condition factor while fecundity varied between 10752 and 24194 eggs per fish (Table 2).
Table 2. Length, mass, condition factor, fecundity, relative fecundity, and period of fertilization for the six Greenland halibut females used in the experiment. No data are presented for female 5.
Length (cm) Mass (g) Condition factor Fecundity (no. Relative Period of (K = Mass x 100) eggs fish· l ) fecundity fertilization Length3 (no. eggs g-I) in 2010 (dd-mm) 48.5 874.5 0.77 10752.3 12.2 24-02 50.7 951.7 0.73 13426.0 14.1 22-02 65.0 2519.3 0.92 24194.8 9.6 25-02 55.7 1483.6 0.86 15966.8 10.7 02-03 08-03 49.1 978.8 0.83 13012.0 13.3 18-03
1.3.2 Hatching rates
On average, eggs hatched 28 days after fertilization. Hatch rate was significantly affected by the interaction between DO level and female origin (F (12, 20)
=
12.83, p <0.0001; Figure 2). The time to hatch was not significantly different between different DO levels and females. Higher hatch rates were observed for female number 3 (around 40%). For this female, hatch rates were not significantly different at 20, 35, 50, and lOO%sat. No eggs hatched at 10%sat for any female. Eggs from two females (2 and 6) did not hatch at any DO level (Figure 2).
23
50
ar:==:J
female 1 ~ female3 ~ female4 a l88888S female 540
a a--
~ ::>---
'"
'"
QJ30
<J <J :='"
en=
..c:20
(,1 be....
~ b ::I: be10
o
100
50
3520
Dissolvcd Oxygcn CYosat)
Figure 2. Mean hatch rates for Greenland halibut embryos obtained from four females and exposed to five levels of dissolved oxygen (DO) [mean ± SD]. Different letters indicate statistically significant differences between treatments (female origin x DO levels) (p < 0.0001). No data are presented for lO%sat because no eggs hatched at this level.
1.3.3 Early development
Fertilization rates of the different females varied between 42 and 95% and the
proportion of eggs with normal blastomeres varied between 17 and 47% (Table 3). Normal
blastomeres were regular in size and shape (Figure 3A), while abnormal blastomeres were
identified by irregular cell shape (asymmetry) (Figure 3B), unequal cell size (Figure 3C),
incomplete cell margins, or incorrect cell numbers (Figure 3D). Eggs from females 2 and 6, which did not hatch, had the lowest percentages of fertilization and normal blastomeres, i.e., 42%-71 % fertilization and 17%-18% normal blastomeres. Eggs from female 3, from
which we observed the highest hatching rate, had high percentages of fertilization and normal blastomeres.
25
Table 3. Percentages of fertilization and normal blastomeres obtained for each of the six females used in the experiment.
Female number % Fertilization % Normal blastomeres
l
84
26
2
42
17
395
47
4
9227
5
89
33 671
18
Figure 3. Greenland halibut blastomeres at the 8-cell stage. (A) Normal blastomere cleavage; abnormal: (B) asymmetrical cell positioning, (C) unequal cell sizes, (D) cel! margins poorly defined.
27
1.3.4 Variations in embryonic developmental
Multinomial Logistic regression (Mlogit) analyses showed that in the first 10 days of development, significant differences in developmental stages were largely explained by female origin (Table 4). On days 14, 17, and 21, both factors had significant effects on ED, with increasing importance of DO. On day 24, DO had a larger influence on ED than female origin.
In addition to Mlogit analyses, we used decision tree analysis to illustrate the variation in the proportion of eggs at different developmental stages in relation to DO and female origin. On day 10, the first summit was segmented in eggs from some females (Figure 4). ED of eggs from females l, 2, 5, and 6 were not significantly different while those from females 3 and 4 differed from the others, with 84.0% of the eggs at ED 19 and 62.1% at ED20, respectively. On day 24 (toward the end of ED), the first summit was segmented depending on DO levels (Figure 5). At lO%sat, 100% of the eggs were at ED20, regardless of female origin. For the other DO levels (20,35,50, and 100%sat), 59.7% of eggs from female 3 were at the same developmental stage (ED PRE-H). However, for the other females
Cl,
2,4, and 5), 66.0% of the eggs were at ED24 in DO levels corresponding to 20 and 35%sat while 6l.5% of the eggs were at ED25 for both 50 and 100%sat, indicating a slower development rate at 20 and 35%sat for these females.Table 4. Summary of Multinomial Logistic regression (MLogit) tests on the variations in embryonic developmental of Greenland halibut eggs sampled on days 7, 10, 14, 17,21, and
24 as a function of female origin and dissolved oxygen (DO) levels.
Oays of Effect d.f. G2 Probability
embryonic development 7 Female origin 20 904.67 < 0.001 DO 16 124.66 < 0.001 10 Female origin 5 50.10 < 0.001 DO 4 5.36 0.252 14 Female origin 10 328.35 < 0.001 DO 8 210.76 < 0.001 17 Female origin 20 474.76 < 0.001 DO 16 457.08 < 0.001 21 Female origin 20 396.60 < 0.001 DO 16 390.79 < 0.001 24 Female origin 12 127.34 < 0.001 DO 12 252.60 < 0.001
1 1256 " Node 1 Categmv % n ED19 56,7 234 EDlO 43,3 179 Total 67,0 413 ED Node 0 Categmy % n ED19 58,0 357 ED20 42,0 259 Total 100,0616 1 Females Improvement
=
0.02 3 1 Node 2 Category % n ED19 84,0 84 ED20 16,0 16 Total 16,2 10029
1 4 1 Node 3 Category % n ED19 37,9 39 ED20 62,1 64 Total 16,7 103Figure 4. Classification tree for day 10 of embryonic development (ED). The first summit is segmented depending on the factor «female origin».
1 3 1 ED Node 0 Category % n ED20 14,1 38 ED24 24,2 65 ED25 38,3 103 PRE-H 23,4 63 Total 100,0 269 DO levels Improvement
=
o.
12 1 1 100; 50t 35; 20 10 1 Node 1 Node 2 Category % n Category % n ED20 3,3 8 ED20 100,0 30 ED24 27,2 65 ED24 0,0 0 ED25 43,1 103 ED25 0,0 0 PRE-H 26,4 63 PRE-H 0,0 0 Total 88,8 239 Total 11,2 30 Fema1es Improvement = 0.05 ! 1 1· 2· 4· 5 , '1 ' Node 3 Node 4 Category ED20 ED24 ED25 PRE-H Total V. n 0,0 0 6,0 4 34,3 23 59,7 40 24,9 67 1 100· r Categorv V. n ED20 4,7 8 ED24 35,5 61 ED25 46,5 80 PRE-H 13,4 23 Total 63,9 172 DO levels Improvement = 0.06 1 50 35· 20 '1 Node 5 Node 6 Categorv V. n Category V. ED20 0,0 0 ED20 16,0 ED24 23,0 28 ED24 66,0 ED25 61,5 75 ED25 10,0 PRE-H 15,6 19 PRE-H 8,0 Total 45,4122 Total 18,6 n 8 33 5 4 50Figure 5. Classification tree for day 24 of embryonic development (ED). The first summit
31
1.3.5 Lipid c1ass analyses
Total lipid content and, KET, AMPL, PL, T AG differed significantly according to
female origin for eggs incubated at 100%sat on day 7 (F (5,17) totallipids = 3.22, F (5,17)
KET= 10.93, F (5,17) AMPL= 3.75, F (5,17) PL= 2.93, and F (5,17) TAO = 5.l1,p < 0.05;
Figure 6). The concentration of total lipids in the eggs of female 2 was significantly lower
(133.84 ug mg" 1 DW) than in female 1 (237.34 ug mg-I DW) (Figure 6). Significant
differences in the percentage of PL were observed between females. However, pair-wise
comparisons did not allow the detection of differences between individu al females. PL
constituted the major lipid class, with mean values representing 71 to 83% of totallipids.
TAG represented 8.7% of total lipids in eggs from female 3, which was significantly
different from percentages found in the eggs of females l, 4, and 5
«
6%) (Figure 6). Theproportions of KET and AMPL in eggs from female 2 represented 5% and 15% of the total
lipids, respectively. These proportions were significantly higher than in those from the
other females. Lipid classes in the eggs of females 1, 3, and 5 incubated at the different DO
levels (excluding the 50%sat level) were determined for days 14, 17, and 21. On day 14,
significant differences in total lipids, PL, and KET percentages were observed only in
relation to female origin (F (2, 12)total lipids = 9.32, F (2, 12)PL = 4.87, and F (2, 12kET =
15.70, P < 0.05; Table 5). The concentration of total lipids in eggs from female 5 was
significantly lower than in those of females 3 and 1 (Table 5). PL and KET were the major
lipid classes present in eggs, with mean values of 77% and 5% of total lipids, respectively.
350 10 a a 300 ~ 250 Cl -;-01) E ZOO 00 2-v. ISO -0 ëi... ab ab b ab
l
ab ..::r: 8 ~ -Cl ]-"El 6 2 ... 0S-
4 ab a b b b 0 G 100 0 f-« f-2 50 0 0 2 3 4 5 6 2 3 4 5 6 Female Female 8 20 a 18 a ~ ô if. -0,S_
b ab b 16 U') -0 14 : ë-0;E
4 ... 0 ~ f-t.Ll ~ 2 ab ab -:§ 12 2 ... 0 JO ~ 8 ...l 0... 6 ~ « ab b b b b 4 2 () 0 2 4 5 6 2 3 4 5 6 Fernale FemaleFigure 6. Changes in totallipid content and proportions of triacylglycerols (TAG), ketones (KET), and acetone
-mobile polar lipids (AMPL) in Greenland halibut eggs from different females on day 7 of embryonic development for eggs incubated at 100%sat in dissolved oxygen (DO) [mean ± SD]. Different letters indicate signiftcant differences among females
C
P
< 0.05).33
Table 5. Variations in total lipid contents and proportions of ketones (KET) , triacylglycerols (TAG) , and phospholipids (PL) from Greenland halibut eggs from females exposed to different dissolved oxygen (DO) levels on days ] 4, 17, and 21 (mean ± SD). Different letters indicate significant differences (p < 0.05).
Female Day DO level Totallipids (flg mg-1
dry KET (%) TAG (%) PL(%)
weight) 100%sat 309.68± 135.70a 3.06 ± 0.13a 1.78 ± 0.50a 83.51 ± 2.70a 3S%sat 665.53 ± 58.07a 3.40 ± 1.40a 1.57 ± 0.38ab 85.48 ± 2.42a 14 20%sat 378.17 ± 84.94a 2.9± 1.41a 2.14 ± 0.82ab 84.13 ± 7.77a 10%sat 427.99 ± 165.49a 4.79 ± 2.34a 2.33 ± 1.97b 75.99 ± 3.46a 100%sat 514.72± 192.65a 3.42 ± 0.57a 3.32 ± 0.92a 80.92 ± 0.50ab 3S%sat 561.98 a 4.75 a 1.93 ab 52.77 ab 3 14 20%sat 497.71 a 3.35 a 2.08 ab 78.32 ab 10%sat 311.33 ± 75.23a 2.52 ± 1.12a 0.71 ± 0.16 b 86.66 ± 6.85ab 100%sat 179.35± 102.53b 9.11 ± 3.40 b 2.92 ± 1.08a 69.53 ± 14.37b 3S%sat 317.69± 153.53b 7.12±2.26 b 1.13 ± 0.27 ab 78.09 ± 7.22b 5 14 20%sat 240.35± 81.19b 7.38 ± 0.63b 1.51 ± 0.09ab 65.95 ± 8.28b 10%sat 175.58± 7.79b 7.61 ±0.16 b 1.93 ± 0.03 b 65.67 ± 0.87b 100%sat 380.27 ± 13.25abe 3.66 ± 0.96 be 2.27 ± 0.94a 84.65 ± 0.19ab 3S%sat 264.77 ± 100.69be 6.96 ± 4.25abe 2.95 ± 1.19a 74.01 ± 15.42abe
17 20%sat 493.76 ± 30.86ab 5.10 ± 0.48abe
1.36 ± 0.03a 82.04 ± 2.42abc
10%sat 872.42 ± 92.82a 2.35 ± 0.07c 0.69±0.16a 90.94 ± 1.40a
100%sat 864.81 ± 90.33a 4.65 ± 0.13abc 0.75 ± 0.09a 82.08 ±O.92abc 3S%sat 502.38 ± 47.46ab 2.90±0.61c 2.11 ± 1.90a 87.04 ± 0.57ab 3 17 20%sat 457.09 ± 100.99ab 5.74 ± 2.15abc 4.07 ± 0.96a 75.05 ± Il.41 abc
100%sat 134.98 ± 10.89c 10.87 ± 1.56a 4.12 ± 1.56a 57.24 ±1.64c 35%sat 266.73 ± 30.56bc 9.96 ± l.25a 1.67 ± 0.62a 75.18 ± 0.70abc 5 17 20%sat 258.35 ± 100.07bc 12.03 ± 3.54a 2.39 ± 1.34a 66.54 ± 7.29bc 10%sat 452.32 ± 69.29ab 2.34 ± 0.19abc 1.02 ± 0.30a 86.21 ± 0.47ab Day 21 100%sat 682.68 ± 23.99abc 3.18±0.15 b 1.12 bc 87.11 ± l.85a 35%sat 247.09 ± 31.07bc 5.80 ± 0.67ab 3.99 ± 0.39abc 81.68±2.143 21 20%sat 258.66 ± 13.10bc 4.50 ± 0.60 ab 2.9 ± 0.42abc 80.02 ± 2.92a 10%sat 221.52bc 7.85abc 5.38ab 69.08a 100%sat 915.94 ± 260.70a 5.81 ± 0.60 ab 1.31 ± 1.l3 bc 78.88 ± 7.94a 35%sat 217.75 ± 97.89c 10.11 ± 5.63a 5.05 ± 1.25a 62.91 ± 20.26a 3 21 20%sat 709.40 ± 71.54 abc 4.96 ± 0.58ab 0.8 ± 0.08c 80.53 ± 5.08a 10%sat 18l.12abc 6.12± 1.71 ab 2.84±2.14abc 76.39 ± 7.68a 100%sat 477.20 ± 55.67abc 6.65 ± 0.95ab 1.26 ± 0.09bc 74.67 ± 1.27a 35%sat 1031.66 ± 234.56a 3.65±0.16 b 0.60c 88.46 ± 0.32a 5 21 20%sat 717.75 ± 122.28abc 5.29 ± 0.36 ab 0.56 ± 0.09c 82.91 ± 0.693 10%sat 267.36 ± 28.05bc 4.57 ± 0.60ab 0.94 ± 0.83c 86.71 ± 2.083
35
they had the highest proportion of KET (Table 5). TAG varied only according to DO (F (3, 12hAG
=
4.43, p <0.05; Table 5) and contributed only ~ 2% of the eggs' totallipids. TAG percentage was significantly higher in eggs incubated at 100%sat than in those incubated at lO%sat. On days 17 and 21, significant interactions
between DO levels and female origin were observed in percentages of totallipids, PL, KET, and TAG (day 17: F (6, l2)totallipids
=
6.39, F (6, 12)PL=
3.53, F (6, 12)KET=
5.64, and F (6, 12hAG=
3.50, P < 0.05; day 21: F (6, Il )total lipids=
4.65, F (6, Il)PL=
3.09, F (6, II)KET=
4.65, and F (6, IlhAG=
4.29, p < 0.05; Table 5). The only clearpattern was observed at day 21 for the lO%sat DO level, where a significant decrease of total lipids was observed.
1.4 DISCUSSION
1.4.1 Hatching and embryonic development
Greenland halibut eggs were highly tolerant to hypoxia, with hatching occurring at levels as low as 200/0sat. Similar tolerance levels have also been observed for Atlantic halibut (Helvik et al. 1993). In our experiment, no Greenland halibut eggs hatched at
severely hypoxic conditions (lO%sat). These results indicate that the threshold level of
environmental oxygen concentration below which no hatching will occur is between lO and 200/0sat (0.7 mgLI and 1.4 mgL1) for this species. In the black bream (Acanthopagrus butcheri), this threshold level has been observed at 300/0sat (2.1 mgL1
) (Hassel! et al.
2008). However, we found that hatch rates varied according to both DO level and female
origin, which could suggest that hypoxia levels over lO%sat cou Id induce selective
pressure.
In some species, hypoxia can act to initiate hatching. For example, eggs of whitefish
(Coregonus lavaretus) and vendace (C. albula) exposed to hypoxia responded with precocious hatching (Czerkies et al. 2002). Early hatching has also been observed in two
freshwater salmonids (Coregonus lavaretus and Coregonus albula) in response to low DO levels, and the incidence increased as the duration hypoxia exposure increased (Czerkies et al. 2002). In some species, like rainbow trout (Oncorhynchus mykiss), hypoxia seems to
affect hatching regulation, resulting in delayed or advanced hatching (Ciuhandu et al. 2005). Species experiencing precocious hatching in response to hypoxic conditions are known to be the less tolerant ones (Oppen-Berntsen et al. 1990). In fact, precocious
37
hatching is considered as an extreme reaction that enables embryos to escape from
unfavorable oxygen conditions, and premature hatching of hypoxic embryos may therefore enhance access to oxygen (Mills et al. 1999; Czerkies et al. 2002). Our results indicate that
hypoxic conditions did not postpone the time of hatching in Greenland halibut eggs. No
significant differences in time to hatch between severe hypoxic (20%sat), moderate
hypoxic (35 and 50%sat), and normoxic conditions (lOO%sat).
Although hypoxia did not impair survival to hatching for eggs incubated at low DO levels such as 20, 35, and 50%sat, it is quite possible that it may cause high mortality and
malformations in post hatch larvae. However, this was not examined in our study and
would need further investigations.
Egg hatching is a complicated process that involves eggshell components, hatching enzymes, egg origin, and general embryonic development (Oppen-Berntsen et al. 1990).
The assessment of ED in the present study demonstrated that developmental stages varied, mainly depending on female origin at the beginning of embryogenesis. The DO effect
started to become important 17 days after fertilization. We suggest that this phenomenon could be explained by the low oxygen demands of early embryos, which limited the
response to low oxygen concentrations, and to a cumulative effect of hypoxic conditions on
ED through time (Oppen-Berntsen et al. 1990). Moreover, because oxygen consumption by
the embryo increases with development, embryos may experience hypoxia in more advanced stages (Hamdorf 1961; Rombough 1988; Oppen-Berntsen et al. 1990). At lO%sat, al! Greenland halibut embryos were at the same embryonic stage (ED20) from 17
days post-fertilization regardless of female origin, indicating a significantly slower developmental rate than at 20, 35, 50, and 100%sat. ED was impaired by severe hypoxia OO%sat); embryos were less developed, resulting in a lack of cephalization and an absence of the normal processes that occur later in the gastrula period. At 21 days post-fertilization, ED appeared normal at 20 and 35%sat but it was still slower than at 50 and 100%sat.
Effects of female origin confirmed the important role of egg quality tO\,vard the end of ED. Other studies have reported that hypoxia decreases development rate and impairs egg growth in many other organisms, including fishes (Davenport 1983; Malcolm et al. 2003) and invertebrates (Chaffee et al. 1984; Lutz et al. 1992; Strathmann et al. 1995).
1.4.2 Characterization of Greenland halibut eggs and Iipid c1ass dynamics
On day 7 following fertilization, totallipids in Greenland halibut eggs accounted for 16.4 ± 3.2% of the dry weight, with the highest (23.7 ± 7.0% of the dry weight) and lowest 03.4 ± 3.4% of the dry weight) levels in females 1 and 2, respectively. Greenland halibut eggs have high lipid content mainly made up of phospholipids, with a mean value of 77.6 ± 4.3% of totallipids. Fish eggs can be classified into different energetic categories according to their lipid characteristics (Mourente et al. 1996). The presence or lack of an oil globule corresponds to eggs with high (> 15% of egg dry weight) or low
![Fig ure 2. Mean hatch rates for Greenland halibut embryos obtai ned from four females and exposed to five levels of dissolved oxygen (DO) [me an ± SD]](https://thumb-eu.123doks.com/thumbv2/123doknet/7530677.227565/42.915.157.788.208.666/greenland-halibut-embryos-females-exposed-levels-dissolved-oxygen.webp)
![Table 5. Variations in total lipid contents and proportions of ketones (KET) , triacylglycerols (TAG) , and phospholipids (PL) from Greenland halibut eggs from females exposed to different dissolved oxygen (DO) levels on days ] 4, 17, a](https://thumb-eu.123doks.com/thumbv2/123doknet/7530677.227565/52.915.99.826.335.974/variations-contents-proportions-triacylglycerols-phospholipids-greenland-different-dissolved.webp)
