READ THESE TERMS AND CONDITIONS CAREFULLY BEFORE USING THIS WEBSITE. https://nrc-publications.canada.ca/eng/copyright
Vous avez des questions? Nous pouvons vous aider. Pour communiquer directement avec un auteur, consultez la première page de la revue dans laquelle son article a été publié afin de trouver ses coordonnées. Si vous n’arrivez pas à les repérer, communiquez avec nous à [email protected].
Questions? Contact the NRC Publications Archive team at
[email protected]. If you wish to email the authors directly, please see the first page of the publication for their contact information.
Access and use of this website and the material on it are subject to the Terms and Conditions set forth at High sensitivity lithium fluoride as a detector for environmental dosimetry
Davis, S.D.
https://publications-cnrc.canada.ca/fra/droits
L’accès à ce site Web et l’utilisation de son contenu sont assujettis aux conditions présentées dans le site LISEZ CES CONDITIONS ATTENTIVEMENT AVANT D’UTILISER CE SITE WEB.
NRC Publications Record / Notice d'Archives des publications de CNRC:
https://nrc-publications.canada.ca/eng/view/object/?id=0c05fe47-ff54-471c-a5d4-cee1a50d3c8e https://publications-cnrc.canada.ca/fra/voir/objet/?id=0c05fe47-ff54-471c-a5d4-cee1a50d3c8e
High Sensitivity Lithium Fluoride
As a Detector for Environmental Dosimetry
(M.Sc. Thesis)
S. D. Davis
January, 2003
PIRS-0832
Ionizing Radiation Standards
Institute for National Measurement Standards
National Research Council
Ottawa, Ontario, K1A 0R6
Telephone: 613-993-2197
Fax: 613-952-9865
HIGH SENSITIVITY LITHIUM FLUORIDE
AS A DETECTOR FOR ENVIRONMENTAL DOSIMETRY
by
STEPHEN D. DAVIS, B.Sc.
Medical Physics Unit McGill University, Montreal
January 2003
A thesis submitted to McGill University in partial fulfilment of
the requirements for the degree of Master of Science
Abstract
A new thermoluminescence dosimetry system for environmental applications was tested, which used high sensitivity lithium fluoride (TLD-100H). The energy response of the bare thermoluminescence dosimeters (TLDs) was measured for photon beams with mean energies from 24 keV to 1.1 MeV, and the results were compared with standard lithium fluoride (TLD-100). The energy response was also measured for TLD-100H card-mounted dosimeters encapsulated in Teflon®, used as part of the Harshaw Type 8855 environmental dosimeter. The EGSnrc Monte Carlo system was used to calculate the dose to the TLDs in both the bare chip holder and the 8855 dosimeter, in order to calculate the thermoluminescence per unit of absorbed dose to the TLDs. The results were broadly consistent with existing data, with the response of both TLD materials correlating with the ionization density of the photon beams.
Résumé
Un nouveau système de dosimétrie par thermoluminescence pour les applications environementales, utilisant du fluorure de lithium à haute sensitivité (TLD-100H), fut évalué. La réponse énergétique du dispositif thermoluminescent (DTL) fut mesurée pour des faisceaux de photons d’énergie moyenne entre 24 keV et 1.1 MeV, et les résultats furent comparés au fluorure de lithium conventionel (TLD-100). La réponse énergétique fut également mesurée pour des dispositifs TLD-100H encapsulés de Teflon®, faisant partie du dosimètre environemental Harshaw Type 8855. Le système de Monte Carlo EGSnrc fut utilisé pour estimer la dose fournie aux DTL dans le support simple ainsi qu’intégrés au dosimètre 8855, dans le but de calculer la thermoluminescence par unité de dose absorbée par le DTL. Les résultats furent largement en accord avec les données existantes, la réponse des deux matériaux DTL démontrant une corrélation avec la densité d’ionization des faisceaux photoniques.
Acknowledgements
I would first like to acknowledge my thesis supervisor, Dr. Carl Ross, for his invaluable assistance and direction throughout the course of my research. I would also like to acknowledge John Chase and Ontario Power Generation for the financial support and research materials necessary for the project, as well as for providing the initial incentive to pursue this area of research.
In addition I would like to thank Dr. Paul Mobit for providing the resources to run the Monte Carlo simulations, and to Dr. Jan Seuntjens and Fadi Hobeila for providing the file of updated photon cross sections.
I would also like to acknowledge all of the staff in the Ionizing Radiation Standards group at the National Research Council. Dr. Len van der Zwan and Hong Shen provided assistance with the x-ray irradiations, Stewart Walker assisted with electronics issues, David Marchington constructed most of the irradiation apparatus used in this work, and Feridoun Farahvash provided support for computing issues. Dr. Ken Shortt helped arrange the project and remained in contact from his new position in Vienna.
Finally, I would like to thank the staff at Saint-Gobain Crystals and Detectors for providing some of the data and software used in this work, and John Pyatt at Ontario Power Generation for his work on the initial stages of the project.
Contents
1 Introduction 1
1.1 Measurement Quantities... 5
1.2 Guide to the Thesis... 7
2 Bare Chip Energy Response Measurements 9 2.1 Introduction ... 11
2.2 Materials and Methods ... 11
2.3 Results and Discussion... 17
2.4 Conclusions ... 24
3 Bare Chip Monte Carlo Calculations 25 3.1 Introduction ... 27
3.2 Background on EGSnrc... 30
3.3 Materials and Methods ... 31
3.3.1 Replacement of default photoelectric cross sections... 31
3.3.2 Creation of materials using PEGS4... 32
3.4 Results and Discussion... 39
3.4.1 Validation of phantom model... 39
3.4.2 Dose calculation results... 44
3.4.3 TLD dose response ... 48
3.5 Conclusions ... 60
4 Energy Response for Harshaw Type 8855 Environmental Dosimeter 61 4.1 Introduction ... 63
4.2 Materials and Methods ... 63
4.2.1 TLD specifications ... 63
4.2.2 Time-temperature profile and glow curve analysis ... 63
4.2.3 Photon energy response measurements... 74
4.2.4 Monte Carlo simulations of the 8855 dosimeter ... 75
4.3 Results and Discussion... 76
4.3.1 Residual signal subtraction algorithm ... 76
4.3.2 Photon energy response results ... 76
4.3.3 Monte Carlo simulation results ... 81
5 Summary and Conclusions 87
5.1 Summary of Results ... 89 5.1.1 Chapter 2: Bare Chip Energy Response Measurements ... 89 5.1.2 Chapter 3: Bare Chip Monte Carlo Calculations ... 89 5.1.3 Chapter 4: Energy Response for Harshaw Type 8855 Environmental
Dosimeter ... 89 5.2 Future Work and Conclusions... 90
List of Figures
2.1 Temperature of the quartz tray during the 240°C anneal ... 14
2.2 Phantoms used for the TLD irradiations ... 16
2.3 Typical glow curves for TLD-100 and TLD-100H ... 18
2.4 Typical set of air kerma response measurements ... 20
2.5 Linearity of TLD-100H in Harshaw Model 6600 hot gas reader ... 21
2.6 Air kerma response measurements for TLD-100 and TLD-100H ... 23
3.1 Calculated absorbed dose in LiF per unit air kerma as a function of photon energy ... 29
3.2 Model of phantom used for Monte Carlo calculations ... 36
3.3 Calculated dose to the TLD as a function of phantom radius ... 40
3.4 TL response as a function of PMMA front wall thickness... 42
3.5 Measured TL response from Shortt et al (1997) per unit calculated dose ... 43
3.6 DTLD / Ka for TLD-100 and TLD-100H... 47
3.7 Dose response for TLD-100 and TLD-100H ... 50
3.8 TLD-100 results compared with Tochilin et al (1968) ... 51
3.10 Electron spectra from FLURZnrc from the N-60 and N-100 beams ... 57
3.11 Mean electron energy and L ρcoll as a function of the mean photon energy of the incident beams ... 58
3.12 Dose response as a function of L ρcoll for TLD-100 and TLD-100H... 59
4.1 Typical glow curves for TLD-100H using the Harshaw Model 6600 hot gas reader ... 65
4.2 Typical re-read signal after a delivered air kerma of 2 mGy ... 66
4.3 Outlier removal algorithm ... 70
4.4 Identification of characteristic points in the subtraction algorithm... 72
4.5 Glow curve subtraction region and net glow curve... 73
4.6 Measured background as a function of the previous air kerma... 77
4.7 Glow curve from environmental background of ~3 mGy for a TLD with residual signal from a 900 mGy irradiation. ... 78
4.8 Air kerma response measurements for the 8855 dosimeter ... 80
4.9 Air kerma response measurements for the 8855 dosimeter conducted by SGC&D ... 82
4.10 Monte Carlo calculated energy response in the 8855 dosimeter for Elements 1 (copper) and 4 (tin)... 83
4.11 Monte Carlo calculated energy response in the 8855 dosimeter for Element 3 (Mylar® window)... 85
List of Tables
2.1 Air kerma response measurements for TLD-100 and TLD-100H ... 22 3.1 Composition of materials used in Monte Carlo simulations ... 34 3.2 Results of Monte Carlo simulations using XCOM photo-absorption cross
sections ... ... 45 3.3 Results of Monte Carlo simulations using Storm and Israel photo-absorption
cross sections ... ... 46 3.4 Dose response for TLD-100 and TLD-100H ... 49 4.1 Air kerma response measurements for the 8855 dosimeter... 79
Chapter 1
Introduction
Environmental dosimetry is the process of assessing radiation doses to members of the public around nuclear and radiological facilities (Klemic et al 1999). Environmental dosimetry programs can cover external and internal radiation exposures, and are normally required for the facility to demonstrate compliance with national regulations on dose limits to the public. Environmental dosimeters used for external radiations are generally used to measure the doses received from γ-rays or x-rays, and can also have the capability to measure beta doses or neutron doses arising from cosmic rays.
The dosimeters can be either active or passive devices, with some facilities employing more than one monitoring technique. Although active devices such as area monitors and electronic personal dosimeters are often used within a facility, passive systems are usually preferred for environmental applications because of their ease of deployment and the minimal maintenance required. Since the 1960s, thermoluminescence dosimeters (TLDs) have been used for environmental dosimetry applications, with the early systems using lithium fluoride (LiF) TLDs (Cusimano et al 1968).
Thermoluminescence (TL) is thermally stimulated light emission from an insulating material that has been exposed to ionizing radiation, and is a property of many natural minerals. Ionizing radiation can create electron-hole pairs in TL materials, which can either recombine or can become trapped at defects in the crystal structure. These trapped charge carriers are in a metastable state, and can be released by heating the material. The released charge carriers can then recombine, with an associated emission of light. By calibrating the amount of light released from the TLD after a known dose of ionizing radiation, the TL material can then possibly be used as a radiation dosimeter. The suitability of a given TL material for radiation dosimetry depends on a number of factors, including dose linearity, energy dependence, fading characteristics, and stability. Horowitz (1984a) presents a historical background and a more detailed description of the TL mechanism.
After initial research into LiF TLDs in the early 1960s at the University of Wisconsin, the Harshaw Chemical Company became the first commercial supplier of TLDs for radiation dosimetry, with the phosphor known as TLD-100 (Cameron 1970). The dopants present in the phosphor are necessary for desirable thermoluminescence (TL) properties, and TLD-100 denotes
LiF TLDs are adequate for a wide range of applications at nuclear and radiological facilities, and are also used as radiation detectors in clinical dosimetry. For environmental applications the dose rates are generally very low, so several alternative TLD materials have been investigated that have much higher sensitivity than TLD-100. These phosphors include calcium sulphate (CaSO4), calcium fluoride (CaF2), and aluminium oxide (Al2O3), and each of these materials can
be doped with different compounds to produce different dosimetric properties. The phosphors have photon sensitivities from 10 to 30 times greater than standard LiF, but the presence of higher atomic number elements make the dosimeters less tissue equivalent than LiF dosimeters. For example, for the same dose to tissue from 40 keV photons and 60Co photons, the resulting dose to CaF2 is 10 times higher for the 40 keV photons than the 60Co photons. The dose to
TLD-100 is only about 40% higher for the 40 keV photons than the 60Co photons (Ranogajec-Komor et al 1993). It is possible to improve the sensitivity of TLD-100 by a factor of 5 using special irradiation and annealing methods (Horowitz 1984b), but these methods are fairly cumbersome for routine applications.
Nakajima et al (1978) presented a new type of LiF material that is doped with magnesium,
copper, and phosphorus (LiF:Mg,Cu,P), and their results showed a photon sensitivity 23 times higher than TLD-100. The initial formulations suffered from poor reusability, but other groups improved on the stability of the phosphor, and a commercial version was available by the late 1980s (Pradhan and Bhatt 1989). Harshaw TLD, now known as Saint-Gobain Crystals and Detectors (SGC&D), began commercially producing LiF:Mg,Cu,P TLDs in the late 1990s, including versions with isotopically enriched 6Li or 7Li. The new materials are denoted TLD-100H, TLD-600H, and TLD-700H.
Perry et al (1999) describe a new environmental dosimetry system from SGC&D which uses
either TLD-100H or TLD-700H, with four TLDs mounted in an assembly behind various filters. The filters provide energy discrimination capabilities so that the dosimeter can be used to measure the dose equivalent quantities relevant for environmental dosimetry. The holder design is a modification of previously existing ones used for personnel dosimetry and environmental
dosimetry, and the new holder with the LiF:Mg,Cu,P TLDs is denoted the Harshaw Type 8855 environmental dosimeter.
The 8855 dosimeter is designed to be used for environmental exposures to photon and beta sources, and Perry et al use the dosimeter for mean photon energies as low as 20 keV. To be able to determine the dosimetric quantities relevant to environmental dosimetry, namely the ambient dose equivalent, H*(10), and the directional dose equivalent, H’(0.07,α), the results from the multi-element dosimeter are processed through a neural network algorithm. Although the accuracy requirements for environmental dosimetry can be as high as 50%, the output from the neural network algorithm is quite sensitive to the element ratios, and the results can change by as much as 20% due to a change of only 5% in an individual element. To understand the energy response in the dosimeter under the various filters, it is necessary to have an understanding of the energy response of the TLD material itself. This knowledge can then lead to improvements in dosimeter designs in the future.
Two nuclear power utilities, Ontario Power Generation and Bruce Nuclear, have embarked on a joint research project to study the use of the 8855 dosimeter for their environmental dosimetry programs, with a large number of tests required to characterize the dosimeter. This project is a part of the larger study, and focuses on the photon energy response of the 8855 dosimeter, as well as the energy response of the bare TLD-100H chips. For comparison purposes, the photon energy response of TLD-100 is also examined.
1.1 Measurement
Quantities
The following two radiation measurement quantities are used throughout the course of this work, and the reader should be familiar with these terms:
Kerma, K
Kinetic energy released per unit mass (J/kg). This non-stochastic quantity only applies for indirectly ionizing radiations, and is the expectation value of the energy transferred from uncharged particles to charged particles per unit mass at a point (Attix 1986). Kerma can be
Absorbed dose, D
Energy deposited per unit mass (J/kg). The absorbed dose is the expectation value of the energy imparted to matter per unit mass at a point (Attix 1986). The units are the same as kerma, but the difference between the two quantities is that dose is energy per unit mass that remains at point P, while the kerma is the kinetic energy per unit mass transferred to charged particles at point P. These particles may then leave the volume of interest, and produce none of the effects associated with ionizing radiation.
Although the ambient dose equivalent and the directional dose equivalent are the relevant quantities for environmental dosimetry, the absorbed dose is a more fundamental quantity that is useful for characterizing the intrinsic energy response of a dosimeter. For this reason, the environmental dose equivalents will not be further discussed in this work.
Response
For this work, the response is defined as the quotient of the TL signal and the dosimetric quantity that is being measured. The TL signal is integrated by the reader in units of charge (nC), and this value is divided by the relevant dosimetric quantity to calculate the response.
Air kerma response
The TL signal divided by the delivered air kerma. The relative air kerma response can be calculated by normalizing the results to one of the measurements, usually the response to 60Co photons.
TLD dose response
The TL signal divided by the absorbed dose in the TLD. This is normally simply referred to as “dose response” throughout this work. The relative dose response can be calculated by normalizing the results to one of the measurements, usually the response to 60Co photons.
Dose response in terms of medium
The TL signal divided by the absorbed dose that would be deposited in the medium in the absence of the TLD. This is not used in this work, but is used in many of the publications referenced throughout this work. Usually this is in terms of the TL signal arising from an absorbed dose in water or tissue.
Photon energy response
The air kerma response or dose response as a function of the photon energy, usually normalized to the 60Co result.
1.2
Guide to the Thesis
The aim of this project was to test the photon energy response of the Harshaw Type 8855 environmental dosimeter. The energy response of the LiF:Mg,Cu,P (TLD-100H) bare chips used in the dosimeter was measured separately, and for comparison a duplicate set of measurements were performed using LiF:Mg,Ti (TLD-100).
Chapter 2 describes the air kerma response measurements for TLD-100 and TLD-100H, using the TLD system developed at the National Research Council Canada (NRC) (Janovský and Ross 1993). The previous work at the NRC focused only on the response of TLD-100 to 137Cs and 60Co γ-rays (Shortt et al 1997), and this work extends the measurements to mean photon energies as low as 24 keV.
Chapter 3 outlines the Monte Carlo simulations using EGSnrc (Kawrakow 2000) to calculate the absorbed dose to the TLDs for the measurements described in Chapter 2. Using these results, the dose response is calculated as a function of photon energy for both TLD-100 and TLD-100H. The results for both materials are compared to other published measurements of the energy response, and the correlation with ionization density is shown.
Chapter 4 describes the photon energy response measurements for the Harshaw Type 8855 dosimeter. Details of the protocol used to read the TLDs in the Harshaw TLD Model 6600 reader are presented, including a residual signal subtraction algorithm to improve the dosimeter
Chapter 2
2.1 Introduction
The photon energy response of TLD-100 has been measured by various groups since its development in the 1960s, with a compilation of data presented by Budd et al (1979). These studies focused on the response of TLD-100 to photons with energies from 20 to 200 keV, with the measurements expressed as the response in terms of dose to water, normalized to the 60Co response. Although there was a great deal of scatter in the measurements, most of the groups measured a response in this photon range that was higher than what would be predicted based on the relative mass energy-absorption coefficients of TLD-100 and water. Horowitz (1984b) has suggested that the over-response is related to the increased ionization density at low energies, and that it may be related to the supralinearity behaviour of TLD-100 at high doses.
Published data on the photon energy response of TLD-100H is scarce since the material is fairly new, but Sáez-Vergara et al (1999) have compared its response to other available LiF:Mg,Cu,P formulations. Much more energy response data on the other formulations are available, and Olko et al (1993) have a series of publications characterizing the energy response of a Polish formulation of LiF:Mg,Cu,P.
The Ionizing Radiation Standards (IRS) TLD system has previously been described in detail (Janovský and Ross 1993), and the system was used in earlier work to characterize the response of TLD-100 to 137Cs and 60Co γ-rays (Shortt et al 1997). Due to the high level of precision achievable with the system, with a standard uncertainty of about 0.5%, it was used in this work to measure the energy response of TLD-100H bare chips. Measurements were performed for both TLD-100 and TLD-100H using 137Cs and 60Co sources, as well as a number of x-ray qualities using the ISO narrow spectrum series (ISO 1996).
2.2
Materials and Methods
All of the TLDs used in this work were obtained from Saint-Gobain Crystals and Detectors (SGC&D) (Solon, Ohio). The LiF:Mg,Ti (TLD-100) chips used previously at the National Research Council Canada (NRC) had a square cross section, and dimensions of 3.2 x 3.2 x 0.89 mm. In the present work, thinner TLD-100 chips were used, with dimensions of 3.2 x 3.2 x
had a density of 2.48 g·cm-3, with P, Mg and Cu dopant concentrations of 3000, 2000 and 40 ppm by weight, respectively. Sets of 25 chips were stored in small quartz trays, and were kept at room temperature in a dark area when not in use.
The protocol used for the TLD-100 chips has been described previously (Janovský and Ross 1993, Shortt et al 1997), and will be briefly outlined here. The chips were annealed at 400°C in a high-temperature oven for one hour, with the quartz tray placed on a steel plate inside the oven. After the high-temperature anneal, the chips were rapidly cooled to room temperature by placing the tray on a brass block near the oven. After approximately 30 minutes, they were then annealed at 100°C in a low-temperature oven for two hours, and were again rapidly cooled to room temperature. After irradiation but prior to readout, the chips were annealed at 100°C in the low-temperature oven for 12 minutes. The post-irradiation anneal empties the low low-temperature traps, and reduces the effects of fading of the TL signal. The entire anneal/irradiation/readout process normally occurred over a period of less than 48 hours.
Temperature probes placed 3 to 4 cm above the quartz tray in each oven were used to maintain a constant air temperature. In addition, thermocouple probes were attached to the plates used to hold the quartz tray in each oven, so that the temperature could be measured in close proximity to the chips. The oven temperature settings were adjusted so that the probe in the steel plate was at the desired annealing temperature once it had achieved thermal equilibrium. The chips were only placed in the oven after the plate reached the equilibrium temperature, which took approximately two hours from a cold start for the 400°C oven, and one hour for the 100°C oven.
It is well known that LiF:Mg,Cu,P is much more sensitive to thermal treatment than LiF:Mg,Ti, with a reported irreversible loss in sensitivity if the material is heated much above
1
240°C (McKeever et al 1995). Horowitz and Horowitz (1990) report a loss of TL sensitivity of 20 – 50% after annealing samples for 10 minutes at 300°C, and the general recommendation for LiF:Mg,Cu,P is an anneal for 10 minutes at 240°C. Unfortunately, there is a high-temperature glow peak at approximately 270°C that cannot be fully read out without affecting the chip sensitivity. The residual signal is almost completely eliminated by annealing in an oven, but this cannot be done for TLD cards with chips mounted in Teflon®. The problems caused by residual signal for unannealed LiF:Mg,Cu,P are discussed further in Section 4.2.2.
The annealing protocol used for the TLD-100H chips was a modification of the one implemented at the CIEMAT Radiation Dosimetry laboratory (Sáez-Vergara and Romero 1996). The chips were annealed at 240°C for 15 minutes, followed by rapid cooling. Measurements were conducted in an attempt to estimate the actual temperature of the chips during the annealing process, by placing a thermocouple under the lid of the quartz tray (Figure 2.1). From these results, it can be estimated that the temperature of the chips was between 235°C and 240°C for approximately 10 minutes. Care was taken to place the quartz tray quickly inside the oven once the door was opened, because the temperature control system tended to overheat the oven temporarily if the temperature probe was allowed to cool more than a few °C. To prevent any overheating, the oven door was normally open less than 5 seconds. After irradiation but prior to readout, the chips were annealed at 130°C in the low-temperature oven for 12 minutes, followed by rapid cooling. Using this annealing process, the residual signal was reduced to less than 0.03%.
TLD readouts were performed using a Victoreen 2800M planchet-type reader, and the same time-temperature profile (TTP) was used for the TLD-100 and TLD-100H chips. At the beginning of the readout, the planchet temperature was increased to 100°C in approximately 2 seconds, and then increased linearly at 5°C·s-1 to a maximum temperature of 240°C. The maximum temperature was maintained for 15 seconds, for a total readout time of 45 seconds. A continuous flow of nitrogen gas was used to purge the heating chamber, both during and after readout. The nitrogen reduces the background signal from the planchet, and also prevents oxidation of the TLD chip. Once the chip was placed on the planchet and the drawer was closed, a delay of 5 seconds prior to the beginning of the readout was used to allow the air to be purged
0
5
10
15
Time (minutes)
0
50
100
150
200
250
Temperature (°C)
from the chamber. After readout, the planchet temperature was allowed to cool naturally to below 40°C before the planchet drawer was opened.
The TL glow curve was stored for each chip, with 450 data channels for the 45-second readout. The signal was integrated from channels 41 to 430 for both TLD-100 and TLD-100H. This corresponded to glow peaks 4 and 5 for TLD-100, and peak 4 and part of peak 5 for TLD-100H. The background signal would ideally be estimated by reading a freshly annealed chip immediately following every TLD readout, but since this was not practical, the background was estimated using readouts of the bare planchet. Several background measurements of the bare planchet were performed prior to reading each set of TLDs, using the same TTP and integrating region as was used for the TLDs. The average planchet background signal was calculated based on the three background measurements immediately before the first TLD was read. A background reading using a freshly annealed chip was approximately 10% higher than from the bare planchet, so the average background signal from the planchet was multiplied by 1.1 before applying the background subtraction. The background subtraction was equivalent to roughly 4 μGy air kerma from 60Co when using TLD-100H, and 130 μGy air kerma from 60
Co when using TLD-100.
Each of the 25 chips was individually calibrated using 60Co γ-rays in a field where the air kerma rate was accurately known. A polymethyl methacrylate (PMMA) phantom was used to hold all 25 chips for irradiation in the reference field, and the design is shown in Figure 2.2. The TLDs were placed symmetrically with respect to the front and back faces of the holder, with a wall thickness of 6 mm to provide charged particle equilibrium for the 60Co source. Individual calibration factors for each chip were recorded after readout, and the TLDs were annealed again. The 25 chips were divided into groups of five, with subsequent irradiations performed in one of two smaller Lucite phantoms (Figure 2.2). The smaller phantoms were circular with a radius of 16 mm, and held five chips placed symmetrically about the central axis at a radius of 9 mm. One of the phantoms had wall thicknesses of 6 mm, and was used for the 60Co and 137Cs irradiations. The other phantom had wall thicknesses of about 1.6 mm, and was used for the x-ray irradiations.
Figure 2.2: Phantoms used for the TLD irradiations. The large phantom was used for the initial calibrations, and the smaller phantom was used for the reference irradiation.
31 mm 69 mm
One group of five TLDs was irradiated in the 60Co reference field to determine the overall change in sensitivity of the set. This change in sensitivity could result from the annealing process or by a change in the reader sensitivity. The other four groups were delivered graded exposures in the test beam, where the air kerma rate was also accurately known. After readout, the measured air kerma was determined for each chip using the TL signal and the 60Co calibration factor. The result was divided by the known delivered air kerma to determine the air kerma response.
A description of the 137Cs and 60Co irradiation facilities at the NRC is presented by Shortt et
al (1997). The air kerma rate for the 60Co source has been determined using a graphite cavity chamber as a primary standard (Shortt and Ross 1986), and the 137Cs air kerma rate was established using ionization chambers calibrated against the 60Co primary standard. The 60Co reference irradiations were performed using the Theratron Junior, at a distance of 3 m. The field size is 80 cm x 80 cm at this distance, and the air kerma rate is approximately 2.2 · 10-2 mGy·s-1. The x-ray air kerma rates are established using free air chambers, and the chambers are described by Henry and Garrett (1960). Special filters were used to provide the ISO narrow spectrum series x-ray beams used in this work. The irradiations were performed at 1 m from the source, where the field has a diameter of 15 cm.
2.3 Results
and
Discussion
Typical glow curves for TLD-100 and TLD-100H from 60Co irradiations are presented in Figure 2.3. The TLD-100 glow curve was from a delivered air kerma of 17 mGy, while the TLD-100H glow curve was from a delivered air kerma of 1.3 mGy, and the TLD-100 results were scaled by a factor of about 2.6 so that the area under the two curves would be equal. For the protocols used in this work, TLD-100H was approximately 34 times more sensitive to 60Co γ-rays per unit mass than TLD-100. The measured relative sensitivity is in broad agreement with other reported results, ranging from 10 to 35 times more sensitive than TLD-100 (Moscovitch 1999, Horowitz and Horowitz 1992). The large discrepancy in reported results is due to the fact that the measured sensitivity is dependent on many contributing factors, including the annealing and readout procedures used, the PMT spectral sensitivity, the optical properties of the chips, the reflectivity of the planchet, and the presence of encapsulation.
0
100
200
300
400
500
Time (ds)
0
100
200
300
400
500
600
700
Reader output (nA)
TLD-100H
TLD-100H
TLD-100
Figure 2.3: Typical glow curves for TLD-100 and TLD-100H. The air kerma values were 17 mGy and 1.3 mGy for TLD-100 and TLD-100H, respectively. The TLD-100 values were scaled by a factor of 2.57 so that the area under the two curves was equal.
A typical set of results from the air kerma response measurements is presented in Figure 2.4, for TLD-100H irradiations in the ISO 60 kV narrow spectrum beam (N-60), with the 60Co irradiation results normalized to unity. The relative standard deviation in the response for each group of five chips was typically 0.4 – 0.6%, and was dependent on the photon beam energy and the type of TLD. As can be seen in the figure, the measured response was non-linear with respect to the delivered air kerma, with an increase in response as the air kerma was increased. For an increase in air kerma by a factor of 4, the response typically increased by 1 – 2%. This was measured for both TLD-100 and TLD-100H for all of the photon energies used, and was in disagreement with other reported results of the linearity of the two materials in this dose region. TLD-100 is known to exhibit supralinearity for absorbed doses between roughly 1 to 1000 Gy, but is reported to be linear for the air kerma range of 5 to 20 mGy used in this work (Horowitz 2001). TLD-100H has been reported to exhibit a linear dose response from 1 μGy to 1 Gy, with the measurable onset of saturation at about 10 Gy (Da-Ke et al 1984). Further measurements using TLD-100H in a different reader did not exhibit any non-linearity in this region, with the results presented in Figure 2.5. Although it is possible that the readout protocol used in the Victoreen 2800M reader may have led to these results, it is suspected that the measured non-linearity was an artefact of the reader. No experiments were conducted to demonstrate this conclusively, and no other planchet-type reader was available for testing, so all of the results were simply corrected for the measured non-linearity.
To calculate the response of the TLDs for each photon beam relative to the response to 60Co, a linear least squares fit was performed on the test results, as shown in Figure 2.4. To correct for the non-linear response, the equation of the fitted line was used to calculate the air kerma delivery in the test beam that would be necessary to produce the same signal on the PMT as the
60
Co reference irradiation. The overall response to the test beam was then the ratio of this calculated air kerma level to the air kerma delivered from the 60Co reference irradiation.
A summary of the test results is presented in Table 2.1 and Figure 2.6. The uncertainties for each test beam were calculated by combining the uncertainty in the least squares fit in quadrature with the uncertainty in the 60Co reference results, for a typical uncertainty of 0.5% for TLD-100 and 0.7% for TLD-100H. These uncertainties are statistical only, and do not take into account any uncertainties in the source calibrations. The response results were in broad agreement with
0.5
1.0
1.5
2.0
Air kerma (mGy)
0.94
0.95
0.96
0.97
0.98
0.99
1.00
1.01
Relative air kerma response
60
Co
N-60
Figure 2.4: Typical set of air kerma response measurements. This set was for TLD-100H in the N-60 beam, with the 60Co reference results shown.
0
1
2
3
4
5
Air kerma (mGy)
0.98
0.99
1.00
1.01
1.02
Relative air kerma response
Figure 2.5: Linearity of TLD-100H in Harshaw Model 6600 hot gas reader, normalized to the mean response at 0.9 mGy.
(keV) (TLD-100) (TLD-100H) N-30 24 1.445(6) 0.941(6) N-40 32 1.464(7) 1.014(7) N-60 47 1.387(6) 0.971(7) N-80 65 1.272(6) 0.846(6) N-100 83 1.211(6) 0.778(3) N-150 117 1.163(7) 0.775(5) N-200 164 n/a 0.824(6) N-250 207 1.110(7) 0.853(7) 137 Cs 612 1.023(6) 0.972(5) 60 Co 1055 1.000 1.000 Table 2.1: Measured air kerma response for TLD-100 and TLD-100H for several beam qualities. The mean photon energies listed for the ISO series x-ray spectra were calculated using tabulated spectra from GSF (Seelentag et al 1979), and the mean energies for 137Cs and 60Co were calculated using realistic spectra included in the EGSnrc Monte Carlo distribution (Rogers and Kawrakow 2000). The standard uncertainty in the last digit is given in parentheses.
10
100
1000
Mean photon energy (keV)
0.8
1.0
1.2
1.4
Relative air kerma response
TLD-100
TLD-100H
Figure 2.6: Air kerma response measurements for TLD-100 and TLD-100H. The standard uncertainty on each point is typically 0.5% for TLD-100 and 0.7% for TLD-100H.
Based on previous TLD studies conducted at the NRC (Shortt et al 1997), the measured air kerma response can be influenced by the phantom used for the irradiations, with photon attenuation and scatter occurring in the phantom. The earlier work at the NRC measured the response of TLD-100 to 137Cs and 60Co photons, and aluminium and PMMA phantoms with various wall thicknesses were used to measure the effect of photon attenuation and scatter in the phantom walls on the measured TL response. In this work, a different approach was taken using Monte Carlo simulations, and the calculations are described in detail in Chapter 3.
2.4 Conclusions
The energy response results were in broad agreement with other published results for both TLD materials, but these results are known to be influenced by the phantom used for the irradiations. Further calculations in the next chapter will determine the dose response as a function of energy.
Chapter 3
3.1 Introduction
In the previous chapter, the measurements of air kerma response were presented, but as demonstrated by Shortt et al (1997) the measured air kerma response can be influenced by the phantom used to hold the TLDs. It is preferable to determine the TLD dose response as defined in Section 1.1, so that the results can be compared with those obtained using different irradiation geometries and photon beams. A “perfect” TLD material would emit the same number of TL photons per unit of absorbed dose regardless of the beam quality, but due to the complex interactions that occur in TLD materials they may present non-linearity with respect to beam quality.
The calculation of absorbed dose in the TLD, given the delivered air kerma and the incoming photon spectrum, can be determined using various methods. Starting with a very simple model, we can assume that the phantom used to hold the TLDs is made of LiF, and that the wall of the phantom is thick enough to provide charged particle equilibrium at the position of the chips. We also neglect the presence of dopants in the TLDs in this simple model, and assume that the chips are made of pure LiF. We start with a parallel and monoenergetic incident photon beam, and assume that photon attenuation and scatter in the phantom can be neglected. The absorbed dose to the chip, DLiF, is then given by
en LiF LiF D μ ρ ⎛ ⎞ = Ψ ⎜ ⎟ ⎝ ⎠ , (3.1)
where Ψ is the photon energy fluence, and (μen/ρ)LiF is the mass energy-absorption coefficient
for LiF. The air kerma, Ka, for the same incoming photon beam is given by
tr a air K μ ρ ⎛ ⎞ = Ψ ⎜ ⎟ ⎝ ⎠ , (3.2)
where (μtr/ρ)air is the mass energy-transfer coefficient for air. This can then be expressed as
(
)
en a air 1 1 K g μ ρ ⎛ ⎞ = Ψ ⎜ ⎟ − ⎝ ⎠ , (3.3)simple model. The resulting dose to the chips per unit air kerma is then LiF LiF en a air D K μ ρ ⎛ ⎞ = ⎜ ⎟ ⎝ ⎠ , (3.4)
which is simply the ratio of mass energy-absorption coefficients for LiF to air.
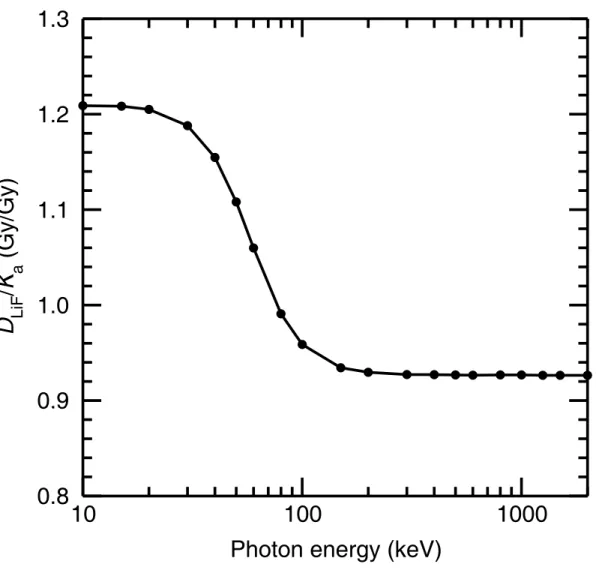
Data for the mass energy-absorption coefficients of LiF and air were obtained from Hubbell and Seltzer (1997), and DLiF / Ka as a function of monoenergetic photon energy is presented in
Figure 3.1. The theoretical dose to the TLD per unit air kerma is roughly constant at low photon energies, then drops by about 25% between 20 and 200 keV, and then remains constant up to 2 MeV.
For a slightly more realistic model, we need to consider that the actual phantom used in this work was made of PMMA, and not the LiF used in the simple model. The TLDs were 0.38 mm thick, and had a density of 2.5 to 2.6 g·cm-3, for a density thickness of about 0.1 g·cm-3. For the photon energies in consideration, the TLDs were too large to be considered Bragg-Gray cavities, where the dose is entirely deposited by electrons originating in the material surrounding the cavity. The density thickness of the TLDs was also less than the range of electrons produced from the 60Co and 137Cs beams, so the TLDs could not consistently be treated as “large” cavities either, where the dose is entirely deposited by electrons originating within the cavity. For these types of intermediate cavities, Burlin (1966) proposed that weighting factors could be used to reflect the two components of the electron spectrum, although several authors later pointed out shortcomings in Burlin’s method (Horowitz et al 1983, Frujinoiu 2001, Mobit et al 1997). Since then, a number of different cavity theories have been proposed (Kearsley 1984, Haider et al 1997, Frujinoiu 2001), but they generally require the experimental determination of a number of parameters, or are only appropriate for simple one-dimensional geometries.
For realistic three-dimensional geometries, one must also consider the photon attenuation and scatter within the phantom and the chip itself, which can be simulated using Monte Carlo
10
100
1000
Photon energy (keV)
0.8
0.9
1.0
1.1
1.2
1.3
D
LiF/
K
a(Gy/Gy)
Figure 3.1: Calculated absorbed dose in LiF per unit air kerma as a function of photon energy. The TLDs were considered to be in a LiF phantom, and photon attenuation and scatter in the phantom was neglected.
unit of delivered air kerma for each of the incident photon beams.
3.2
Background on EGSnrc
A historical look at the EGS (Electron Gamma Shower) system up to 1994 is available from Bielajew et al (1994), and a very brief history is presented here. Much of the early development of EGS took place at the Stanford Linear Accelerator Center (SLAC) at Stanford University, and the first major package was introduced in 1978, known as EGS3 (Ford and Nelson 1978). The system was designed to simulate electromagnetic cascades at energies from 100 GeV down to 1 keV for photons and 1 MeV kinetic energy for electrons. With the introduction of EGS4 in 1985, the low energy limit for electrons was extended to a kinetic energy of 10 keV (Nelson et al 1985). Several improvements were also made in the underlying physics, including the addition of Rayleigh scattering.
The transport of low energy electrons in EGS4 was improved with the introduction of PRESTA (Parameter Reduced Electron Step Transport Algorithm) in 1986 (Bielajew and Rogers 1987), and by 1989 the calculations of collision and radiative stopping powers were modified to be compliant with those from ICRU Report 37 (ICRU 1984). Several variance reduction techniques were also introduced to improve the efficiency of EGS4, including photon forcing, bremsstrahlung splitting, and electron range rejection (Rogers et al 1995).
A new version of EGS4, called EGSnrc, was released in 2000, and included major improvements in the electron transport methods in relation to EGS4/PRESTA (Kawrakow 2000). These improvements allowed EGSnrc to model ion chamber response at the 0.1% level, relative to its own cross sections. The low energy cutoffs were extended to 1 keV kinetic energy for both photons and electrons, but the performance at low energies is still under study.
Several user codes were developed over the years at the NRC to model cylindrical geometries for use with EGS3 and EGS4, and they have been updated for use with EGSnrc (Rogers et al 2001). These codes simplify the interface with EGSnrc, so that the user only needs
to change parameters in an input file to set up the appropriate geometry and scoring options. In this work, the DOSRZnrc code was used to calculate doses and air kerma, and the FLURZnrc code was used to calculate electron spectra in the TLDs.
This chapter presents the results from Monte Carlo simulations of the TLD holder used in Chapter 2, and uses the results along with the air kerma response measurements to calculate the dose response as a function of photon energy for both TLD-100 and TLD-100H.
3.3
Materials and Methods
3.3.1
Replacement of default photoelectric cross sections
As described in Section 3.2, much of the early work on the EGS system was performed in the 1970s, and much of the early code is still present in EGSnrc. During this early development, photon cross sections from Storm and Israel (1970) for elements 1 to 100 were implemented in the pre-processor for the shower codes. The cross sections were calculated quantities, and covered all of the major photon interactions, including pair production, coherent (Rayleigh) scattering, incoherent (Compton) scattering, and photoelectric absorption.
Since 1982, the National Institute of Standards and Technology (NIST) has compiled updated photon cross sections using different methods than Storm and Israel, with the most recent compilation published in 1999 (Berger et al 1999). Important differences between the two datasets appear for photoelectric interactions at photon energies lower than 200 keV, with up to 5% discrepancies in some cases (Hobeila and Seuntjens 2002).
The current version of EGSnrc uses the total photo-absorption cross sections from the PEGS4 pre-processor, which uses tabulated cross section data from Storm and Israel. PEGS4 calculates the total photo-absorption cross sections for compounds or mixtures by weighting the individual cross sections of the component elements based on their relative proportions in the material. The treatment of photoelectric interactions was modified substantially in the update from EGS4 to EGSnrc, with the option of explicitly simulating fluorescent photons and Auger electrons resulting from atomic shell vacancies. This was already implemented in a simplified
In EGSnrc, once a photoelectric interaction has been chosen based on the total cross section from PEGS4, the code needs to sample a specific element and atomic shell where the vacancy will take place to be able to simulate the relaxation particles correctly. To do this, EGSnrc uses the elemental composition information from PEGS4 along with its own fit formulas for the elemental cross sections, generated using photo-absorption cross sections from the NIST XCOM program (Berger et al 1999). The internal inconsistency in using different cross section datasets will likely be resolved in future versions of EGSnrc, with the revision of the PEGS4 pre-processor. This has not been a high priority to this point since the majority of EGS users work with photon energies in the range of 1 to 20 MeV, where photoelectric interactions have a relatively low probability of occurring.
To take full advantage of the recent NIST photo-absorption cross sections, the Storm and Israel photo-absorption cross sections normally used by PEGS4 were replaced by ones from XCOM, using a file provided by Hobeila1. Several tests were conducted to ensure that the new cross sections were working properly. For comparison purposes, two sets of PEGS4 material datasets were generated for each of the materials used in this work, one set using the XCOM photo-absorption cross sections, and the other set using the default Storm and Israel cross sections.
3.3.2
Creation of materials using PEGS4
New material data files were generated using PEGS4 for the Monte Carlo simulations of the TLDs in the PMMA phantom. The PEGS4 manual is included with the EGSnrc manual (Kawrakow and Rogers 2001), and describes in detail various operations that can be performed
1
using the pre-processor. For this work, PEGS4 was simply used to generate the material data files using simple input files.
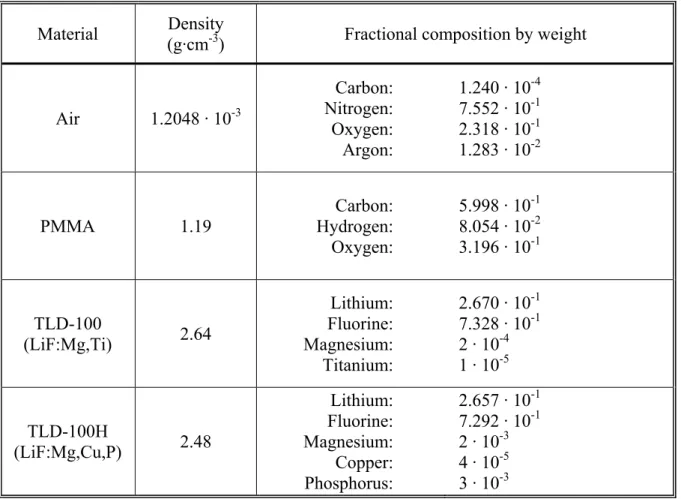
The compositions of the TLD materials, including dopants, were obtained from SGC&D, and the compositions of PMMA and air were obtained from the EGSnrc distribution. Natural isotopic abundances were used for all of the materials, including the TLDs, since TLD-100 and TLD-100H use natural lithium. The density and composition information for each of the materials used in this section are listed in Table 3.1. The density effect data from ICRU Report 37 (ICRU 1984), included with the EGSnrc distribution, were used when creating each of the materials, and the density effect data for pure LiF were applied for both TLD materials. The Rayleigh scattering option was turned on for all of the PEGS4 datasets, and the datasets were generated for photon and electron kinetic energy ranges from 1 keV to 2 MeV. As stated earlier, two separate sets of material datasets were generated, one using XCOM photo-absorption cross sections, and the other using Storm and Israel photo-absorption cross sections.
3.3.3
Calculation of air kerma
As stated in Section 3.1, the objective of the Monte Carlo calculations was to determine the dose to the TLDs per unit air kerma. The output from DOSRZnrc was in terms of dose delivered per unit of incident fluence at the surface of the modelled geometry, not per unit of air kerma, so it was necessary to determine the air kerma per unit of incident fluence as well. Monte Carlo simulations were performed using DOSRZnrc to score the air kerma from each of the incident photon beams, using a thin slab of air with a large radius and a parallel incident photon beam. This method was used by Borg et al (2000), and has the advantage of using a consistent set of underlying photon cross sections for the dose calculations and the air kerma calculations.
The dose to a 2 μm thick air slab with a 10 cm radius was scored for each of the incident photon beams, with the photons forced to interact in the slab. Tabulated photon spectra were used as inputs for the simulations, using data from GSF (Seelentag et al 1979) for the ISO narrow spectrum series x-rays, and data from the EGSnrc distribution (Rogers and Kawrakow 2000) for the 137Cs and 60Co beams. The spectral data from GSF for 30 kV to 150 kV were measured at a source-detector distance of 75 cm, and for 200 kV to 250 kV at a source-detector
Material
(g·cm-3) Fractional composition by weight Air 1.2048 · 10-3 Carbon: Nitrogen: Oxygen: Argon: 1.240 · 10-4 7.552 · 10-1 2.318 · 10-1 1.283 · 10-2 PMMA 1.19 Carbon: Hydrogen: Oxygen: 5.998 · 10-1 8.054 · 10-2 3.196 · 10-1 TLD-100 (LiF:Mg,Ti) 2.64 Lithium: Fluorine: Magnesium: Titanium: 2.670 · 10-1 7.328 · 10-1 2 · 10-4 1 · 10-5 TLD-100H (LiF:Mg,Cu,P) 2.48 Lithium: Fluorine: Magnesium: Copper: Phosphorus: 2.657 · 10-1 7.292 · 10-1 2 · 10-3 4 · 10-5 3 · 10-3
Table 3.1: Composition of materials used in the Monte Carlo simulations. The air and PMMA compositions were obtained from the EGSnrc distribution, and the TLD compositions were obtained from SGC&D. Other possible impurities in the TLDs were not included.
distance of 225 cm. The cutoff energy for electron transport was raised to 2 MeV kinetic energy, so that the electrons were stopped as soon as they were created, and deposited all of their kinetic energy locally. The scored dose in the air slab was then equivalent to determining the air kerma. The photon transport cutoff was 1 keV, consistent with the value used for the dose calculations described in the next section, even though each photon only had a single interaction within the air slab.
All of the low energy options in DOSRZnrc were turned on for the simulations, including bound Compton scattering, Rayleigh scattering, and atomic relaxations. These options are described in detail in the EGSnrc manual. Each of the simulations used 1 · 108 histories, for a statistical uncertainty of about 0.01%, and a CPU time of approximately 30 minutes on a 733 MHz computer.
3.3.4
Calculation of TLD dose
In order to calculate the dose to the TLD chips inside the PMMA phantom, a model of the phantom geometry needed to be devised. A completely accurate three-dimensional model of the entire phantom was not practical using existing EGSnrc user codes, so some simplifications of the phantom geometry were necessary. To take advantage of the efficient and well-benchmarked cylindrical user codes at the NRC, the phantom was modelled as a cylinder with a single TLD chip embedded in the centre of the cylinder, with appropriate wall thicknesses in front of and behind the chip (Figure 3.2).
The real phantom did not have a uniform radius of PMMA around each of the TLDs, so the choice of an appropriate radius in the model phantom needed to be considered. Using the radius of the real phantom would lead to an overestimation of the contribution to the TLD dose from photons scattered in the phantom, and a small phantom radius could lead to an underestimation of the scatter component. To determine the sensitivity of the model to the phantom radius, several simulations were conducted using DOSRZnrc toexamine the dose delivered to the TLD chip as a function of the phantom radius. An alternate model was also created, using the real phantom radius and placing a ring of TLD material at the appropriate distance from the phantom
Figure 3.2: Model of phantom used for Monte Carlo calculations, for the centred chip and ring geometries. d 3.6 mm
TLD
31 mm 9 mmaxis (Figure 3.2). This model obviously distorted the shape of the TLDs, but was useful for comparison against the centred-chip model.
The various models were tested by simulating the geometry used by Shortt et al (1997) in earlier work performed at the NRC using TLD-100. The authors had performed a series of measurements to examine the effect of the front and back wall thickness of the phantom on the measured response, using 137Cs and 60Co photon beams. The simulations of these experiments were performed using DOSRZnrc, and only for the experiments that measured the change in TLD response in a PMMA phantom as a function of the front wall thickness. A discussion of the results from these simulations is presented in Section 3.4.1, and the outcome led to the selection of the phantom model to be used for the rest of the Monte Carlo simulations. The selected phantom model was a cylinder of PMMA with a radius of 13 mm, and a TLD with a 1.8 mm radius was embedded in the centre of the cylinder. Although the real TLD-100 chips actually had a square cross section, the area of the front face of the chips was the same as for circular chips with a 1.8 mm radius, so they were modelled in the same manner as the TLD-100H chips. For the phantom used in the x-ray beams, the front wall thickness was 1.63 mm and the back wall thickness was 1.87 mm. For the phantom used for the 137Cs and 60Co irradiations, the front wall thickness was 6.24 mm and the back wall thickness was 6.32 mm.
After the selection of an appropriate phantom model, a series of simulations were performed using DOSRZnrc for each of the photon beams used in this work. The photon sources were modelled as point sources at 1 m from the front face of the phantom, with a vacuum between the source and the phantom. The sources themselves were not explicitly simulated, but the source-phantom distance was entered so that a diverging photon beam was modelled at the front face of the phantom. It approximated the actual irradiation distance for the x-ray beams and the 137Cs beam, but was smaller than the 3 m irradiation distance used for the 60Co source. The phantom model only had a diameter of 26 mm, so the effect on the photon divergence by modelling the irradiation distance as 1 m instead of 3 m was negligible.
Unlike the air kerma calculations, electron transport within the phantom and TLD was simulated as well as photon transport, with an electron kinetic energy cutoff of 10 keV. The range of a 10 keV electron in water is only 3 μm (Johns and Cunningham 1983), which is small
All of the improved electron transport options in EGSnrc were turned on for the simulations, as well as all of the low energy photon and electron options. These options included the exact boundary crossing algorithm, the PRESTA-II electron-step algorithm, spin effects, NIST bremsstrahlung cross sections, bound Compton scattering, photoelectron angular sampling, Rayleigh scattering, and atomic relaxations. These options are described in detail in the EGSnrc manual. The photon forcing and electron range rejection variance reduction techniques were employed for the dose calculations, and these techniques are also described in detail in the EGSnrc manual.
The simulations were performed using TLD-100 and TLD-100H, and separate sets of simulations were performed using the XCOM photo-absorption cross sections and the Storm and Israel cross sections. All of the simulations were performed to a statistical uncertainty of less than 0.1%, requiring between 5 · 108 and 2.2 · 109 histories. The required CPU time for each simulation varied between 3 hours and 70 hours on a 733 MHz computer, depending on the photon energy and the phantom thickness.
3.3.5 Fluence
calculations
Additional Monte Carlo simulations were performed to determine the electron fluence spectrum in the TLDs, to examine the relation between the electron spectrum and the measured energy response. The FLURZnrc user code was used for the simulations, which shares many of the same inputs as DOSRZnrc. The user code has various scoring options available, and for these simulations both the total electron fluence spectra and the primary electron fluence spectra were tabulated. The energy width of the scoring bins was modified depending on the incident photon energy, and the number of bins varied from 30 to 80 for all of the photon beams.
All of the options common to both FLURZnrc and DOSRZnrc were left unchanged, except for the electron transport cutoff. To be able to determine the contribution of low energy electrons to the fluence, the electron transport cutoff was lowered to 1 keV kinetic energy. This resulted in
longer calculation times per history, but good spectra were obtained using only 1 · 107 histories for each photon beam. The CPU time for each simulation varied between 0.5 hours to 7 hours on a 733 MHz computer, again depending on the photon energy and the phantom thickness. The FLURZnrc calculations were only performed using the XCOM photo-absorption cross sections.
3.4 Results
and
Discussion
3.4.1
Validation of phantom model
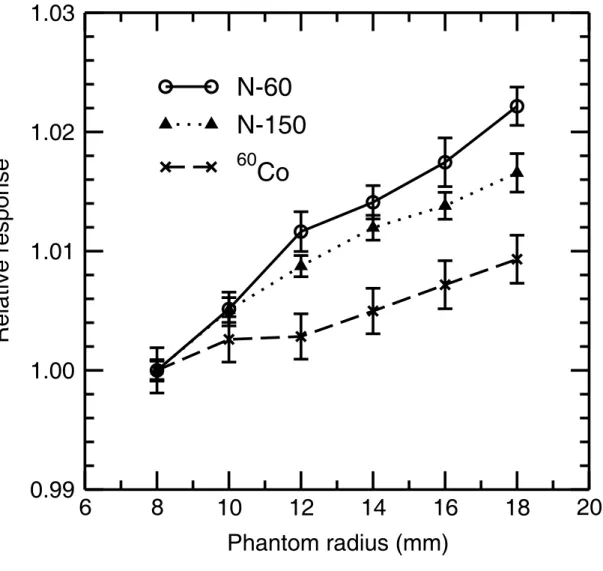
As described in Section 3.3.4, several different models of the phantoms used to hold the TLDs were simulated, in order to determine the one that most closely represented the real phantom. For the simple model with a single chip embedded in the centre of a PMMA cylinder, the sensitivity as a function of phantom radius was studied for several different photon beams, with some examples shown in Figure 3.3. For each of the examples, the results were normalized to the calculated dose to the TLD for a phantom with a radius of8 mm. In this way, the results from DOSRZnrc could be used directly, in terms of dose per unit of incoming photon fluence.
The results from the ISO narrow spectrum 60 kV beam (N-60) were the most sensitive to the phantom radius, with a 2.2% increase in the calculated dose for a phantom with 18 mm radius compared to the phantom with 8 mm radius. The increase in TLD dose for a larger phantom was due to Compton scattered photons from the sides of the phantom directed back towards the TLD. At high photon energies, Compton scattered photons tend to be scattered in the forward direction, but this tendency decreases as the photon energy decreases, with greater probability for photons with large scattering angles (Johns and Cunningham 1983). At very low photon energies, the photoelectric interaction predominates over Compton scattering, producing photoelectrons with a relatively short range. The N-60 beam had high enough photon energy so that many of the photon interactions in the sides of the phantom were Compton interactions, but low enough energy so that many of the Compton scattered photons had a large enough scattering angle to be directed towards the TLD.
Several simulations were also performed using a 16 mm phantom radius as in the real phantom, but with a ring of TLD material centred at 9 mm from the central axis. This model
6
8
10
12
14
16
18
20
Phantom radius (mm)
0.99
1.00
1.01
1.02
Relative response
N-60
N-150
60Co
Figure 3.3: Calculated dose to the TLD as a function of phantom radius for several different photon beams. The results are normalized to the response for the 8 mm phantom radius.
maintained the cylindrical symmetry necessary for the user code, and correctly modelled the placement of the TLDs relative to the rest of the PMMA phantom, but distorted the shape of the TLDs themselves. For each of the photon beams, the ring model results corresponded well with a phantom radius of 13 mm in the centred-chip model.
In the earlier TLD work performed at the NRC (Shortt et al 1997) several measurements were performed using phantoms with different wall thicknesses, using 137Cs and 60Co photon beams. The TLD-100 chips used were thicker than in the current work, but the phantoms used for the irradiations had the same radius and TLD positions as the current phantoms. To test the validity of the various possible phantom models to be used in the Monte Carlo calculations, simulations of some of the experiments by Shortt et al were conducted and the results were compared to the experimental data. The dose to the TLD per unit incident fluence was divided by the calculated air kerma per unit fluence to determine the dose per unit air kerma for each of the front wall thicknesses, for both 137Cs and 60Co. A small 1/r2 correction was applied to the air kerma calculations to bring the point of measurement from the front face of the phantom to the centre of the TLD.
The experimental measurements from Shortt et al were in terms of air kerma response, normalized to the 60Co response for a set of reference measurements. The experimental results as a function of PMMA front wall thickness are presented in Figure 3.4. The experimental results for each wall thickness were divided by the calculated dose per unit air kerma for that thickness, to determine the TLD dose response. One set of results is presented in Figure 3.5, using the calculated results for the phantom model with the radius of 13 mm, for both 137Cs and 60Co. The dose response should have been independent of the front wall thickness for any given photon beam, as long as the photon and electron spectra did not change much with increasing wall thickness. Least squares fits were performed on the 137Cs and 60Co datasets, with the resulting trendlines shown in Figure 3.5. For the 13 mm model, there appeared to be a slight under-response with increasing wall thickness for both of the sources, amounting to a 0.2% decrease from the thinnest to the thickest front walls. This suggested that the photon scatter in the phantom simulations might have been slightly overestimated, but would likely not have a large effect on the final results. For comparison, the results using the phantom with an 8 mm radius
0
2
4
6
8
10
12
14
Front wall thickness (mm)
0.96
0.98
1.00
1.02
1.04
Relative air kerma response
137
Cs
60
Co
0
2
4
6
8
10
12
14
Front wall thickness (mm)
1.06
1.07
1.08
1.09
1.10
1.11
1.12
1.13
1.14
Relative dose response
137
Cs
60
Co
Figure 3.5: Measured TL response from Shortt et al per unit calculated dose, using a phantom model with a radius of 13 mm. A slight under-response of about 0.2% is evident for the thickest walls compared to the thinnest walls, which suggests that the calculated scatter component was overestimated.
Using the results from Figure 3.5, the ratio of the TLD dose response from 137Cs to 60Co was calculated to be 1.023 ± 0.002. This is in agreement with the measured ratio of 1.025 ± 0.007 from Shortt et al, using more measurement data and empirically derived correction factors for the front and back walls. In Shortt et al, the ratio was actually based on the air kerma response, which would be expected to be 0.1 – 0.2% higher for 137Cs than for 60Co based solely on the relevant mass energy-absorption coefficients.
Based on the good agreement between the experimental and calculated results, and the good agreement with the simulations using a ring of TLD material, the phantom model using a single centred chip and a 13 mm radius was used for the subsequent Monte Carlo simulations.
3.4.2
Dose calculation results
The results of the TLD dose calculations and the air kerma calculations are presented in Table 3.2 and Table 3.3, for TLD-100H and TLD-100 using both the XCOM and the Storm and Israel photo-absorption cross sections. A small 1/r2 correction was applied to the air kerma calculations to bring the point of measurement from the front face of the phantom to the centre of the TLD. The calculated doses per unit air kerma using the XCOM cross sections are presented in Figure 3.6, along with the predictions of the simple model described in Section 3.1. Error bars are not shown in the plot, since the statistical uncertainty on each of the points was only 0.1%.
The Monte Carlo calculated doses per unit air kerma for the 137Cs and 60Co beams were within 1% of the results from the simple model, which neglected photon attenuation and scatter within the phantom. For the lower photon energies, the Monte Carlo results were up to 12% higher than the predictions of the simple model. At low photon energies, scattered photons contributed a significant fraction of the dose to the TLD, but were not taken into account in the simple model. In addition, the presence of dopants in TLD-100H with higher atomic numbers than fluorine increased the probability for photoelectric interactions at low photon energies, which caused an increase in the deposited dose. The decrease in the calculated dose for the N-30 beam relative to the N-40 beam was mostly due to a decrease in the relative contribution from
iF for Envir
onmental Dosimetry (January 2003)
45 (Gy / Gy) 1.242 1.285 1.238 1.133 1.051 0.986 0.959 0.952 0.924 0.919 (Gy / Gy) 1.208 1.253 1.211 1.117 1.042 0.983 0.958 0.951 0.924 0.920 (Gy·cm ) 1.503 · 10-12 8.450 · 10-13 4.527 · 10-13 3.345 · 10-13 3.342 · 10-13 4.390 · 10-13 6.387 · 10-13 8.448 · 10-13 2.633 · 10-12 4.144 · 10-12 (Gy·cm) 1.462 · 10-12 8.236 · 10-13 4.431 · 10-13 3.297 · 10-13 3.314 · 10-13 4.378 · 10-13 6.381 · 10-13 8.445 · 10-13 2.633 · 10-12 4.146 · 10-12 (Gy·cm) 1.215 · 10-12 6.599 · 10-13 3.671 · 10-13 2.962 · 10-13 3.192 · 10-13 4.470 · 10-13 6.683 · 10-13 8.908 · 10-13 2.886 · 10-12 4.565 · 10-12 (keV) 24 32 47 65 83 117 164 207 612 1055 N-30 N-40 N-60 N-80 N-100 N-150 N-200 N-250 137 Cs 60 Co
Table 3.2: Results of TLD dose calculations and air kerma calculations using XCOM photo-absorption cross
PIRS-0832 1.288 1.236 1.133 1.050 0.985 0.959 0.951 0.924 0.919 1.255 1.210 1.117 1.041 0.982 0.958 0.951 0.924 0.919 8.244 · 10 4.440 · 10-13 3.317 · 10-13 3.324 · 10-13 4.378 · 10-13 6.380 · 10-13 8.438 · 10-13 2.633 · 10-12 4.142 · 10-12 8.032 · 10 4.345 · 10-13 3.271 · 10-13 3.297 · 10-13 4.366 · 10-13 6.374 · 10-13 8.436 · 10-13 2.634 · 10-12 4.144 · 10-12 6.422 · 10 3.605 · 10-13 2.939 · 10-13 3.178 · 10-13 4.461 · 10-13 6.678 · 10-13 8.906 · 10-13 2.885 · 10-12 4.565 · 10-12 32 47 65 83 117 164 207 612 1055 N-40 N-60 N-80 N-100 N-150 N-200 N-250 137 Cs 60 Co
Table 3.3: Results of TLD dose calculations and air kerma calculations using Storm and Israel photo-absorption
10
100
1000
Mean photon energy (keV)
0.9
1.0
1.1
1.2
1.3
D
TLD/
K
aTLD-100H
TLD-100
Simple model
Figure 3.6: DTLD / Ka for TLD-100 and TLD-100H, compared with the prediction from the
simple model, using the XCOM photo-absorption cross sections. The statistical uncertainty on each point is 0.1%.