PROBING TRAPPIST-1-LIKE SYSTEMS WITH K2
Brice-Olivier Demory1, Didier Queloz1, Yann Alibert2, Ed Gillen1, Michael Gillon3
Accepted to ApJL on 15 June 2016 ABSTRACT
The search for small planets orbiting late M dwarfs holds the promise of detecting Earth-size planets for which their atmospheres could be characterised within the next decade. The recent discovery of TRAPPIST-1 entertains hope that these systems are common around hosts located at the bottom of the main sequence. In this Letter, we investigate the ability of the repurposed Kepler mission (K2) to probe planetary systems similar to TRAPPIST-1. We perform a consistent data analysis of 189 spectroscopically confirmed M5.5 to M9 late M dwarfs from campaigns 1-6 to search for planet candidates and inject transit signals with properties matching TRAPPIST-1b and c. We find no transiting planet candidates across our K2 sample. Our injection tests show that K2 is able to recover both TRAPPIST-1 planets for 10% of the sample only, mainly because of the inefficient throughput at red wavelengths resulting in Poisson-limited performance for these targets. Increasing injected planetary radii to match GJ 1214 b’s size yields a recovery rate of 70%. The strength of K2 is its ability to probe a large number of cool hosts across the different campaigns, out of which the recovery rate of 10% may turn into bona-fide detections of TRAPPIST-1 like systems within the next two years.
Subject headings: planetary systems - techniques: photometric
1. INTRODUCTION
The recent discovery of TRAPPIST-1 (hereafter T-1
Gillon et al. 2016) from a relatively small target sample (N∼50) suggests that small planets are frequent around late M dwarfs (hereafter LMD, M5.5 to M9 spectral type). This discovery indeed confirms that an untapped population of small planets exists around late M hosts, similar to what has been expected from core accretion models (Payne & Lodato 2007;Alibert et al. 2011). The interest in small planets orbiting LMD is justified by their enhanced detectability compared to solar analogues and the unprecedented opportunity they offer for atmo-spheric characterisation with near-to-come facilities such as JWST (Seager 2014).
While LMD are abundant, they are faint in the Ke-pler bandpass (5% throughput at 900nm; Koch et al. 2010), which limits Kepler’s ability to observe them with high precision. Another complicating factor is Kepler data cadence of 30 min used for the vast majority of targets, which is similar to typical transit durations of short-orbital period planets orbiting LMD. The large col-lecting area and quasi-continuous monitoring of about 80 days per campaign counter-balance, to some extent, the quenching at longer wavelengths and limited time-sampling of the transits.
Demory et al. (2013) proposed an effort to search for Earth-size planets orbiting LMD and brown dwarfs with K2. In this Letter, we reflect on 1.5 years of K2 data and the discovery of T-1 to examine how K2 contributes to the search of planets orbiting LMD. More specifically, we study the sensitivity of K2 to planetary systems similar
1Astrophysics Group, Cavendish Laboratory, J.J. Thomson
Avenue, Cambridge CB3 0HE, UK. [email protected]
2Physikalisches Institut & Center for Space and Habitability,
Universit¨at Bern, 3012 Bern, Switzerland.
3Institut d’Astrophysique et de Geophysique, Universite de
Liege, Allee du 6 Aout 17, Bat. B5C, 4000 Liege, Belgium.
to T-1 and put constraints on the properties of the pop-ulation of planets orbiting hosts located at the bottom of the main sequence.
2. OBSERVATIONS
K2 has been observing LMD since Campaign 0. Each corresponding field of view is located close to the eclip-tic to mitigate drifts of the telescope boresight due to differential solar radiation pressure (Howell et al. 2014). K2 datasets are unprecedented for LMD because they provide a unique opportunity to search and characterise variability patterns over long timescales compared to the relatively fast rotation period of LMD (e.g. Reiners & Basri 2010;West et al. 2015).
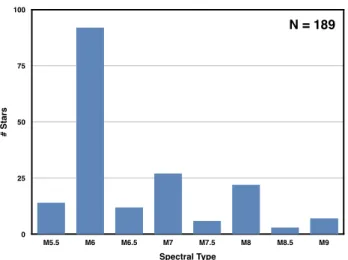
We base this Letter on a total of 189 M5.5-M9 stars that have been observed in K2’s Campaigns 1-6, obtained between March 2014 and September 2015. The magni-tudes in the Kepler bandpass range from 14.5 to 23.9. We select only those targets that are confirmed spectro-scopically, which allows us to constrain better the host properties for the purpose of transit searches and alle-viate contamination from false positives. This selection is done by cross-matching the available K2 targets with spectroscopically confirmed sources from Cruz & Reid
(2002); Cruz et al. (2003, 2007); Lodieu et al. (2007);
Reid et al.(2007,2008);Slesnick et al.(2006,2008);West et al. (2008). We use this spectral classification to esti-mate the radius of each target using evolutionary models (Baraffe et al. 2015). Figure1 shows the distribution of our target sample as a function of spectral type.
3. DATA ANALYSIS
3.1. Data Reduction
We describe in this section how we perform the data reduction of the K2 data. Our pipeline uses the K2 pixel-level files (TPF) as input data. The TPF files are down-loaded from the Mikulski Archive for Space Telescopes
# Sta rs 0 25 50 75 100 Spectral Type M5.5 M6 M6.5 M7 M7.5 M8 M8.5 M9 N = 189
Fig. 1.— Spectral type distribution of our sample K2 LMD. This histogram shows the spectral distribution of targets that are part of our sample during Campaigns 1 to 6.
(MAST4
). Each TPF file is a datacube that includes all frames for a given target. Each frame contains all pix-els included in the mask for a given target. Because of the telescope jitter and repointing, each frame encom-passes significant margins along the x and y axes to keep the target in the aperture. As the LMD observed within this programme are faint and the masks large enough to include other stars (in addition to the ones we are in-terested in), our code first identifies the location of the star on the frame based on the target coordinates. We then use a PSF centroiding algorithm on each frame to precisely locate the target on the detector, which will be useful in a second stage for mitigating the photometric systematics. We finally perform simple aperture pho-tometry on individual frames, with star and sky aper-tures centred on the target position determined in the previous step. We test different aperture sizes and use a portion of the light curve to measure the RMS and level of correlated noise (e.g. Demory et al. 2016) to deter-mine the aperture that minimises both quantities. We eliminate outliers based on datapoints having significant positive median absolute differences (Hoaglin et al. 1983) from the median. The remainder of the data are then ingested into a Markov Chain Monte Carlo (MCMC) framework that includes a polynomial detrending from the centroid position (Demory et al. 2011) previously measured, as well as longer-term trends that are of in-strumental or astrophysical origin. The MCMC fit com-putes uncertainties that include the contribution from correlated noise in the data (Winn et al. 2008; Gillon et al. 2010) and errors in coefficients used in the poly-nomial detrending. The photometric RMS is then com-puted on the final, detrended light curve. We perform further attempts to improve the light curve extraction by using custom, non-circular-shaped apertures for some targets. A non-circular aperture avoids inclusion of pix-els that contains mostly background noise. For this step, we compute for each target a baseline flux value that cor-responds to the median of the pixel fluxes where no star is detected, thus containing only background signal. We then define the photometric aperture by selecting only
4http://archive.stsci.edu/k2/
the pixels located at the target location with flux values larger than the median background flux multiplied by a coefficient that is based on the target’s magnitude. We find this approach results in a slightly better photomet-ric RMS for the fainter objects of our sample. We finally compare our photometric reduction with publicly avail-able corrected lightcurves (K2SC, K2SFF, K2VARCAT;
Aigrain et al. 2016; Vanderburg & Johnson 2014; Arm-strong et al. 2016), all available from MAST. We ran-domly select 10 targets across our sample and find the photometric RMS to be consistent between these three methods and ours.
3.2. Planet search
We then perform a transit search using a box least-squares fitting algorithm (BLS; Kov´acs et al. 2002). We set the BLS to orbital periods ranging from 0.8 days to half of the duration of the Campaign (∼ 40 days). The ratio of the transit duration over the planet orbital pe-riod is further set between 0.0007 and 0.06 to include a wider range of orbital periods, eccentricities and impact parameters than the T-1bc planets. We note that the transit duration of planets orbiting LMD can be as short as 20 min for 1-day orbital periods. Because of the Ke-pler 30-min cadence photometry, these transits appear significantly smeared out. Long cadence data could thus potentially hamper the detectability of close-in planets with short transit durations. Our pipeline returns for each star the raw/corrected photometry, the stellar mo-tion over the entire campaign duramo-tion, and the transit search results.
Among the 189 LMD that are part of our sample, our BLS analysis yields no transiting candidate detection at a 4-σ detection level or above. We explore the possible reasons for this null result below.
4. TRANSIT INJECTION TESTS
In the following we explore whether the null result re-garding our transit search is due to an insufficient sensi-tivity of K2 to planets transiting LMD. More specifically, in the light of the recent discovery of T-1, we investigate whether our dataset is able to put constraints on the frequency of tight planetary systems orbiting LMD.
4.1. Recovery of TRAPPIST-1-like systems We first model a lightcurve of T-1b (P=1.51d, RP= 1.11 R⊕) and c (P=2.42d, RP= 1.05 R⊕) using the sys-tem parameters published in Gillon et al.(2016). While the transits are modelled using a 30s cadence, we inte-grate them to the K2 30-min long-cadence at which the observations are obtained. The T-1bc planets are then injected in the K2 raw photometry, just after the flux extraction from the TPF files. The transit depths are multiplied by a factor that is the squared ratio of stellar radius between T-1 and the target. We then perform the different steps detailed in Sect.3.1 with the exact same sequence. The goal of this part of the analysis is to assess how frequently we detect T-1b and c planets, together or separately. We run the BLS analysis a first time, iden-tify the signal with the maximum signal-to-noise ratio in the periodogram, remove the corresponding data from the corrected phased-lightcurves and run a second BLS analysis. We consider each planet to be successfully
re-R e c o v e ry R a te 0 % 20 % 40 % 60 % 80 %
Planet Size (Earth radii)
1.0 1.5 2.0 2.68
T-1b period T-1c period
Fig. 2.— Recovery rates for TRAPPIST-1 planets. This histogram shows the percentage of recovery for planets that have been injected in the LMD that are part of our sample. The dark and light bars are the recovery rates for planets with the orbital periods of T-1b and T-1c respectively, assuming radii spanning 1 to 2.68 R⊕.
covered if the deduced orbital period matches the input model transit data at 2% or less.
Across the 189 systems that are part of our sample, we find that we are able to recover T-1b and T-1c for 20 (11%) and 12 (6%) targets respectively. For most cases, the Poisson noise is too large to enable a clear detec-tion of the planets injected in the photometry, leading to false alarms. We find as well that, as expected, the depth recovered by the BLS is impacted by the data sam-pling. For both T-1b and c, a single photometric point only is located in-transit, and since the orbital period of the planet is not an exact multiple of 30-min, the in-transit point shifts in phase, hence its apparent depth. This reduces the peak power in the BLS spectrum and artificially reduces the strength of the planetary signal. 4.2. Sensitivity to “inflated” TRAPPIST-1-like systems
We repeat the same analysis as above but injecting this time planets with radii that are 1.5 and 2× larger than the T-1bc planets, while retaining all other orbital prop-erties. We find that for a 1.5 scale factor, the recovery rate is 31% for T-1b and 19% for T-1c. Injecting transits of planets that are twice as large yields recovery rates of 56 and 40% for T-1b and T-1c respectively.
We finally conduct injection tests of planets similar to GJ 1214 b in size, using a published radius of 2.68 R⊕ (Charbonneau et al. 2009) for both T-1b and T-1c. We find in that case recovery rates of 71% and 67% for T-1b and T-1c respectively.
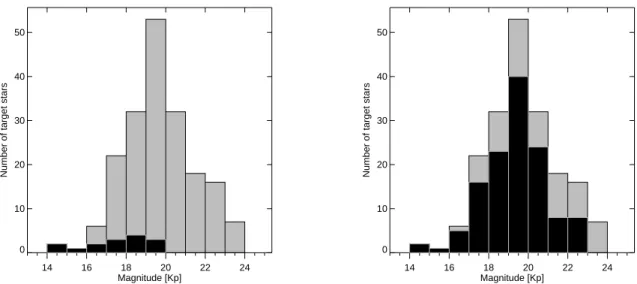
All recovery rates are shown in Fig. 2 for T-1b and T-1c. We show in Fig. 3the Kp magnitude distribution of target stars (grey) and superimpose the subsample for which the signal is recovered (black) for a planet with a size equal to T-1b (left) and GJ 1214 b (right).
5. PLANET FORMATION MODELS
We have computed planet formation models in the framework of the core-accretion scenario, focussing on LMD (0.1 M ). Our model is based on the models of Alibert et al.(2013) andFortier et al.(2013). They both
take into account the structure of the protoplanetary disk and its evolution, the migration of the planet, as well as the computation of the planetary growth and composi-tion.
The mass of the star is included in the models via dif-ferent aspects (Alibert et al. 2011), the most important being the distribution of the disk masses, which is dif-ferent from the one used for solar-type stars, and follows the relation
Mdisk∝ Mstar1.2 (1) Figure 4 shows the radius distribution resulting from our models, for planets inside 0.1 AU. As can be seen on Fig.4, the distribution of radii extends from ∼ 0.5 to ∼ 1.4 R⊕, with the majority of planets having a radius of the order of 1 R⊕ or smaller. These values are similar to the ones of the recently discovered T-1bcd planets (Gillon et al. 2016), and we find no planet to be formed with a substantially larger radius. As shown in Fig. 4, the recovery rate for these synthetic planets is expected to be small (of the order of 20 % maximum).
Some of these planets harbour a non negligible frac-tion of water, because they start their formafrac-tion process beyond the iceline (the iceline is located between ∼0.2 and ∼1 AU, depending on the mass of the protoplane-tary disk). Interestingly, precise enough determination of the planetary bulk density can allow the determina-tion of the fracdetermina-tion of volatiles, for the shortest period planets. Indeed, if evaporation is efficient enough, short-period low-mass planets cannot retain a gas atmosphere, and the degeneracy in the determination of the planetary composition is reduced (Alibert 2016).
6. DISCUSSION
6.1. K2 sensitivity to TRAPPIST-1-like systems The first conclusion of this Letter is that across the 189 LMD that are part of our sample, we would have been able to detect the T-1 b and c planets for only ∼10% of the targets. Our pipeline efficiently takes correlated noise and stellar variability into account. The dominant source of noise is mostly white and points to the limited performance of K2 to obtain precision photometry for cool and faint LMD.
Assuming that each star was hosting such a system (oc-currence rate of 1), and assuming a 100% recovery rate and a geometric transit probability of ∼5% for these sys-tems, we should have detected about 5 systems per 100 targets. However, the fact that our recovery efficiency on this sample for T-1-like systems is only 10% means that we would have recovered 0.95 systems across our sample, which is consistent with our non-detection. We estimate that a total of ∼1000 well characterised LMD will be observed by the end of 2018 by K2, if the mis-sion is extended at the next NASA senior review. If the trend in occurrence rate of planets orbiting Kepler early M stars (Dressing & Charbonneau 2013) extends into the LMD regime, we should expect K2 to be able to detect up to ∼5 of these Earth-size systems within the next 2 years. However, if the occurrence rate of TRAPPIST-1-like systems is lower than 20%, no detections from K2 are expected.
Figure 3 (left) shows that K2 sensitivity to T-1b-like planets orbiting LMD extends to Kp∼20, and the
re-14 16 18 20 22 24 Magnitude [Kp] 0 10 20 30 40 50
Number of target stars
14 16 18 20 22 24 Magnitude [Kp] 0 10 20 30 40 50
Number of target stars
Fig. 3.— Detectability of TRAPPIST-1b-like planets. Distribution of targets included in our sample (grey). Left: distribution of targets for which the injected T-1b signal is correctly recovered (black). Right: distribution of targets for which the injected planet with a period equal to T-1b but with RP=2.68R⊕is correctly recovered (black).
Fig. 4.— Planetary radii for planets orbiting a T-1-like star from the formation models ofAlibert et al.(2013) and
Fortier et al. (2013). Distribution of planet radii, for planets
located inside 0.1 AU of the central star. The radius is computed using the method presented inAlibert(2014).
covery rate decreases in a Poisson-limited regime down to the tail of the sample magnitude distribution (i.e. Poisson-limited performance yields no detections for Kp>20.
6.2. A possible lack of close-in super-Earth-size exoplanets orbiting late M dwarfs
The second conclusion of this Letter is that despite our ability to detect companions larger than the T-1bc planets the orbiting LMD, we find no objects that are 1.5 times the size of the T-1b or larger. When injecting T-1bc planets with 1.5 times the size of the Earth (super-Earth regime), we find that these planets are fully recov-ered for ∼31% of the target sample for orbital periods similar to T-1b. We should thus have found 31% recov-ered × 189 hosts × 5.4% transit probability = 3.2 plan-ets, assuming an occurrence rate of 1. Similarly, when using a size factor of 2.0 rather than 1.5, we would have found 5.7 such “inflated” T-1b-like planets within our sample.
The cause for this null result regarding the planet search in the present sample could be multi-fold. First, larger exoplanets may orbit farther from their host, thus reducing their probability of transit significantly, which would render our observations consistent with non-detections. Second, the distribution of the frequency of planets around LMD may peak towards smaller radii than it does for more massive hosts, as suggested from planet formation models (Sect. 5). Assuming that the ratio of the disk mass to the host star mass is constant from solar to the brown-dwarf regime, as shown from FIR observations of young systems (e.g.Mohanty et al. 2013), LMD would form mostly small planets. Third, the occur-rence rate for these planets may be significantly smaller than 1.
It is worth noting as well that for a given dataset we have 1.6 times the number of transits of T-1b compared to T-1c and both have similar depths. Thus, we would expect, all other things being equal, to have a ratio in re-covery rates of 1.3. We find that this factor does not fully explain the discrepancy in recovery rate for our injection tests of Earth-size planets but accounts for the differ-ence in recovery ratio between T-1b and T-1c for the 1.5 and 2.0 Earth radii particularly well (see Sect.4). This suggests that the lightcurves are dominated by Poisson statistical noise, except for the lower amplitude signals, where residual correlated noise of astrophysical or
instru-mental origin likely complicate the retrieval of the indi-vidual transits. Another useful check is to compute the ratio of recovered signals vs. the planetary sizes. For 1.5 and 2.0 size factors, the corresponding transit depth is 2.25 and 4 times larger. From our T-1b recovery rates of 11, 31 and 56%, the corresponding factors are 2.8 and 5.1, which are both in good agreement. For T-1c, the recovery rates are 6, 19 and 40%, yielding factors of 2.7 and 5.8, suggesting that the shorter period of T-1b makes its recovery easier especially for small planetary sizes.
6.3. A lack of close-in mini-Neptune exoplanets orbiting late M dwarfs
The third conclusion of this paper is that while K2 has excellent sensitivity to mini-Neptune exoplanets, similar in size to GJ 1214 b, none are found in our sample. Our injection tests confirm, however, that these objects would have been found in our sample and we would have ex-pected to find 71% recovered × 189 hosts × 5.4% transit probability = 7.2 planets, assuming an occurrence rate of 1 planet per star. Our findings suggest that the oc-currence rate of mini-Neptunes orbiting LMD is likely an order of magnitude smaller at least, making them rare around this population of targets, similar to early-/mid- and late-M stars as shown by observations ( Dress-ing & Charbonneau 2013; Berta et al. 2013) and mod-els (Sect.5) respectively. Contrary to T-1b-like planets, Fig.3 (right) shows that the detectability of GJ 1214 b-like planets orbiting LMD extend to Kp∼23 and that the limitation is not from Poisson noise anymore. Rather, the recovery rate is almost constant between Kp∼16 and 21 and drops afterwards. We find that no GJ 1214 b-like planet is recovered beyond Kp∼23, which is consistent with our sensitivity for T-1b-like planets discussed at the beginning of this Section. The origin of this plateau is thus due to a non-optimal recovery rate at the mid-magnitude range of our sample before Poisson-limited noise dominates again, possibly due to a larger activity level of a sub-sample of our targets.
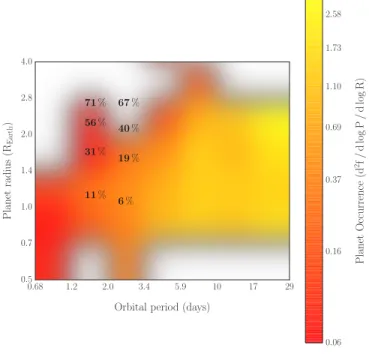
We show a summary of our findings in Fig.5. This di-agram shows the occurrence rate of Kepler planets pub-lished for early- and mid-M stars (Dressing & Charbon-neau 2013) and the superimposed numbers indicate our recovery rate (in percent) at the orbital periods of T-1b and c for different planet radii. Assuming that this oc-currence rate distribution extends into the LMD regime, Fig. 5 shows that K2 is relatively inefficient at detect-ing planets with radii Rp. 1.4R⊕, where the occurrence rate peaks for 1.51 (T-1b) and 2.42 (T-1c) days. How-ever, formation models produce only few planets at sep-arations smaller than <0.05 AU (Fig. 4). If models are right, it means that there is a strong transition in the occurrence rate of planets between early and late-type M dwarfs and that the discovery of T-1 out of ∼50 tar-gets monitored in the TRAPPIST survey had a very low
probability of detection. Alternatively, models could be missing important ingredients that future monitoring of similar systems may help to constrain.
K2 relies on its ability to quasi-continuously monitor several thousands of targets over 80 days for each cam-paign. By the end of 2018, we may expect K2 to discover one or two systems similar to T-1 and a handful of super-Earth systems if their occurrence rate is similar to the one deduced from the Kepler primary mission’s M stars.
0.68 1.2 2.0 3.4 5.9 10 17 29
Orbital period (days)
4.0 2.8 2.0 1.4 1.0 0.7 0.5 Planet radius (R Earth ) 11 % 6 % 31 % 19 % 56 % 40 % 71 % 67 % 0.06 0.16 0.37 0.69 1.10 1.73 2.58 Planet Occurrence (d 2f / d log P / d log R)
Fig. 5.— Planet occurrence and K2 recovery rate. The planet occurrence rate from Dressing & Charbonneau (2013) is shown in coloured scale (low to high, red to yellow). White areas represent the absence of detections in the corresponding period-radius bins. The recovery rate (in percent) of planets injected in our sample LMDs at the orbital periods of T-1b and c are shown superimposed for different planet radii.
We finally note that we have proposed K2 observations of TRAPPIST-1 in Campaign 12. Because this target is bright, it is part of the 10% subsample for which we will be able to precisely characterise the transits of the known planets and search for other companions in this remarkable system.
We thank the anonymous referee for an helpful review. Part of this work has been carried out within the frame of the National Centre for Competence in Research Plan-etS supported by the Swiss National Science Foundation. YA acknowledges the financial support of the SNSF. M. Gillon is Research Associate at the Belgian F.R.S-FNRS. This paper includes data collected by the K2 mission. Funding for the K2 mission is provided by the NASA Science Mission directorate.
Facility: K2 REFERENCES
Aigrain, S., Parviainen, H., & Pope, B. J. S. 2016, MNRAS Alibert, Y. 2014, A&A, 561, A41
—. 2016, ArXiv e-prints
Alibert, Y., Carron, F., Fortier, A., et al. 2013, A&A, 558, A109 Alibert, Y., Mordasini, C., & Benz, W. 2011, A&A, 526, A63
Armstrong, D. J., Kirk, J., Lam, K. W. F., et al. 2016, MNRAS, 456, 2260
Baraffe, I., Homeier, D., Allard, F., & Chabrier, G. 2015, A&A, 577, A42
Charbonneau, D., Berta, Z. K., Irwin, J., et al. 2009, Nature, 462, 891
Cruz, K. L., & Reid, I. N. 2002, AJ, 123, 2828
Cruz, K. L., Reid, I. N., Liebert, J., Kirkpatrick, J. D., & Lowrance, P. J. 2003, AJ, 126, 2421
Cruz, K. L., Reid, I. N., Kirkpatrick, J. D., et al. 2007, AJ, 133, 439
Demory, B.-O., Gillon, M., Madhusudhan, N., & Queloz, D. 2016, MNRAS, 455, 2018
Demory, B.-O., Gillon, M., Deming, D., et al. 2011, A&A, 533, 114
Demory, B.-O., Seager, S., Lissauer, J., et al. 2013, ArXiv e-prints Dressing, C. D., & Charbonneau, D. 2013, ApJ, 767, 95
Fortier, A., Alibert, Y., Carron, F., Benz, W., & Dittkrist, K.-M. 2013, A&A, 549, A44
Gillon, M., Lanotte, A. A., Barman, T., et al. 2010, A&A, 511, 3 Gillon, M., Jehin, E., Lederer, S. M., et al. 2016, Nature, advance
online publication,
Hoaglin, D., Mosteller, F., & Tukey, J. 1983, Understanding robust and exploratory data analysis, Wiley series in probability and mathematical statistics: Applied probability and statistics (Wiley)
Howell, S. B., Sobeck, C., Haas, M., et al. 2014, PASP, 126, 398
Koch, D. G., Borucki, W. J., Basri, G., et al. 2010, ApJ, 713, L79 Kov´acs, G., Zucker, S., & Mazeh, T. 2002, A&A, 391, 369 Lodieu, N., Hambly, N. C., Jameson, R. F., et al. 2007, MNRAS,
374, 372
Mohanty, S., Greaves, J., Mortlock, D., et al. 2013, ApJ, 773, 168 Payne, M. J., & Lodato, G. 2007, MNRAS, 381, 1597
Reid, I. N., Cruz, K. L., & Allen, P. R. 2007, AJ, 133, 2825 Reid, I. N., Cruz, K. L., Kirkpatrick, J. D., et al. 2008, AJ, 136,
1290
Reiners, A., & Basri, G. 2010, ApJ, 710, 924
Seager, S. 2014, Proceedings of the National Academy of Sciences Slesnick, C. L., Carpenter, J. M., & Hillenbrand, L. A. 2006, AJ,
131, 3016
Slesnick, C. L., Hillenbrand, L. A., & Carpenter, J. M. 2008, ApJ, 688, 377
Vanderburg, A., & Johnson, J. A. 2014, PASP, 126, 948
West, A. A., Hawley, S. L., Bochanski, J. J., et al. 2008, AJ, 135, 785
West, A. A., Weisenburger, K. L., Irwin, J., et al. 2015, ApJ, 812, 3
Winn, J. N., Holman, M. J., Torres, G., et al. 2008, ApJ, 683, 1076