Distributed load interruption and shedding
against voltage delayed recovery or instability
Bogdan Otomega Power Systems Department University Politehnica of Bucharest
Bucharest, Romania bogdan.otomega@upb.ro
Thierry Van Cutsem Fund for Scientific Research (FNRS)
Dept. of Electrical Engineering and Computer Science University of Liège, Belgium
t.vancutsem@ulg.ac.be Abstract— This paper deals with a two-part system integrity
protection scheme to be installed in distribution networks, to counteract fault-induced delayed voltage recovery or even short-term voltage instability due to induction motors. The first part consists of a fast triggered but temporary reduction of some loads to facilitate motor re-acceleration after fault clearing. The second part resorts to load shedding, as a back-up. The scheme relies on purely distributed controllers; each of them measures a bus voltage and interrupts/disconnects load at the same bus. Tests have been performed on a generic MV/LV system. They illustrate the benefit of load interruption and the selectivity of the proposed scheme.
Index Terms--Fault-induced delayed voltage recovery, short-term voltage instability, system integrity protection schemes, load shedding, load interruption.
I. INTRODUCTION
Fault-Induced Delayed Voltage Recovery (FIDVR) is defined as the phenomenon whereby the voltage remains at significantly reduced levels for several seconds after the clearing of a fault [1]. FIDVR is caused mainly by induction motors re-accelerating after a severe voltage drop [2, 3]. This results in an excessive draw of current from the grid which depresses the voltage even more. In more severe cases, motors may stall, which results in short-term voltage instability.
Typically, large (e.g. industrial) motors are equipped with protections that disconnect them from the grid under low voltage conditions. Although this is not an acceptable remedial action, their tripping contributes to restoring system voltages. On the other hand, appliances with small motors are usually equipped with inexpensive thermal protections. Therefore, even after stalling, they remain connected for several seconds before disconnection takes place [4].
Several approaches have been proposed in order to mitigate FIDVR consequences. One solution is to increase the reactive power support using FACTS devices installed in the networks exposed to FIDVR [5, 6]. This solution may require investing in a large number of devices, which also have to react quite fast. Another solution is to use a System Integrity
Protection Scheme (SIPS) which, under low voltage conditions, rapidly curtails some part of the load, with the objective of restoring normal voltages at the terminal of the remaining loads. This load curtailment should not be confused with the above mentioned undervoltage motor tripping, which aims at protecting equipment against already depressed voltages. Some load shedding procedures against FIDVR were proposed in the literature. For instance, a slope-permissive undervoltage load shedding procedure was proposed in [7], based on the rate of voltage recovery and predicted time to recover. More recently, Ref. [8] proposed the identification of motor stalling status through the derived kinetic energy deviation.
Instead of merely disconnecting loads, a different approach consists of temporarily interrupting some (non essential) loads for a short period of time [9]. This technique is expected to become a reality in some future, in the context of demand side management through smart meters. The temporary load reduction leads to an increase of voltage that helps motors to re-accelerate, and could even prevent some of them from stalling. Once motors have regained normal operating conditions, the interrupted load can be reconnected.
In this paper the two approaches are combined into single SIPS implemented at distribution level, through local controllers actuating load interruption and load shedding, respectively, the latter acting as a back-up of the former.
The paper is organized as follows. Section II is devoted to describing how the above two controls have been modeled and coordinated. Simulation results are presented in Section III. Concluding remarks are offered in Section IV.
II. COMBINED LOAD INTERRUPTION AND LOAD SCHEDDING SCHEME
It is known that thermal loads, such as freezers, air conditioners, water heaters, etc. can be disconnected from the network for a short period of time without affecting their operation, nor impacting customers, due to the thermal inertia of the involved processes [10].
In order load interruption to be effective against FIDVR, it has to take place fast enough after the occurrence of a nearby fault. For this, as well as for reliability reasons, one can hardly envisage relying on information exchange between controllers located at different places throughout the network. This is why the scheme considered in this paper relies on a set of local controllers, each monitoring the voltage of a distribution bus and controlling the partial loads connected to the same bus, as sketched in Fig. 1. Load is interrupted when the monitored voltage remains below a time-varying threshold. The threshold evolves with time according to the piecewise linear characteristic shown with bold green line in Fig. 2 (the other curves in Fig. 2 will be referred to in the sequel). Load interruption takes place a little after the voltage drops below the value given by the characteristic. This delay, denoted τdel, accounts for measurement processing as well as for the opening of the dedicated circuits. The load is interrupted for a maximum duration denoted τint, or less if the monitored voltage recovers faster above the final threshold value (0.90 pu in Fig. 2).
Figure 1. Structure of the proposed scheme
Figure 2. Voltages at buses of feeder 13AC in the absence of SIPS, load interruption characteristic (in green), and load shedding characteristic (in red)
Of course, the main limitation lies in the amount of power available for interruption, which varies with time in a manner that is difficult to predict. Thus, the SIPS has to be robust with respect to this unknown amount. This is why it is complemented with load shedding.
The load shedding part of the scheme can be considered as a standalone protection (for instance, when little or no load is available for interruption) or as a back-up protection added to the above described load interruption scheme. It relies on the same distributed controllers and aims at acting on the remaining part of the load, mainly motor load, which is merely disconnected. The decision to disconnect the motor load is based on another piecewise linear characteristic, shown with bold red line in Fig.
2. With respect to the green (load interruption) characteristic, it includes an additional delay, in order load interruption to take place first, and its result to be assessed through the voltage measurements. The same delay τdel is considered in between the decision to curtail and the actual shedding.
Since the scheme acts in priority on the loads experiencing larger voltage drops, and since there are voltage differences from one bus to another, a satisfactory selectivity of both the interruption and the shedding part of the scheme has been observed in the tests, as reported in the next section. The shape of the characteristics also contributes to that selectivity.
III. SIMULATION SRESULTS
A. Test system and scenario
The proposed scheme has been tested on a typical Medium Voltage (MV) / Low Voltage (LV) distribution system, which was built for the purpose of demonstrating the method in a demanding situation. The one-line diagram of the considered test system is partially shown in Fig. 3. The system includes 14 LV feeders, each of them supplying 10 loads. Each of the 140 loads includes an equivalent motor and a non-motor, voltage dependent load. For the sake of simplicity the same fraction of motor load is considered for all loads, namely 60%. The feeders are connected two by two to the MV buses 4, 5, 7, 8, 10, 11 and 13, respectively. Larger motors are connected to the MV buses 6, 9 and 12.
Figure 3. Transmission and MV/LV distribution grid (partial view) Each equivalent induction motor has a 6-kVA rated apparent power, and its model accounts for the presence of a double-cage rotor. A synchronous machine with detailed model is connected to Node 2, contributing to voltage oscillations at distribution buses, which would not be observed using a mere Thévenin equivalent of the transmission system.
Each LV load bus is equipped with a load interruption- disconnection controller. It was chosen to let each controller
disconnect the motor part of its load and temporarily interrupt a fraction of its non-motor load. Again, for simplicity, the same fraction is considered for all controllers. Unless otherwise specified, the results have been obtained with τdel = 0.1 and τint = 2 s. Finally, it has been considered that interruption and shedding decisions are irrevocable, i.e. the action is taken even if the voltage recovers above the threshold in the τdel time interval.
The MV load buses are not endowed with such controllers as they are not subject to low voltages or motor stalling.
The disturbance considered in the tests reported here is a fault on one circuit of the line between Node 1 and Node 2 (see Fig. 3), cleared by opening the faulted circuit after 0.2 s.
The dynamic simulations (under phasor approximation) have been performed using the RAMSES software developed at the Univ. of Liège.
B. Without load shedding or interruption
The system behavior in the absence of any SIPS is shown first. Under the effect of the fault, 50 motors stall in cascade. Their location is identified in Table I. In this and similar tables, the rows refer to feeders and the columns to positions along each feeder (10 being the farthest from the 15/0.4 kV transformer). A black entry indicates a stalled motor. Expectedly, the stalled motors are the farthest from the entry point of the distribution system, i.e. Node 0 in Fig. 3.
TABLE I. STALLED MOTORS PER FEEDER WITHOUT SIPS 1 2 3 4 5 6 7 8 9 10 4AB 4AC 5AB 5AC 7AB 7 AC 8 AB 8 AC 10 AB 10 AC 11 AB 11 AC 13 AB 13 AC
Figure 4 shows the evolution of the speeds of motors located on feeder 13AC, farthest from Node 0. It is seen that seven motors stall (as confirmed by the last row in Table I). The corresponding voltages settle down to low, unacceptable values, as can be seen from Fig. 2.
C. With temporary load interruption
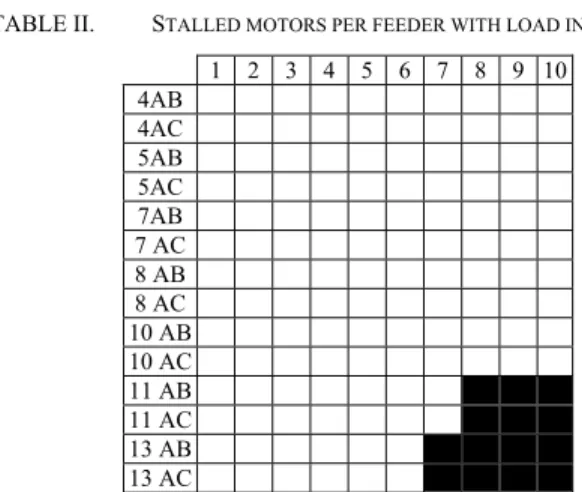
With the above mentioned settings, 130 loads out of the 140 are temporarily interrupted at different times, dictated by the voltage evolutions. Under the effect of this fast load reduction, some motors succeed re-accelerating, as can be seen in Fig. 5, to be compared with Fig. 4. In this case, only 14 motors stall, which is a remarkable improvement. Their locations are identified in Table II. A comparison with Table I shows that they make up a subset of the motors stalled in the absence of load interruption. These results, however, have been obtained assuming that as much as 80% of the non-motor loads can be interrupted.
Figure 4. Speeds of motors located on feeder 13AC, no SIPS
Figure 5. Speeds of motors located on feeder 13AC, with load interruption (80% of non-motor load power interruptible)
TABLE II. STALLED MOTORS PER FEEDER WITH LOAD INTERRUPTION
1 2 3 4 5 6 7 8 9 10 4AB 4AC 5AB 5AC 7AB 7 AC 8 AB 8 AC 10 AB 10 AC 11 AB 11 AC 13 AB 13 AC
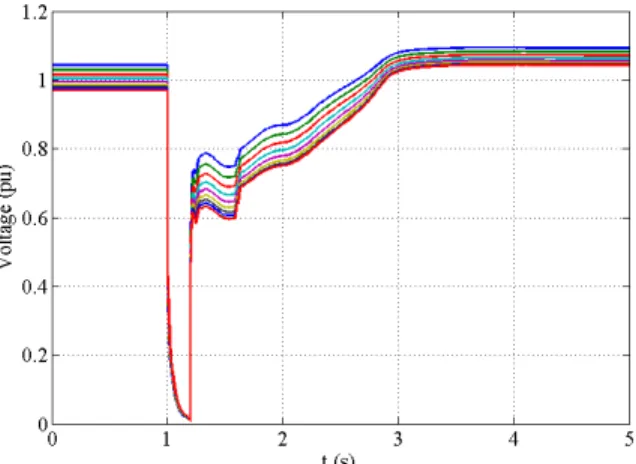
Figure 6 shows that voltages recover to higher values than without load interruption, but some of them are still low. This is due to the fact that the stalled motors remain connected and absorb a high current.
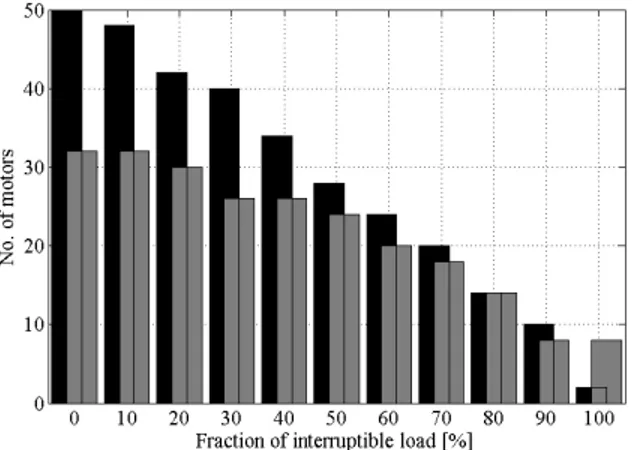
As already mentioned, the success of load interruption strongly depends on the fraction of load powers that can be temporarily interrupted. The results for various values of this fraction are shown in Fig. 7. The black bars give the number of stalled motors. Clearly, the lower the interruptible power, the higher the number of stalled motors. Nevertheless, even
low fractions (20 - 30%) of interruptible power lead to saving a significant number of motors (around 20% of the motors stalling without load interruption).
Figure 6. Voltages at buses of feeder 13AC, with load interruption (80% of non-motor load power interruptible)
Figure 7. Number of stalled motors for various percentages of interruptible load power and two load interruption characteristics
Various load interruption characteristics have been considered. For instance, a variant has been tested in which load is interrupted with the same delay τdel = 0.1 s but counted
as soon the monitored voltage drops below 0.50 pu. The results are shown with grey bars in Fig. 7. As can be seen, a lower number of motors stall; even no one stalls for high fractions of interruptible non-motor loads. Such a case is illustrated in Figs. 8 and 9, corresponding to 90% of interruptible load power. Under the effect of the fast interruption, motors succeed re-accelerating and voltages recover to acceptable values in less than 2 s. Thus, the speed with which the load interruption action is initiated (approximately 0.2 s earlier in the presented case) has a significant impact.
Interruption durations τint larger than two seconds have
been also tested but without noticeable effects. D. With load shedding
The results in this section refer to the motor disconnection part of the SIPS, assuming that no load is available for interruption. The results are shown in Figs. 10 and 11, respectively. Voltages recover faster and to very satisfactory
values, while the non-disconnected motors re-accelerate in a shorter time. This is explained by the fact that motors represent 60% of the total load, and their disconnection significantly reduces the current drawn from the network. The disconnected motors are identified in Fig. 11 by the rotor speeds frozen after disconnection.
Figure 8. Speed of motors located on feeder 13AC, with load interruption (90% of load power interruptible, activated by voltage falling below 0.50 pu)
Figure 9. Voltages at buses of feeder 13AC, with load interruption (90% of load power interruptible, activated by voltage falling below 0.50 pu)
Figure 11. Speed of motors located on feeder 13AC, with load shedding A total of 32 motors were shed. Their location is shown in Table III. The first motors to be disconnected are those with the most depressed voltages, thus located at the end of their feeders, on feeders farther away from Node 0. When some motors are tripped, the nearby voltages increase, which avoids other motors from being tripped. This yields satisfactory selectivity. In the tests shown in this paper, all controllers implement the same load shedding characteristic (shown in Fig. 2). Fewer motor disconnections could be obtained by adjusting the settings of the controllers according to their electrical distance from the entry point of the distribution grid. However, the need to adjust the characteristics from one place to another would result in a much more complex tuning of the SIPS. Moreover, this type of tuning should be revised after a change in distribution network topology.
TABLE III. MOTORS DISCONNECTED BY LOAD SHEDDING, WITHOUT LOAD INTERRUPTION 1 2 3 4 5 6 7 8 9 10 4AB 4AC 5AB 5AC 7AB 7 AC 8 AB 8 AC 10 AB 10 AC 11 AB 11 AC 13 AB 13 AC E. With combined load interruption and shedding
As already mentioned, an attractive scheme consists of combining load interruption and load shedding, with the aim of curtailing fewer loads. The results are shown in Figs. 12 and 13. With the respective characteristics adjusted as shown in Fig. 2, load interruption takes place a little earlier, leading to a slight voltage increase, as pointed out in Fig. 12. This helps motor re-acceleration. The motor disconnection action leads to faster higher re-acceleration of the remaining motors, as can be seen from Fig. 13, and voltage recovery to more acceptable values. With this configuration a total of 14 motors
are disconnected, their location being shown in Table IV. Comparing with Table III, there is one more disconnected motor along feeders 13AB and 13AC. This is explained by the fact that, due to the voltage increase following load interruption, motor disconnection is delayed (compared to Fig. 11). Nevertheless, combining interruption and shedding leads to disconnecting fewer motors.
Figure 12. Voltage at buses of feeder 13 AC, with combined load interruption and shedding
Figure 13. Speed of motors located on feeder 13 AC, with combined load interruption and shedding
TABLE IV. MOTORS DISCONNECTED BY LOAD SHEDDING, WITH THE HELP OF LOAD INTERRUPTION
1 2 3 4 5 6 7 8 9 10 4AB 4AC 5AB 5AC 7AB 7 AC 8 AB 8 AC 10 AB 10 AC 11 AB 11 AC 13 AB 13 AC
As with load interruption only, the fraction of interruptible load plays an important role. Its impact is illustrated in Fig. 14, showing with grey bars the number of disconnected (shed) motors. For reference, the black bars show the number of motors stalled in the absence of load shedding. Considering that all stalled motors would eventually be disconnected by thermal (slow) protections (not included in the model), the difference between the black and the grey bars represents the saving of the proposed combined scheme in terms of lost motors. Shedding a small part of them restores voltages and allows the other motors to re-accelerate.
Figure 14. Influence of the percentage of interruptible load power. Black bars : number of stalled motors in the absence of load shedding.
Grey bars: number of motors shed with the help of load interruption. The rightmost bars in Fig. 14 show that the proposed scheme unduly sheds a few more motors when 100% of the non-motor load can be interrupted: eight motors are disconnected while only two of them stall when no shedding is activated. This is due to a slightly slow voltage recovery combined with the fact that the decision to disconnect a motor is irreversible, even if its voltage recovers above the threshold shown in Fig. 2 before the action is taken.
IV. CONCLUSION
This paper has proposed a SIPS to deal with FIDVR and short-term voltage instability at distribution level. It includes both temporary load interruption and load shedding. It relies on purely distributed controllers, each monitoring a bus voltage and interrupting/shedding load connected to that bus.
The scheme has been tested with temporary interruption of non-motor loads and shedding of motors to counteract short-term voltage instability.
The fast interruption of the non-motor load leads to a voltage increase that helps motors to re-accelerate. The effectiveness of this technique strongly depends on the amount of load that can be interrupted as well as on the delay to initiate the interruption. Load is restored after a few seconds.
The shedding of motors is used as back-up remedial action. The voltage threshold is set so that priority is given to load interruption. Shedding proves very useful when limited amounts of load power can be interrupted or even as a stand-alone action when no load at all is available for interruption.
In all cases, the proposed scheme has been shown to offer selectivity, thanks to the voltage differences from one bus to another in post-fault conditions.
ACKNOWLEDGEMENTS
This work has been co-funded by the Sectorial Operational Programme Human Resources Development 2007-2013 of the Romanian Ministry of Labour, Family and Social Protection through the Financial Agreement POSDRU/89/1.5/S/62557.
The data of the test system were kindly provided by Dr J. Deuse, formerly with Tractebel Engineering.
REFERENCES
[1] NERC Transmission Issues Subcommittee, NERC Planning Committee, "White Paper of Delayed Voltage Recovery - Cause, Risk and Mitigation", March 2009 (available at http://www.nerc.com/docs/ pc/tis/White_Paper_on_Delayed_Voltage_Recovery_R16.pdf). [2] B.R. Williams, W.R. Schmus, D.C. Dawson, "Transmission Voltage
Recovery Delayed by Stalled Air Conditioner Compressors," IEEE Trans. on Power Systems, vol. 7, no.3, pp. 1173-1181, August 1992. [3] G.K, Stefopoulos, A.P. Meliopoulos, “Induction Motor Load
Dynamics: Impact on Voltage Recovery Phenomena,” Proceedings of the Power Engineering Society General Meeting, June 2006..
[4] E.G. Potamianakis, C.D. Vournas, "Short-term voltage instability: Effects on synchronous and induction machines", IEEE Trans. Power
Systems, vol. 21, no.2,, pp. 791-798, May. 2006.
[5] I.A. Hamzah and J.A. Yasin, “Static Var Compensators (SVC) required to solve the problem of delayed voltage recovery following faults in the power system of the Saudi Electricity Company, Western Region (SEC-WR),” Proceedings of the 2003 IEEE PowerTech Conference, vol.4, Bologna, Italy, June 23-26, 2003.
[6] D. Sullivan, R. Pape, J. Birsa, M. Riggle, M. Takeda, H. Teramoto, Y. Kono, K. Temma, S. Yasuda, K. Wofford, P. Attaway, J. Lawson, "Managing fault-induced delayed voltage recovery in Metro Atlanta with the Barrow County SVC", IEEE/PES Power Systems Conference and Exposition, 2009.
[7] M. Halpin, K.A. Harley, R.A. Jones, L.Y. Taylor, "Slope-permissive under-voltage load shedding for delayed voltage recovery mitigation",
IEEE Trans. Power Systems, vol. 23, pp. 1211-1216, Aug. 2008.
[8] H. Bai, V. Ajjarapu, "A novel online load shedding strategy mitigating fault-induced delayed voltage recovery", IEEE Trans. Power Systems, vol. 26, pp. 294-304, Feb. 2011.
[9] R. Garcia-Valle, L.C.P. da Silva, Z. Xu, J. Ostergaard, "Smart demad for improving short-term voltage control on distribution networks", IET
Generation, Transmission & Distribution, vol. 3, pp. 724-732, 2009.
[10] D. Crăciun, S. Ichim, Y. Besanger, "A new soft load shedding: Power system stability with contribution from consumers", 2009 IEEE Bucharest PowerTech, June 28 - July 2 2009.