HAL Id: dumas-01911452
https://dumas.ccsd.cnrs.fr/dumas-01911452
Submitted on 2 Nov 2018HAL is a multi-disciplinary open access
archive for the deposit and dissemination of sci-entific research documents, whether they are pub-lished or not. The documents may come from teaching and research institutions in France or abroad, or from public or private research centers.
L’archive ouverte pluridisciplinaire HAL, est destinée au dépôt et à la diffusion de documents scientifiques de niveau recherche, publiés ou non, émanant des établissements d’enseignement et de recherche français ou étrangers, des laboratoires publics ou privés.
Une approche multiparamétrique est nécessaire pour
évaluer la fonction ventriculaire droite au quotidien :
une étude prospective monocentrique
Marie Hebert
To cite this version:
Marie Hebert. Une approche multiparamétrique est nécessaire pour évaluer la fonction ventriculaire droite au quotidien : une étude prospective monocentrique. Médecine humaine et pathologie. 2018. �dumas-01911452�
Université de Bordeaux
U.F.R. DES SCIENCES MEDICALES
Année 2018 - N° 3159
Thèse pour l’obtention du
DIPLOME d’ETAT de DOCTEUR EN MEDECINE
Discipline
: Cardiologie et Maladies vasculaires
Présentée et soutenue publiquement Le 15/10/2018
Par Madame HEBERT Marie Né(e) le 05/12/1990 à PARIS 15e
Une approche multiparamétrique est nécessaire
pour évaluer la fonction
ventriculaire droite au quotidien : une étude prospective monocentrique
Thèse dirigée par Monsieur le Docteur Eric ABERGEL
Composition du jury :
Monsieur le Professeur Raymond ROUDAUT, Président Monsieur le Professeur Stéphane LAFITTE, Juge
Monsieur le Professeur Jean-Benoit THAMBO, Juge Madame le Docteur Marina DIJOS, Juge
REMERCIEMENTS
A Monsieur le Professeur ROUDAUT, président du jury
Je vous remercie de me faire l’honneur d’accepter de présider le jury de ma thèse. Recevez ici toute ma reconnaissance et l'expression de mon plus profond respect.
A Monsieur le Professeur LAFITTE, Juge
Je vous remercie de me faire l’honneur d’être membre du jury de ma thèse. Merci pour tous vos enseignements pratiques et votre œil averti au quotidien.
A Monsieur le Professeur THAMBO, Juge
Je vous remercie de l'intérêt que vous portez à ce travail. Recevez ici toute ma
reconnaissance et l'expression de mon plus profond respect. Merci pour cette façon de voir l’échocardiographie comme un moyen de comprendre l’hémodynamique que j’ai découvert dans votre service.
A Madame le Docteur Dijos, Juge
Je te remercie d’avoir été présente dès mes premiers pas d’interne de m’avoir donné le goût de l’échocardiographie. J’ai trouvé en toi un modèle de clinicienne qui porte toujours une attention particulière à chaque patient. Merci d’avoir accepté d’être jury de ma thèse.
A Madame le Docteur Réant, Rapporteur
Je te remercie d’avoir pris le temps de juger mon travail, de la gentillesse et de l’investissement dans l’enseignement dont tu fais preuve, simplement, au quotidien.
A Monsieur le Docteur Abergel, Directeur de thèse
Je te remercie de m’avoir proposé ce travail et de m’avoir toujours poussée à aller plus loin pour apprendre et comprendre avec tant d’enthousiasme. Travailler avec toi a été une expérience humaine et médicale inoubliable et passionnante. Gracias El Profesor !
A Sofian, pour tout ce que tu m’apportes au quotidien, pour nos moments de joie et de folie à tous les 2 ; à notre vie ensemble et aux innombrables match que je vais devoir regarder !
A ma famille, sans qui je ne serai pas là aujourd’hui : à mes grands-parents et surtout Papi pour ton exemple de médecin du monde, à mes parents, pour leur soutien, leur amour et ce cocon familial qu’il n’ont de cesse de tisser, à Manon ma sœur qui me connait comme personne et à notre lien si unique, à mes 3 frères Pierre, Christophe et Louis pour m’avoir forgé le caractère.
A mes co-internes de promo : Jean, Émilie, Hugo et Romain : la « famille », on aura bien ri et souffert ensemble pendant ces 4 ans !
A mes « coolloc », pour toutes ces cordons bleus et ces soirées séries et tout le groupe du premier semestre : Hugo, Aimée, Thomas, Gabrielle, Louis, Camille, Maxence, Lucille, Ben, Camille et Hélène.
Aux amitiés qui durent : toutes les Zouzettes et ces week-end de folie ; Aude et Manon, mes amies du lycée.
A toute le joyeuse bande amiénoise, pour m’avoir accueilli.
A Vincent, merci pour tout ce que tu m’as appris, intellectuellement et humainement. Toi, je te veux dans mon équipe !
A l’équipe des échographies de Saint Augustin mais aussi les infirmières et les secrétaires qui ont vécu à mes côtés le long cheminement du recueil de données. A ces heures passées au cagibi et pour cette ambiance si familiale, merci encore.
A toutes les médecins avec qui j’ai eu l’occasion de travailler et qui, chacun et chacune à leur manière, ont participé à faire le médecin que je suis devenue : Cécile et mes premières échographies, Jean-Bernard et tous ces schémas de cardiopathies, François pour ta belle façon de faire de la cardiologie, Xavier, toute l’équipe de la réanimation de
Périgueux qui m’a guidé sur ce domaine inconnu, l’équipe des soins intensifs, M. Couffinhal pour sa capacité à écouter et échanger dans un semestre pas facile, l’équipe de rythmologie pour leur pédagogie au quotidien, Nicolas et Rémi, Sylvain pour sa joie du quotidien et à M. Bordachar pour ses cours inoubliables.
A tous les co-internes croisés au fil des stages et des gardes et spécialement aux filles de la mat’ de Périgueux.
A toutes les équipes paramédicales, pour ce quotidien pas toujours facile mais très enrichissant, merci.
SERMENT D’HIPPOCRATE
Au moment d’être admise à exercer la médecine, je promets et je jure d’être
fidèle aux lois de l’honneur et de la probité.
Mon premier souci sera de rétablir, de préserver ou de promouvoir la santé
dans tous ses éléments, physiques et mentaux, individuels et sociaux.
Je respecterai toutes les personnes, leur autonomie et leur volonté, sans
aucune discrimination selon leur état ou leurs convictions. J’interviendrai pour
les protéger si elles sont affaiblies, vulnérables ou menacées dans leur intégrité
ou leur dignité. Même sous la contrainte, je ne ferai pas usage de mes
connaissances contre les lois de l’humanité.
J’informerai les patients des décisions envisagées, de leurs raisons et de leurs
conséquences. Je ne tromperai jamais leur confiance et n’exploiterai pas le
pouvoir hérité des circonstances pour forcer les consciences.
Je donnerai mes soins à l’indigent et à quiconque me les demandera. Je ne me
laisserai pas influencer par la soif du gain ou la recherche de la gloire.
Admise dans l’intimité des personnes, je tairai les secrets qui me seront
confiés. Reçue à l’intérieur des maisons, je respecterai les secrets des foyers et
ma conduite ne servira pas à corrompre les mœurs.
Je ferai tout pour soulager les souffrances. Je ne prolongerai pas abusivement
les agonies. Je ne provoquerai jamais la mort délibérément.
Je préserverai l’indépendance nécessaire à l’accomplissement de ma mission.
Je n’entreprendrai rien qui dépasse mes compétences. Je les entretiendrai et
les perfectionnerai pour assurer au mieux les services qui me seront demandés.
J’apporterai mon aide à mes confrères ainsi qu’à leurs familles dans l’adversité.
Que les hommes et mes confrères m’accordent leur estime si je suis fidèle à
TABLE DES MATIERES
REMERCIEMENTS ... 2 SERMENT D’HIPPOCRATE ... 4 ABREVIATIONS... 6 ABSTRACT ... 7 RESUME ... 8 INTRODUCTION ... 10 OBJECTIVES... 11MATERIAL AND METHODS ... 12
1. Population ... 12
2. Echocardiographic studies ... 12
3. Echocardiographic measurements ... 12
4. Statistical Analyses ... 13
RESULTS ... 12
1. Clinical characteristics of the population ... 14
2. Echocardiographic characteristics of the population ... 14
3. Which situation furthering mismatch should retain our attention? ... 14
4. Correlation analysis ... 15
5. Could load indexed parameters help us classify RV between good function and true dysfunction? ... 16
DISCUSSION ... 17
1. Population characteristics ... 17
2. Global results ... 17
3. RV parameters ... 18
a. S’ & clinical and hemodynamic conditions ... 18
b. IVA and hemodynamic conditions ... 18
c. MPI and hemodynamic conditions ... 19
d. RV strain and hemodynamic conditions ... 19
e. RVFAC and hemodynamic conditions ... 20
4. Correlation between the 5 RV parameters ... 21
5. Load indexed parameters ... 21
6. Perspectives and utility in clinical practice ... 22
7. Limitations ... 22
CONCLUSION ... 24
TABLES ... 25
ANNEX ... 32
ABREVIATIONS
- AF : Atrial Fibrillation
- Apd-Amd : Pulmonary A wave duration - mitral A wave duration - AR : Aortic Regurgitation
- AS : Aortic Stenosis
- ESPAR : RV End-Systolic Pressure–Area Ratio - IVA : Right Ventricular Isovolumic Acceleration - IVC : Inferior Vena Cava
- IVCT : Isovolumic Contraction Time - IVRT : Isovolumic Relaxation Time - LAI : Load-Adaptation Index - LAVI : Left Atrium Volume Index
- LVEF : Left Ventricular Ejection Fraction - MPI (Tei) : Myocardial Performance Index - MR : Mitral Regurgitation
- PAH : Pulmonary Arterial Hypertension - PR : Pulmonary Regurgitation
- PVR : Pulmonary Vascular Resistance - RA : Right Atrium
- RSWi : Right Ventricle Stroke Work Indexed - RV : Right Ventricle
- RVFAC : Right Ventricle Fraction Area Change - RV LAI : Right Ventricular Load Adaptation Index
- S’ : Pulsed Tissue Doppler lateral annular systolic velocity - RVOTTVI : RV Outflow Tract Time Velocity Integral - SBP : Systolic Blood Pressure
- SD : Standard Deviation
- SPAP : Systolic Pulmonary Artery Pressure - TR : Tricuspid Regurgitation
ABSTRACT:
Introduction : Evaluating right ventricular (RV) function is a prognostic issue in many echocardiograms performed routinely. Guidelines propose to perform at least one parameter among Pulsed Tissue Doppler lateral annular systolic velocity (S') and Right Ventricle Fraction Area Change (RVFAC). The main objective of this study was to identify the mismatch situations and the factors likely to make a significant impact in the first place, and secondly, to study the correlations of the right ventricular function parameters with the load parameters. Finally, considering these parameters seem to represent the arterial ventricle coupling, we tested non-validated parameters integrating the load to discriminate the right ventricular function.
Methods & Results: The study group consisted of 210 patients undergoing an echocardiography. Using each of the 5 validated parameters, we found 58% of mismatch situations and were able to conclude between 67% and 88% of normal RV function. S 'and RVFAC discorded in 18% of the situations. In the healthy population, S’ and RVFAC did not mismatch but we identified 29% of isolated low RV strain. In the normal RVFAC/low S’ group, patients tented to be older (74 vs 68 years old , p=0, 033), with lower cardiac output (4.8 vs 6.4 l/min, p<0,001), lower LVEF (56% vs 67%, p<0,01) and higher pulmonary pressures (37 vs 26 mmHg, p= 0,023). Of the 5 parameters, Isovolumic Ventricular Acceleration (IVA) was the only one independent of load conditions whereas RV Strain was the most dependent one. S’ was correlated with cardiac output (r=0.26 (0.11; 0.39), p<0.001) and with mean SPAP (r=-0.15 (-0.29; -0.01), p=0.034). RVFAC was correlated with flow indices such as RVOTTVI (r=0.23 (0.09; 0.37), p<0,001), with preload indices such as IVC variation (r=0.26 (0.12; 0.39), p<0.001) and with afterload indices such as mean SPAP (r=-0.29 (-0.42; -0.16), p=0.034). New load indexed parameters such as S’*PVR seemed to be discriminative, with a 1.6 cut-off, a 75% specificity linked to 61% sensibility concluded to good RV function; whereas 80% specificity linked to 57% sensibility concluded to poor RV function.
Conclusion: Evaluation of right ventricular function in routine situations requires a multi-parametric approach, especially when preload, afterload and cardiac output are not normal. They are all load dependent except for IVA. Routine applicable and load-integrating parameters seem to be useful to discriminate RV function. New full and specific researches need to be carried out to validate this theory.
RESUME
Introduction : L'évaluation de la fonction du ventricule droit (VD) est un enjeu pronostique au quotidien. Les recommandations proposent de réaliser au moins un paramètre parmi le pic de vitesse en doppler pulsé à l'anneau tricuspide (S ') et le raccourcissement de surface du ventricule droit (FRSVD). Dans ce contexte, nous nous sommes demandés à quelle fréquence ces paramètres étaient discordants dans une population tout venant et si nous pouvions en identifier les facteurs de risque. Deuxièmement, nous avons identifié les facteurs notamment hémodynamiques favorisant la discordance. Enfin, ces paramètres semblant représenter le couplage ventriculo-artériel, que penser des facteurs indexés sur la charge pour approcher la contractilité du ventricule droit ?
Méthodes et résultats : Deux cent dix patients consultant pour une échocardiographie ont été inclus. En utilisant chacun des 5 paramètres validés, nous avons trouvé 58% de discordance et pouvions conclure de 67% à 88% de fonction VD normale. S 'et RVFAC discordent dans 18% des situations. Cette discordance ne se retrouve pas dans le groupe de patients à cœur normaux, mais il y avait 29% de strain VD bas isolé. Dans le groupe FRSVD normal/S’ bas, les patients sont significativement plus âgés (74 vs 68 ans, p = 0, 033), le débit cardiaque significativement plus bas (4,8 vs 6,4 l / min, p <0,001). (56% vs 67%, p <0,01) et les pressions pulmonaires (PAPS) significativement plus élevées (37 vs 26mmHg, p = 0,023). Parmi les 5 paramètres, l’accélération iso-volumique (IVA) est le seul à être indépendant des conditions de charge, le strain VD étant le plus dépendant. S’ est significativement corrélé au débit cardiaque (r = 0,26 (0,11; 0,39), p <0,001) et aux PAPS (r = -0,15 (-0,29; -0,01), p = 0,034). RVFAC est corrélé au débit ( ITV sous pulmonaire (r = 0,23 (0,09, 0,37), p <0,001)), à la pré-charge (variation de la veine cave inférieure (r = 0,26 (0,12; 0,39), p <0,001)), à la post-charge (PAPS (r = -0,29 (-0,42; -0,16), p = 0,034)). S’*PVR (Pulmonary Vascular Resistance), un paramètre intégrant la charge semble être discriminant pour un seuil à 1.6 : pour conclure à une bonne fonction VD, on observe une spécificité de 75% pour une sensibilité à 61% ; pour conclure à une dysfonction VD, on observe une spécificité à 80% pour une sensibilité à 57%.
Conclusion : L'évaluation de la fonction ventriculaire droite dans les situations quotidiennes nécessite une approche multiparamétrique, en particulier lorsque les conditions de pré-charge, de post-charge et de débit cardiaque ne sont pas normales. Ils sont tous dépendants de la charge en dehors de l'IVA. Un simple paramètre de charge indexé à la charge comme S '*PVR pourrait être utilisé comme paramètre discriminant mais d’autres études sont nécessaires pour l’affiner et le valider.
Mots clés : échocardiographie, fonction ventriculaire droite, multiparamétrique, conditions
hémodynamiques, pré-charge, post-charge, débit cardiaque, discordanceA multi-parametric approach is necessary in daily life to evaluate
right ventricular function: a prospective monocentric study
INTRODUCTION
The Right Ventricle (RV) is described as a three-component cavity1 : the inlet portion, the trabeculate apical myocardium and the outlet portion. It is composed by a thin free-wall and a septum shared with left ventricle which contributes to ventricular interdependence2.
This anatomical situation illustrates why its hemodynamic differs significantly from the left ventricle’s. Fisrtly, according to the Starling law, the RV is highly compliant, thus enabling an increase in cardiac output by increasing its pre-load3. Secondly, according to the Laplace law, the RV can hypertrophy to normalize parietal stress in case of pulmonary hypertension however it is less likely to adapt to afterload, compared to the left ventricle.4
It is important to speak of ventricular-arterial coupling when referring to the right side heart since a balance between the RV contraction and pulmonary vascularization compliance is essential to ensure sufficient cardiac output.
The gold standard for right ventricle hemodynamic is Right Ventricular Stroke Work (RSW) = 1,25 x (mPAP – Right Atrial (RA) pressure) × RV systolic ejection volume measured by intracardiac catheterization - it cannot be measured on a daily basis however.
The RV ultrasound approach, more recent than the left one, focuses mainly on its hemodynamics (contractility, cardiac output) and its anatomy (volume, thickness) since it reflects its adaptation to an hemodynamic situation. Guidelines5 for the Echocardiographic Assessment of the Right Heart in Adults have been published by the American Society of Echocardiography jointly with the European Association of Echocardiography in 2010. Different parameters have been validated analyzing the global contraction (Right Ventricular Fraction Area Change (RVFAC), RV free-wall strain), the longitudinal contraction (TAPSE, S’), the different chronologic parts of contraction (Myocardial Performance Index (MPI), Isovolumic Acceleration (IVA)). Nevertheless, we can’t dissociate these data from the study of afterload (Systolic Pulmonary pressures (SPAP)using tricuspid regurgitation (TR) or pulmonary regurgitation (PR), pulmonary vascular resistance (PVR)), and preload (Inferior Vena Cava (IVC) collapse index).
In practice, Guidelines recommends to use at least one parameter among S’, RVFAC (and TAPSE). However, these different ultrasound parameters we use daily seem to be more representative of the coupling than the RV’s own contractility, for the reasons described above.
More recently, some studies have tried to assess RV contractility by using indexed parameters including RV dimensions and pulmonary pressure :
- RV load-adaptation index (RV LAI), a composite echo-derived variable, is defined by the ratio of the systolic mean pressure-gradient between the RV and RA and RV end-diastolic area per long-axis length: ΔP(RV – RA) / (EDV/LED). For proper decision making, RV LAI was studied in a heart failure population before ventricular assist-device implantation and was supposed to approach RSWI67
- TAPSE* SPAP and by analogy S’* SPAP may be a simplified approach to assess RV contraction by plotting fiber longitudinal shortening versus the force generated to overcome the imposed load.
- RV end-systolic pressure–area ratio (ESPAR) is calculated as SPAP divided by RV end-systolic area and studied in both healthy and ventricular arrhythmia subjects, tested at rest and whilst exercising - to assess RV contractility. 8
OBJECTIVES
On the basis of the Guidelines, we questioned first how often these parameters were discordant in a general patient population and whether we could identify the risk factors. Secondly, we tried to identify the influencing factors, especially the load indices, of the 5 parameters proposed by Guidelines. Finally, since these parameters seem to represent the arterial ventricle coupling, we investigated the load indexed factors to approach right ventricle’s contractility.
MATERIAL AND METHODS
1. Population
The study group consisted of 210 patients recruited prospectively in the echocardiography laboratory at the Clinique Saint Augustin (Bordeaux) from January to April 2018. All patients underwent an echocardiography, related or non related to cardiac conditions, and consented to the study.
2. Echocardiographic studies
Echocardiographic studies were performed on a Vivid E95 ultrasound system. All examinations were performed according to ASE Guidelines.
3. Echocardiographic measurements
A modified apical four-chamber view focused on the RV was used to measure RV area, by tracing the RV endocardium both in systole and diastole and to measure 2D strain analysis of the right ventricle free wall. RVFAC (%) was defined as ([end-diastolic RV area - end-systolic RV area] / end-diastolic RV area) × 100.
All measurements using pulsed-wave tissue Doppler imaging (TDI) were performed in a four-chamber view focused on the RV using a tissue Doppler mode with a pulsed- wave Doppler sample volume placed in the basal segment of the RV free wall. Special care was taken to ensure optimal image orientation, to avoid underestimation of velocities. The following data were obtained: S’ was defined as the peak longitudinal velocity of the basal RV free wall; MPI was defined as the ratio of the sum of isovolumic relaxation time and isovolumic contraction time divided by ejection time (S’ duration); IVA was defined as the isovolumic velocity divided by the time interval from onset of the isovolumic wave to its peak velocity (acceleration time).
RV preload assessment included end-diastolic RA area and IVC maximal and minimal diameters obtained from a subcostal view at end-expiration, after sniff test. The IVC collapse index (%) was defined as ([maximal IVC — minimal IVC] / maximal IVC). Maximal IVC diameter and collapse index were used to assess preload according to the ASE guidelines
RV afterload assessment included SPAP determined from peak TR velocity or PR velocity using the simplified Bernoulli equation and combined with an estimated RA pressure (based
on the IVC collapse index) and PVR estimated using peak TR velocity divided by RV Outflow Tract Time Velocity Integral (RVOT-TVI).
BasED on the 5 RV validated parameters, we established 3 situations:
“Match population”: 5/5 parameters match for normal RV function,
“Mismatch population”: One or more parameters mismatch to conclude about RV function,
5/5 parameters concurred for RV dysfunction.
4. Statistical Analyses
We used the p-value software to perform our statistical analyses. Continuous data are expressed as means ± standard deviations and discrete parameters as absolute numbers and percentages. The groups were tested using a Fisher test and chi-2 test to compare categorical parameters. The clinical and echocardiographic data from the patients’ group were compared using the Welch parametric test or the Mann-Whitney non-parametric test, where appropriate, according to the variance R test. Relationships between hemodynamic indices and the validated RV function criteria were tested by means of Pearson’s correlation. Receiver operating characteristic curve analysis was performed to test the diagnostic accuracy for discrimination between patients with RV dysfunction and those with normal RV function, and to determine optimal cut- off values.
RESULTS
1. Clinical characteristics of the population
The main clinical characteristics of our population are reported in Table 1. The mean age was 68 years old 28-97 years old, 72% were men -representative of a general patient population. We included people who underwent an ultrasound examination in the echocardiographic laboratory, related or non-related to cardiac conditions.
2. Echocardiographic characteristics of the population
The main echocardiographic characteristics of our population are reported in Table 2. In our general patient population, we registered 80% of normal S’ (S’10cm/s), 88% of normal RVFAC (RVFAC 35%), 82% of normal IVA (IVA 2,2m/s2), 82% of normal MPI (MPI < 0,55) and 67% of normal RV Strain (RV strain - 21%). (Table 3).
Combining them, we encountered only 40% (n=74) of situations which all matched a normal RV function (“match population”). In 58% (n=107) of the situations, one or more parameters mismatched others (“mismatch population”). We found only 2% (n=3) of situations where the five parameters concurred for an RV dysfunction.
Focusing only on S’, we detected 18% of situations of mismatch with RVFAC, 23% with MPI, 26% with IVA and 29% with RV strain. Focusing on RVFAC, we detected 22% of mismatch situations with MPI, 24% with IVA and 29% with RV strain. RV strain scored highest with 29% to 42% of mismatch situations. (Table 4)
The RV parameters feasibility is >95% for S’, RVFAC and Tei and 91% for IVA and strain. By coupling TR and PR results we obtained 94% of feasibility for SPAPS.
3. Which situation furthering mismatch should retain our attention?
There was no significant statistical and clinical difference between the 2 groups (match vs mismatch) in the case of consultation or hemodynamic conditions. (Annex 1)
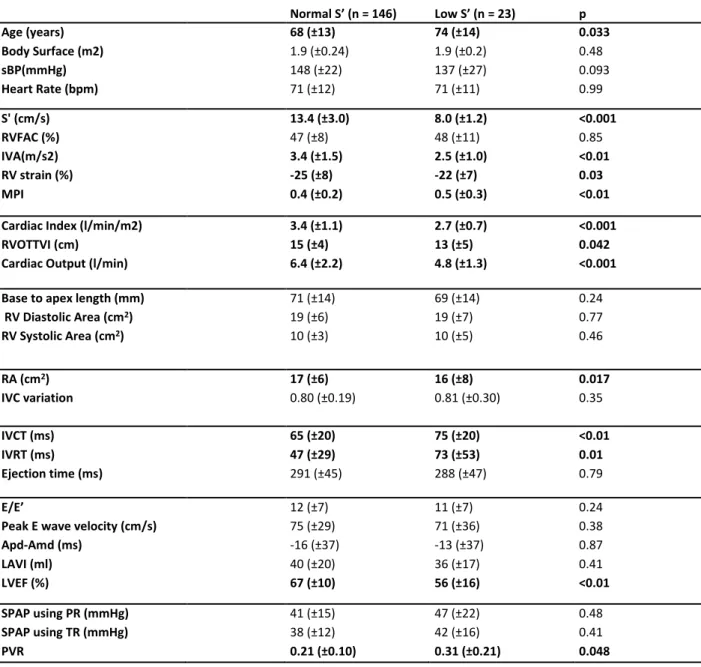
Furthermore, always following the Guidelines, taking into account the 2 major parameters RVFAC et S’, we compared patients with normal RVFAC and normal S’ against
patients with normal RVFAC et low S’: in the “low S’ group”, patients proved significantly older (74 vs 68 years old , p=0, 033), cardiac output was significantly lower (4,8 vs 6,4 l/min, p<0,001), LVEF was significantly lower (56% vs 67%, p<0,01) and SPAP was significantly higher (37 vs 26 mmHg, p= 0,023). Other results are available in Table 5.
However, if we start from an S’ normal population, no significant difference appeared between low and normal RVFAC groups.
Finally, if we look at patients with a “normal heart” consulting for non-cardiac issues, of the 31 patients measured with 5 parameters, we found 19 match (61%), 12 4/5 match parameters (39%) - in the latter case the failing parameters were mainly RV strain (76%), MPI (16%), IVA (8%) but never S’ or RVFAC.
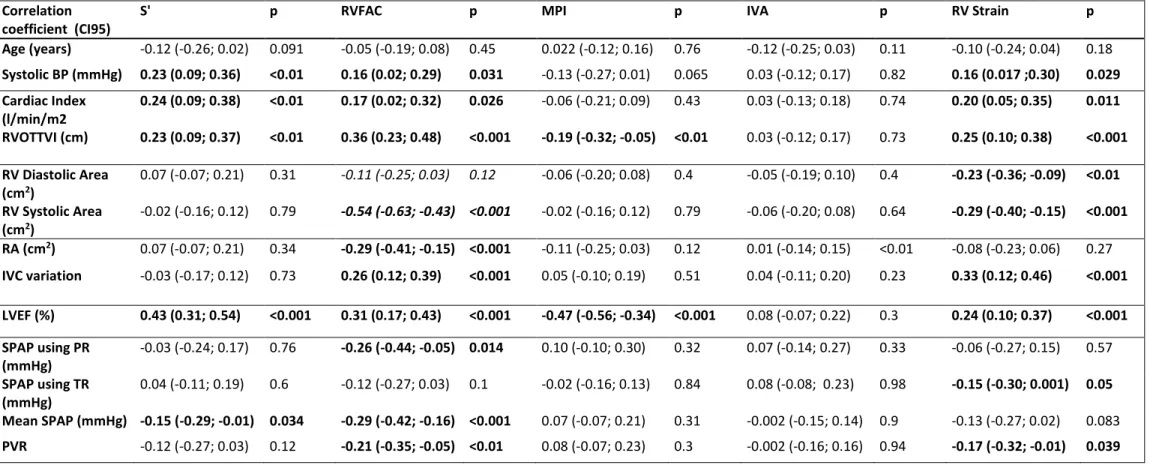
4. Correlation analysis
IVA was the only RV function parameter where we did not find any load indices correlation with.
S’ was correlated with cardiac output (r=0.26 (0.11; 0.39), p<0.001) and inversely with mean SPAP (r=-0.15 (-0.29; -0.01), p=0.034). It was also correlated with IVRT (r=-0.27 (-0.40; -0.14), p<0.001) which is an index of diastolic function. It was independent of preload
indices.
RVFAC was correlated with flow indices like RVOTTVI (r=0.23 (0.09; 0.37), p<0,001), with preload indices like IVC variation (r=0.26 (0.12; 0.39), p<0.001) and inversely with afterload indices like mean SPAP (r=-0.29 (-0.42; -0.16), p=0.034).
MPI was moderately correlated with RVOTTVI (r=-0.19 (-0.32; -0.05), p<0.01).
RV strain was correlated with flow indices like RVOTTVI (r=0.25 (0.10; 0.38), p<0,001), with preload indices like IVC variation (r=0.33 (0.12; 0.46), p<0.001), inversely with afterload indices like PVR (r-0.17 (-0.32; -0.01)), p=0.039) and inversely with size indices like base-to-apex length (r=-0.27 (-0.40; -0.13), p<0.001).
5. Could load indexed parameters help us classify RV between good function and true dysfunction?
We established 2 groups:
- « highly probable RV normal function » where 4 or 5 out of 5 parameters concluded to normal function. (n=140)
- highly probable RV dysfunction when 4 or 5 out of 5 parameters concluded to dysfunction. (n= 13)
- All other patients in the “grey area” were excluded from this analysis.
We calculated means and standard deviations of each load indexed parameter and based on these results, we defined an arbitrary cut-off based on mean less one standard deviation. From there, we tried to evaluate the rate of match and mismatch between these new load indexed parameters and the high probable RV function.
“S’*SPAP” ranked correctly RV function in 92% of situations and “RV STRAIN*SPAP” in 90% of situations. ESPAR ranked correctly RV function in 84% of situations and “LAI” in 85% of situations. Complete results are available in Table 7.
Considering the imbalance between the 2 groups (match and mismatch population) in terms of their numbers, these results can hide an important disparity between sensibility and specificity.
That’s why we calculated sensibility and specificity to detect both good RV and poor RV function.
Using LAI with a 40 cut-off, to be able to conclude to good RV function, a 90% specificity was observed; on the other hand, to be able to conclude to poor RV function, a 100% sensibility was observed.
Using ESPAR, with a 2.2 cut-off, to be able to conclude to good RV function, a 90% specificity was observed; on the other hand, 89% specificity was observed with a 2.1 cut-off, to be able to conclude to poor RV function.
Concerning S’*PVR, with a 1.6 cut-off, to be able to conclude to good RV function, a 75% specificity and a 61% sensibility were observed; whereas, to be able to conclude to poor RV function, an 80% specificity and a 57% sensibility were observed.
DISCUSSION
In the present study, we have shown that there is significant mismatch between the 5 RV function parameters, which limits the possibility of using one single parameter to define the RV function - especially in pathological situations. These parameters are dependent on preload, afterload and flow, each at different degrees, which may at least explain the mismatch. IVA is however less independent of the load conditions. Finally, we have shown that simple parameters integrating the load are close to the combination of the 5 validated parameters in order to discriminate a good from a poor right ventricle – which could prove an easy, quick way to analyze RV contractility.
1. Population characteristics
The day-to-day population assessed in our study reflects a standard cardiology population and offers a valuable clinical impact. The men/women ratio of about 3/1 reflects a standard cardiology population according to the French registry9. We obtained 25% of high pulmonary pressure, which is interesting taking into account its presumed accountability in mismatch. Due to the enrolment of patients who were either ambulatory or hospitalized in a conventional unit, we obtained an authentic routine population varying in consultation issues, including both healthy subjects and a few severely ill patients.
2. Global results
Based on our classification into three groups: “match for normal RV function”, “one mismatch at least between the 5 parameters” and “match for RV dysfunction situation”, it is reassuring to note that match situations for normal RV function stay common for parameters all validated by international Guidelines.5
alone because, it often tented to be the only abnormally low parameter in this same population. This theory concords with the Guidelines which doesn’t recommend RV strain for routine clinical use.5
It seems relatively easy to come to the right conclusion in a “normal” situation whereas pathological situations further mismatch.
3. RV parameters
a. S’ & clinical and hemodynamic conditions
Classically, older patients with higher pulmonary pressure or lower cardiac output showed lower S’ despite a normal RVFAC. The “one at least” can’t be applied here, it relates to research data which show a decrease of S ' with age on a small core of healthy subjects.10 It would be presumptuous to assume that S’ fails all the time in these situations given that other parameters are also significantly lower.
S’, was correlated with pulmonary pressures and cardiac output. The example of the old Heart Failure patient with preserved Ejection Fraction is a typical, very frequent clinical case we should be careful about.
In literature, S’ is known as easily to obtain, offers prognostic data, and shows good correlation with RVEF by angiography and then MRI; on the other hand, it is angle-dependent, it is influenced by overall heart motion and does not always match global RV systolic function 5 . Its dependency with afterload has already been described in a study on 17 healthy subjects exposed to increased preload by rapid infusion of saline, and to increased afterload simulated in a 16- to 18-hour stay in a controlled hypoxic environment : S’ was reduced by 2 points11. However, no data is available concerning cardiac output. What we can affirm is that S’ seems to pass screening healthy situations but should be interpreted with caution in pathological situations. As written in Guidelines : “ S’ < 10 cm/s should raise the suspicion for abnormal RV function, particularly in a younger adult”5.
b. IVA and hemodynamic conditions
The absence of correlation we noted between IVA and load indices reflects most of the literature data : Initially described by Vogel et al.12 as an index of RV contractile function, its
independency from preload and afterload changes has been validated in healthy subjects13 and in valvular disease comparing RV function parameters before and after percutaneous transverse mitral commissurotomy in 58 patients14. IVA has also been validated as a prognostic parameter in various studies especially in post-operative cardiac surgery15. Proving again its load independency, IVA should occupy a prominent place in the Guidelines as a second discriminant parameter when hemodynamic conditions may affect other RV function parameters.
c. MPI and hemodynamic conditions
The absence of correlation between MPI and load that we highlighted is more disputed. MPI has been initially described as a discriminative RV function parameter by Tei who studied 170 subjects -both normal and heart failure ones16 then proved its correlation with RSWI. 17
In a paper comparing different congenital heart diseases – representing changes in preload, afterload, or both - before and after repair of their congenital heart lesion, MPI appears to be relatively independent of changes. 18 On the other hand, other papers - described above16 -proved afterload dependency.
Compared to RVEF, MPI showed high sensitivity and negative predictive value for
detecting abnormal RV systolic function1920 . Considering all of these elements, MPI remains a useful and sensitive index to screen RV dysfunction although it may lack specificity.
d. RV strain and hemodynamic conditions
Our data underline the need to interpret RV strain with load conditions due to its correlation with preload, afterload and cardiac output.
We have known for a long time that LV strain is load dependent, for instance under aortic stenosis. By analogy, and considering the importance of RV-arterial coupling described in the introduction21, it does not come as a surprise that our data prove RV strain load dependency.
However, RV strain is acclaimed as a new sophisticated index in a lot of recent studies. Its excellent correlation with MRI RVEF is spotlighted in many studies such as Capelli and Al., who compared all RV function parameters and found RV strain most correlated with MRI RVEF – which can be explained by the global function they both represent -, but MRI RVEF shows the same limitations as regards the load dependency.
Nevertheless, many other studies proved its clinical prognostic impact in specific pathologies such as in advanced heart failure where it is correlated with RSWI2324 . This could provide us with some further specific information such as RV suffering in inferior infarction25 and cardiac amylosis26. Finally, it remains a very promising index to approach the physiological and required “peristatism” or “desynchrony” of RV contraction to assure arterial-ventricle coupling.27
e. RVFAC and hemodynamic conditions
According to the Laplace and the Starling laws and consistent with literature data, RVFAC was dependent of preload, afterload and cardiac output.
We can’t isolate situations where RVFAC is at risk to fail and which require a certain degree of caution, so we need to remain vigilant at all times.
As strain, RVFAC has the advantage to be correlated to MRI RVEF – the gold standard - , as described in a meta-analysis included 1,280 patients, comparing RVFAC and TAPSE to MRI RVEF ; however MRI RVEF shows however the same dependency with load28.
RVFAC reflects global RV function well, because it represents radial and longitudinal contraction. Brown and Al. studied both healthy subjects and pulmonary arterial hypertension subjects before and after vasodilator therapy : they noted an improvement of RVFAC following pulmonary vasodilator therapy, and more interestingly, a noted effect on longitudinal contraction which should be the most load dependent part of RV.29 This confirms our data where RVFAC is the most load dependent one, similar to RV strain .
Nevertheless, RVFAC was frequently described as a prognostic factor – for instance in the VALIANT ECHO study where each 5% decrease in baseline RVFAC was associated with an increased risk of fatal and nonfatal CV outcomes. 30
Making sure to trace the limit of the RV free wall including trabeculations, RVFAC occupies a key place in Guidelines – however, considering its load dependency, it might be controlled by a second parameter when load conditions are not normal.
4. Correlation between the 5 RV parameters
We found significant correlation between the 5 validated parameters of RV function - however the higher correlation coefficient was 0.4 which seems quite low for parameters which are supposed to convey the same message but if we consider that we don’t analyze the same thing here, it becomes very useful to approach different aspects of the RV function : RVFAC analyzes global and segmented kinetics, RV strain takes an interest in global and longitudinal contraction , S’ in longitudinal contraction, whereas IVA covers the isovolumic contraction time and MPI of chronology and systolic and diastolic function,
This proves even more important when part of this function can be affected : RV strain is the highest prognostic parameter in cardiac amyloidosis31 or S’ is often low in post-operative cardiac surgery32.
5. Load indexed parameters
We found that in our population, simple parameters integrating the load (S’PVR, LAI) approach the combination of the 5 parameters validated to discriminate a good from a bad right ventricle.
We used some parameters found in literature data such as LAI or ESPAR, but we also created new ones such as S’*SPAP/S’*PVR or RV strain*SPAP/RV strain*PVR by analogy of TAPSE*SPAP.
The most discriminative one was “S’*SPAP”, with 92% of match combining the 5 validated parameters, this in a population with a large proportion of normal RV function. S’*PVR seems to show both correct sensibility and specificity to conclude to either good or poor RV function. This parameter could be refined and weighted to improve its
and for LAI<40 , a good sensibility of poor RV function. This data could be used as reassuring when normal or as an alert for suspected RV dysfunction.
ESPAR was studied in a population with low RVFAC to identify good contractile reserve during exercise. Its utility at rest has never been studied34. In our population, for ESPAR>2.2, we scored a high specificity of good RV function and for ESPAR<2.1, a good sensibility of poor RV function.This data could be used as reassuring when normal or as an alert for suspected RV dysfunction.
These parameters have proven their feasibility in our study, they may help to discriminate RV function but further, specific research needs to be carried out to improve our data and to establish ideal cut-off.
6. Perspectives and utility in clinical practice
In the light of our study, we can’t use RV strain alone because it often shows falsely low results. We have to be careful to use S’ alone in elderly people.
Our study calls into question current recommendations which propose to use at least one parameter to study the right ventricular function, given the high daily percentage of discordance between them.
Considering these parameters are all load dependent except from IVA, it would be useful to systematically realize IVA as a second parameter when load conditions are not perfect.
The load-integrating parameters we studied could be realized daily and help us to discriminate RV function. Best cut-off could be refined in more important studies.
Nevertheless, we should keep in mind that one abnormal validated parameter should not be viewed as a result and should prompt a second measure - even more so because pathological hemodynamic situations can underrate one isolated measure35.
7. Limitations
We did not include TAPSE to avoid duplicates since it offered the same information as S’ but in a less reproducible manner; neither did we include 3D because it is not a validated parameter we can use daily. Moreover, the study only concerned echocardiograms. MRI used
for etiological purposes and intracardiac catheterization used before LVAD have no place in first intention.
We focused on the hemodynamic question, and MRI - validated as gold standard due to its excellent reproducibility – shows the same limitations as US parameters in terms of hemodynamic dependency.
The results being based on a heterogeneous population study group might have limited the correlation coefficient statistics. Even if the cohort size was correct, the group might have been too small for significant subgroup analysis results.
Some recruitment bias may exist because the study was monocentric, the same applies to measurement bias since no inter-observer reproducibility was performed even if 3 different cardiologists followed Guidelines acquisitions. We did not conduct any multivarious analysis because too many correlated parameters were present in univarious analysis ; the point of our study was not to demonstrate a strong correlation between 2 parameters but to highlight any impacts, even slight, to alert cardiologists to remain vigilant in daily routine situations.
CONCLUSION
Our study raises concerns about the current recommendations which propose to use at least one parameter to study the right ventricular function – given the high percentage of mismatch between them on a daily basis.
This can be explained by the fact that these parameters are dependent on preload, afterload and flow - excluding IVA which is less dependent of the load and which should have a place of choice as a second parameter to complete the right ventricular function analysis.
We demonstrated that routinely applicable and load-integrating parameters appear to be nearly as effective as the combination of the 5 validated parameters to discriminate right ventricular function. New full and specific researches need to be carried out to validate this theory.
TABLES
Table 1 : Clinical characteristics
mean (SD) median [Q25-75] min max
Age (years) 69 (13) 69 [61; 79] 28 97 Weight (kg) 77 (16) 75 [65; 86] 42 120 Size (cm) 169 (9) 171 [162; 176] 146 187 Body Surface (m2) 1.9 (0.2) 1.9 [1.7; 2.0] 1.3 2.46 Systolic BP (mmHg) 144 (23) 144 [128; 159] 88 220 Heart Rate (bpm) 72 (13) 70 [63; 80] 38 110 Rhythm sinus 198 (94.3%) AF 12 (5.7%) Sex H 151 (72%) F 59 (28%) Dyspnea NYHA 1 84 (41%) NYHA 2 85 (42%) NYHA 3 31 (15%) NYHA 4 3 (1.5%) Aortic disease 5 (2.4%) Dilated cardiomyopathy 12 (5.7%) Ischemic cardiomyopathy 21 (10%) Dialysis 5 (2.4%) Dyspnea 13 (6.2%) Atrial Fibrillation 7 (3.3%) Pulmonary artery hypertension 1 (0.48%) Aortic regurgitation 2 (0.95%) Mitral regurgitation 9 (4.3%) Tricuspid regurgitation 2 (0.95%) Normal 49 (23%) Aortic stenosis 50 (24%) Absence of indication 38 (18%)
Table 2 : Echocardiographic characteristics
RVFAC = right ventricle fraction area change, IVA= isovolumic acceleration, RV strain = right ventricle strain, MPI=myocardium performance index, RVOTVI= right ventricle Outflow Tract Time Velocity Integral, RA=right atrium, IVC= inferior vena cava, IVCT=isovolumic contraction time, IVRT=isovolumic relaxation time, Apd-Amd= difference between mitral wave A less pulmonary wave A, LAVI= left atrium indexed volume, LVEF=left ventricle ejection fraction, SPAP=systolic pulmonary arterial pressure, TR=tricuspid regurgitation, PR=pulmonary regurgitation, PVR=pulmonary vascular resistance
mean (SD) median [Q25-75] min max missing values (%)
S' (cm/s) 12.0 (3.5) 12.0 [10.0; 15.0] 5.0 25 5
RVFAC (%) 45 (10) 45 [38; 53] 14 66 4
IVA(m/s2) 3.3 (1.5) 3.0 [2.3; 4.0] 0.8 10.5 9
RV strain (%) -23.8 (7.7) -24.0 [-28.0;-19.0] -5.0 -36.0 9
MPI 0.43 (0.20) 0.41 [0.30; 0.51] 0.08 1.40 3
Cardiac Index (l/min/m2) 3.3 (1.1) 3.1 [2.7; 3.7] 1.3 11.4 19
RVOTTVI (cm) 15 (4) 15.0 [12; 17] 4 25 7
Cardiac Output (l/min) 6.4 (2.1) 6.0 [4.9; 7.0] 2.2 22.8 18
Base to apex length (mm) 70 (15) 71 [64; 80] 10 100 5
RV Diastolic Area (cm2) 19 (6.2) 18.0 [14.0; 23.0] 8.0 42.0 4 RV Systolic Area(cm2) 10 (4.1) 10.0 [7.50; 12.5] 3.0 26.0 3 RA (cm2) 18 (7) 16 [13; 21] 6 51 7 IVC variation 0.79 (0.22) 0.800 [0.643; 1.00] 0.08 1.00 7 IVCT (ms) 68 (21) 67 [53; 79] 16 162 2 IVRT (ms) 52 (35) 49 [31; 69] 0 205 2 Ejection time (ms) 289 (45) 294 [255; 318] 168 425 2 E/E’ 12 (7) 10[7; 14] 3 56 10
Peak E wave velocity (cm/s) 74 (30) 70 [53; 90] 10 180 3
Apd-Amd (ms) -16 (37) -13 [-34; 0] -140 75 0 LAVI (ml/m2) 41 (21) 36 [27; 49] 8 155 5 LVEF (%) 63 (13) 65 [58; 72] 18 85 3 SPAP using PR (mmHg) 43 (17) 39 [30; 51] 19 87 55 SPAP using TR (mmHg) 39 (13) 35 [30; 45] 20 82 15 PVR 0.23 (0.13) 0.18 [0.15; 0.27] 0.10 0.89 20
Parameters Normal values Function n (%) S’ 10cm/s normal 161 (80%) low 39 (20%) IVA 2.2m/s2 normal 157 (82%) low 35 (18%) MPI < 0.55 normal 167 (82%) low 37 (18%) RVFAC 35% normal 177 (88%) low 25 (12%) RV Strain - 21% normal 128 (67%) low 64 (33%)
Table 3 : Repartition of echocardiographic parameters between normal and abnormal value
RVFAC = right ventricle fraction area change, IVA= isovolumic acceleration, RV strain = right ventricle strain, MPI=myocardium performance index
Parameters S' IVA MPI RVFAC RV strain
S' 26% 23% 18% 29%
IVA 26% 27% 24% 38%
MPI 23% 27% 22% 42%
RVFAC 18% 24% 22% 29%
RV strain 29% 38% 42% 29%
Table 4 : Percentage of mismatch between the 5 validated RV function parameters
RVFAC = right ventricle fraction area change, IVA= isovolumic acceleration, RV strain = right ventricle strain, MPI=myocardium performance index
Normal S’ (n = 146) Low S’ (n = 23) p Age (years) 68 (±13) 74 (±14) 0.033 Body Surface (m2) 1.9 (±0.24) 1.9 (±0.2) 0.48 sBP(mmHg) 148 (±22) 137 (±27) 0.093 Heart Rate (bpm) 71 (±12) 71 (±11) 0.99 S' (cm/s) 13.4 (±3.0) 8.0 (±1.2) <0.001 RVFAC (%) 47 (±8) 48 (±11) 0.85 IVA(m/s2) 3.4 (±1.5) 2.5 (±1.0) <0.01 RV strain (%) -25 (±8) -22 (±7) 0.03 MPI 0.4 (±0.2) 0.5 (±0.3) <0.01
Cardiac Index (l/min/m2) 3.4 (±1.1) 2.7 (±0.7) <0.001
RVOTTVI (cm) 15 (±4) 13 (±5) 0.042
Cardiac Output (l/min) 6.4 (±2.2) 4.8 (±1.3) <0.001
Base to apex length (mm) 71 (±14) 69 (±14) 0.24
RV Diastolic Area (cm2) 19 (±6) 19 (±7) 0.77 RV Systolic Area (cm2) 10 (±3) 10 (±5) 0.46 RA (cm2) 17 (±6) 16 (±8) 0.017 IVC variation 0.80 (±0.19) 0.81 (±0.30) 0.35 IVCT (ms) 65 (±20) 75 (±20) <0.01 IVRT (ms) 47 (±29) 73 (±53) 0.01 Ejection time (ms) 291 (±45) 288 (±47) 0.79 E/E’ 12 (±7) 11 (±7) 0.24
Peak E wave velocity (cm/s) 75 (±29) 71 (±36) 0.38
Apd-Amd (ms) -16 (±37) -13 (±37) 0.87 LAVI (ml) 40 (±20) 36 (±17) 0.41 LVEF (%) 67 (±10) 56 (±16) <0.01 SPAP using PR (mmHg) 41 (±15) 47 (±22) 0.48 SPAP using TR (mmHg) 38 (±12) 42 (±16) 0.41 PVR 0.21 (±0.10) 0.31 (±0.21) 0.048
Table 5: Comparison between normal and low S' in a normal RVFAC population
RVFAC = right ventricle fraction area change, IVA= isovolumic acceleration, RV strain = right ventricle strain, MPI=myocardium performance index, RVOTVI= right ventricle Outflow Tract Time Velocity Integral, RA=right atrium, IVC= inferior vena cava, IVCT=isovolumic contraction time, IVRT=isovolumic relaxation time, Apd-Amd= difference between mitral wave A less pulmonary wave A, LAVI= left atrium indexed volume, LVEF=left ventricle ejection fraction, SPAP=systolic pulmonary arterial pressure, TR=tricuspid regurgitation, PR=pulmonary regurgitation, PVR=pulmonary vascular resistance
Table 6: RV function parameters and clinical and load parameters correlation Correlation
coefficient (CI95)
S' p RVFAC p MPI p IVA p RV Strain p
Age (years) -0.12 (-0.26; 0.02) 0.091 -0.05 (-0.19; 0.08) 0.45 0.022 (-0.12; 0.16) 0.76 -0.12 (-0.25; 0.03) 0.11 -0.10 (-0.24; 0.04) 0.18 Systolic BP (mmHg) 0.23 (0.09; 0.36) <0.01 0.16 (0.02; 0.29) 0.031 -0.13 (-0.27; 0.01) 0.065 0.03 (-0.12; 0.17) 0.82 0.16 (0.017 ;0.30) 0.029 Cardiac Index (l/min/m2 0.24 (0.09; 0.38) <0.01 0.17 (0.02; 0.32) 0.026 -0.06 (-0.21; 0.09) 0.43 0.03 (-0.13; 0.18) 0.74 0.20 (0.05; 0.35) 0.011 RVOTTVI (cm) 0.23 (0.09; 0.37) <0.01 0.36 (0.23; 0.48) <0.001 -0.19 (-0.32; -0.05) <0.01 0.03 (-0.12; 0.17) 0.73 0.25 (0.10; 0.38) <0.001 RV Diastolic Area (cm2) 0.07 (-0.07; 0.21) 0.31 -0.11 (-0.25; 0.03) 0.12 -0.06 (-0.20; 0.08) 0.4 -0.05 (-0.19; 0.10) 0.4 -0.23 (-0.36; -0.09) <0.01 RV Systolic Area (cm2) -0.02 (-0.16; 0.12) 0.79 -0.54 (-0.63; -0.43) <0.001 -0.02 (-0.16; 0.12) 0.79 -0.06 (-0.20; 0.08) 0.64 -0.29 (-0.40; -0.15) <0.001 RA (cm2) 0.07 (-0.07; 0.21) 0.34 -0.29 (-0.41; -0.15) <0.001 -0.11 (-0.25; 0.03) 0.12 0.01 (-0.14; 0.15) <0.01 -0.08 (-0.23; 0.06) 0.27 IVC variation -0.03 (-0.17; 0.12) 0.73 0.26 (0.12; 0.39) <0.001 0.05 (-0.10; 0.19) 0.51 0.04 (-0.11; 0.20) 0.23 0.33 (0.12; 0.46) <0.001 LVEF (%) 0.43 (0.31; 0.54) <0.001 0.31 (0.17; 0.43) <0.001 -0.47 (-0.56; -0.34) <0.001 0.08 (-0.07; 0.22) 0.3 0.24 (0.10; 0.37) <0.001 SPAP using PR (mmHg) -0.03 (-0.24; 0.17) 0.76 -0.26 (-0.44; -0.05) 0.014 0.10 (-0.10; 0.30) 0.32 0.07 (-0.14; 0.27) 0.33 -0.06 (-0.27; 0.15) 0.57 SPAP using TR (mmHg) 0.04 (-0.11; 0.19) 0.6 -0.12 (-0.27; 0.03) 0.1 -0.02 (-0.16; 0.13) 0.84 0.08 (-0.08; 0.23) 0.98 -0.15 (-0.30; 0.001) 0.05 Mean SPAP (mmHg) -0.15 (-0.29; -0.01) 0.034 -0.29 (-0.42; -0.16) <0.001 0.07 (-0.07; 0.21) 0.31 -0.002 (-0.15; 0.14) 0.9 -0.13 (-0.27; 0.02) 0.083 PVR -0.12 (-0.27; 0.03) 0.12 -0.21 (-0.35; -0.05) <0.01 0.08 (-0.07; 0.23) 0.3 -0.002 (-0.16; 0.16) 0.94 -0.17 (-0.32; -0.01) 0.039
Table 7: Match & mismatch between RV function established by a combination of the 5 validated parameters and load indexed parameters.
* Established with a combination of the 5 validated parameters: 4 or 5 out of 5 parameters match for normal function to conclude normal and 4 or 5 out of 5 parameters match for dysfunction function to conclude dysfunction. Other patients were excluded.
**Cut off based on the mean in match population less 1 standard deviation
RV=right ventricle, ESPAR=RV end-systolic pressure–area ratio, LAI=load-adaptation index , SPAP=systolic pulmonary arterial pressures, PVR=pulmonary vascular resistance
Load index
parameters ESPAR** LAI** S*SPAP** S*PVR**
RV STRAIN*SPAP** RV STRAIN*PVR** Match with RV function* 84% 85% 92% 75% 90% 80% Mismatch with RV function* 16% 15% 8% 15% 10% 20%
IN TERMS OF GOOD RV FUNCTION
cut-off value sensibility specificity PPV NPV TP TN FP FN
RV strain*SPAP 170 0.91 0.38 0.94 0.28 127 5 8 13 RV strain*PVR 1.6 0.73 0.50 0.94 0.15 88 6 6 33 S'*SPAP 154 0.87 0.62 0.96 0.31 122 8 5 18 S'*PVR 1.6 0.61 0.75 0.96 0.16 74 9 3 47 ESPAR 2.2 0.16 0.90 0.96 0.07 22 9 1 117 LAI 40 0.10 1.00 1.00 0.09 14 13 0 126
IN TERMS OF POOR RV FUNCTION
cut-off value sensibility specificity PPV NPV TP TN FP FN
RV strain*SPAP 289 0.22 0.91 0.14 0.94 2 115 12 7 RV strain*PVR 1.5 0.14 0.99 0.50 0.94 1 88 1 6 S'*SPAP 153 0.44 0.92 0.27 0.96 4 122 11 5 S'*PVR 1.6 0.57 0.80 0.17 0.96 4 74 19 3 ESPAR 2.1 0.89 0.17 0.07 0.96 8 22 111 1 LAI 40 1.00 0.24 0.12 1.00 6 14 44 0
Table 8 : Sensibility and specificity of new load indexed parameters depending on
- good RV function
- poor RV function
RV=right ventricle, ESPAR=RV end-systolic pressure–area ratio, LAI= load-adaptation index , SPAP=systolic pulmonary arterial pressures, PVR=pulmonary vascular resistance, PPV=positive predictive value, NPV=negative predictive value, TP=true positive, TN, true negative, FP=false positive, FN=false negative
ANNEX
Parameters Function Low S' (n = 39) Normal S’ (n = 161) n p IVA low 12 (32%) 23 (15%) 35 0.034 normal 26 (68%) 130 (85%) 156 - MPI low 14 (37%) 22 (14%) 36 <0.01 normal 24 (63%) 136 (86%) 160 - RVFAC low 13 (36%) 11 (7%) 24 <0.001 normal 23 (64%) 146 (93%) 169 - RV Strain low 21 (62%) 41 (27%) 62 <0.001 normal 13 (38%) 109 (73%) 122 -
Parameters Function Low RVFAC (n = 25) Normal RVFAC (n = 177) n p
IVA low 7 (29%) 27 (17%) 34 0.16 normal 17 (71%) 135 (83%) 152 - MPI low 8 (32%) 27 (16%) 35 0.053 normal 17 (68%) 146 (84%) 163 - RV Strain low 15 (68%) 47 (28%) 62 <0.001 normal 7 (32%) 120 (72%) 127 - S’ low 13 (54%) 23 (14%) 36 <0.001 normal 11 (46%) 146 (86%) 157 -
Parameters Function high MPI (n = 37) Normal MPI (n = 167) n p
IVA low 9 (26%) 26 (17%) 35 0.32 normal 26 (74%) 129 (83%) 155 - RVFAC low 8 (23%) 17 (10%) 25 0.053 normal 27 (77%) 146 (90%) 173 - RV Strain low 10 (29%) 54 (35%) 64 0.59 normal 25 (71%) 100 (65%) 125 - S’ low 14 (39%) 24 (15%) 38 <0.01 normal 22 (61%) 136 (85%) 158 -
Parameters Function Low IVA (n = 35) Normal IVA (n = 157) n p
MPI low 9 (26%) 26 (17%) 35 0.32 normal 26 (74%) 129 (83%) 155 - RVFAC low 7 (21%) 17 (11%) 24 0.16 normal 27 (79%) 135 (89%) 162 - RV Strain low 13 (41%) 49 (34%) 62 0.6 normal 19 (59%) 96 (66%) 115 - S’ low 12 (34%) 26 (17%) 38 0.034 normal 23 (66%) 130 (83%) 153 -
Parameters Function Low RV Strain (n = 64) Normal RV Strain (n = 128) n p
IVA low 13 (21%) 19 (17%) 32 0.6 normal 49 (79%) 96 (83%) 145 - MPI low 10 (16%) 25 (20%) 35 0.59 normal 54 (84%) 100 (80%) 154 - RVFAC low 15 (24%) 7 (5.5%) 22 <0.001 normal 47 (76%) 120 (94.5%) 167 - S’ low 21 (34%) 13 (11%) 34 <0.001 normal 41 (66%) 109 (89%) 150 - Annex 1: Details of discordance between the five validated parameters
RVFAC = right ventricle fraction area change, IVA= isovolumic acceleration, RV strain = right ventricle strain, MPI=myocardium performance index
Mismatch (n = 107) Match (n = 74) p Age (years) 69 (±13) 68 (±14) 0.56 Body Surface (m2) 1.89 (±0.2) 1.89 (±0.3) 0.24 sBP (mmHg) 142 (±24) 148 (±21) 0.0492 Heart Rate (bpm) 73 (±13) 72 (±12) 0.51 S' 12.0 (±3.5) 13.4 (±3.3) <0.001 RVFAC (%) 44 (±10) 48 (±8) <0.01 IVA(m/s2) 3.0 (±1.6) 3.7 (±1.4) <0.01 RV strain -21.4 (±6.9) -27.2 (±8.1) <0.001 MPI 0.48 (±0.22) 0.36 (±0.14) <0.001 Cardiac Index (l/min/m2) 3.2 (±0.818) 3.4 (±1.4) 0.34
RVOTTVI (cm) 14 (±5) 15 (±3) 0.067
cardiac Flow (l/min) 6.0 (±1.5) 63 (±2.8) 0.42
Base to apex length (mm) 72 (±13) 68 (±17) 0.19
RV Diastolic Area 19.2 (±6.0) 18.8 (±6.6) 0.65 RV Systolic Area 10.8 (±4.1) 9.8 (±4.1) 0.091 RA 18 (±7) 17 (±7) 0.97 IVC variation 0.78 (±0.22) 0.80(±0.21) 0.65 IVCT 72 (±23) 61 (±16) <0.001 IVRT 57 (±37) 43 (±29) <0.01 Ejection time 285 (±45) 295 (±44) 0.12 LVEF 62(±14) 66 (±12) 0.049 SPAP using PR 44 (±16) 40 (±17) 0.35 SPAP using TR 38 (±14) 40 (±12) 0.41 PVR 0.24 (±0. 0.21 (±0.10) 0.16 Rhythm 10 (7.8%) 2 (2.6%) - Sex 95 (74%) 52 (68%) 0.38 33 (26%) 25 (32%) - Dyspnea 53 (43%) 29 (39%) 0.54 48 (39%) 36 (48%) - 20 (16%) 10 (13%) - 2 (1.6%) 0 (0%) - Mismatch 4/5 3/5 2/5 1/5 7 (5.5%) - 14 (11%) - 39 (30%) - 68 (53%) - Aortic disease 2 (2%) 3 (4.1%) 0.65 Dilated cardiomyopathy 7(7%) 2 (2.7%) 0.31 Ischemic cardiomyopathy 11 (11%) 9 (12%) 0.98 Dialysis 5 (5%) 0 (0%) 0.074 Dyspnea 10 (5%) 2 (2.7%) 0.7 Atrial fibrillation 4 (4%) 2 (2.7%) 1 Aortic regurgitation 0 (0%) 2 (2.7%) 0.18 Mitral regurgitation 3 (3%) 4 (5.4%) 0.46 Tricuspid regurgitation 1 (0.78%) 0 (0%) 0.46 Normal 21 (21%) 19 (26%) 0.56 Aortic stenosis 25 (25%) 20 (27%) 0.87 -
Annex 2: Comparison between match and mismatch population
Annex 3 : Correlation between RV function parameters
RVFAC = right ventricle fraction area change, IVA= isovolumic acceleration, RV strain = right ventricle strain, MPI=myocardium performance index,
Correlation coefficient (CI95)
S' p RVFAC p MPI p IVA p RV Strain p
S’ 0.15 (0.01; 0.28) 0.041 -0.22 (-0.35; -0.09) <0.01 0.42 (0.30; 0.53) <0.001 0.22 (0.08; 0.35) <0.01
RVFAC 0.15 (0.01; 0.28) 0.041 -0.07 (-0.21; 0.07) 0.33 0.03 (-0.11; 0.18) 0.64 0.24 (0.10; 0.37) <0.01
MPI -0.22 (-0.35; -0.09) <0.01 -0.07 (-0.21; 0.07) 0.33 -0.16 (-0.30; -0.018) 0.028 -0.07 (-0.22; 0.07) 0.31
IVA 0.42 (0.30; 0.53) <0.001 0.03 (-0.11; 0.18) 0.64 -0.16 (-0.30; -0.02) 0.028 0.08 (-0.07; 0.22) 0.32
mean (standard deviation) median [Q25-75] min max n ESPAR 1.57 (0.912) 1.32 [0.960; 1.92] 0.448 5.71 191 LAI 33.2 (11.0) 31.0 [25.9; 39.2] 16.5 75.6 92 S’*SPAP 333 (197) 280 [195; 442] 88.0 1190 189 S’*PVR 2.70 (1.65) 2.36 [1.64; 3.17] 0.884 11.5 129 STRAIN/SPAP 620 (347) 533 [375; 798] 156 1918 181 STRAIN*PVR 4.77 (2.11) 4.37 [3.25; 5.80] 1.34 13.9 126
Annex 4: Load indexed parameters characteristics
RV=right ventricle, ESPAR=RV end-systolic pressure–area ratio, LAI : load-adaptation index , SPAP=systolic pulmonary arterial pressures, PVR=pulmonary vascular resistance
BIBLIOGRAPHY
1 D. Chemla, “Physiologie du couplage entre le ventricule droit et la circulation pulmonaire,” Réanimation 23, no. 4 (July 2014): 402–11, https://doi.org/10.1007/s13546-014-0904-y.
2 François Haddad et al., “Right Ventricular Function in Cardiovascular Disease, Part I: Anatomy, Physiology, Aging, and Functional Assessment of the Right Ventricle,” Circulation
117, no. 11 (March 18, 2008): 1436–48,
https://doi.org/10.1161/CIRCULATIONAHA.107.653576.
3 D. D. Glower et al., “Linearity of the Frank-Starling Relationship in the Intact Heart: The Concept of Preload Recruitable Stroke Work,” Circulation 71, no. 5 (May 1985): 994–1009. 4 Anton Vonk-Noordegraaf and Nico Westerhof, “Describing Right Ventricular Function,” The
European Respiratory Journal 41, no. 6 (June 2013): 1419–23,
https://doi.org/10.1183/09031936.00160712.
5 Lawrence G. Rudski et al., “Guidelines for the Echocardiographic Assessment of the Right Heart in Adults: A Report from the American Society of Echocardiography Endorsed by the European Association of Echocardiography, a Registered Branch of the European Society of Cardiology, and the Canadian Society of Echocardiography,” Journal of the American Society of Echocardiography: Official Publication of the American Society of Echocardiography 23, no. 7 (July 2010): 685-713-788, https://doi.org/10.1016/j.echo.2010.05.010.
6 Michael Dandel et al., “Load Dependency of Right Ventricular Performance Is a Major Factor to Be Considered in Decision Making before Ventricular Assist Device Implantation,”
Circulation 128, no. 11 Suppl 1 (September 10, 2013): S14-23,
https://doi.org/10.1161/CIRCULATIONAHA.112.000335.
7 Michael Dandel and Roland Hetzer, “Echocardiographic Assessment of the Right Ventricle: Impact of the Distinctly Load Dependency of Its Size, Geometry and Performance,”
International Journal of Cardiology 221 (October 15, 2016): 1132–42,
https://doi.org/10.1016/j.ijcard.2016.07.014.
8 Andre La Gerche et al., “Exercise-Induced Right Ventricular Dysfunction Is Associated with Ventricular Arrhythmias in Endurance Athletes,” European Heart Journal 36, no. 30 (August 7, 2015): 1998–2010, https://doi.org/10.1093/eurheartj/ehv202.
9 “L’ÉTAT DE SANTÉ DE LA POPULATION EN FRANCE Rapport 2017”
10 Shuji Hayashi et al., “Age- and Gender-Specific Changes of Tricuspid Annular Motion Velocities in Normal Hearts,” Journal of Cardiology 65, no. 5 (May 2015): 397–402, https://doi.org/10.1016/j.jjcc.2014.06.013.
11 Jesper Kjaergaard et al., “Impact of Preload and Afterload on Global and Regional Right Ventricular Function and Pressure: A Quantitative Echocardiography Study,” Journal of the American Society of Echocardiography: Official Publication of the American Society of
Echocardiography 19, no. 5 (May 2006): 515–21, https://doi.org/10.1016/j.echo.2005.12.021.
12 Michael Vogel et al., “Validation of Myocardial Acceleration during Isovolumic Contraction as a Novel Noninvasive Index of Right Ventricular Contractility: Comparison with Ventricular Pressure-Volume Relations in an Animal Model,” Circulation 105, no. 14 (April 9, 2002): 1693–99.
13 Morten Dalsgaard et al., “Isovolumic Acceleration Measured by Tissue Doppler
Echocardiography Is Preload Independent in Healthy Subjects,” Echocardiography (Mount Kisco, N.Y.) 24, no. 6 (July 2007): 572–79,
https://doi.org/10.1111/j.1540-8175.2007.00454.x.
14 Abdenasser Drighil et al., “Immediate Impact of Successful Percutaneous Mitral Valve Commissurotomy on Echocardiographic Measures of Right Ventricular Contractility,” Journal of the American Society of Echocardiography: Official Publication of the American Society of Echocardiography 25, no. 11 (November 2012): 1245–50,
https://doi.org/10.1016/j.echo.2012.08.010.
15 Jérôme Peyrou et al., “Preoperative Right Ventricular Dysfunction Is a Strong Predictor of 3 Years Survival after Cardiac Surgery,” Clinical Research in Cardiology: Official Journal of
17 C. Tei et al., “Noninvasive Doppler-Derived Myocardial Performance Index: Correlation with Simultaneous Measurements of Cardiac Catheterization Measurements,” Journal of the American Society of Echocardiography: Official Publication of the American Society of Echocardiography 10, no. 2 (March 1997): 169–78.
18 B. W. Eidem et al., “Usefulness of the Myocardial Performance Index for Assessing Right Ventricular Function in Congenital Heart Disease,” The American Journal of Cardiology 86, no. 6 (September 15, 2000): 654–58.
19 Darryl Miller et al., “The Relation between Quantitative Right Ventricular Ejection
Fraction and Indices of Tricuspid Annular Motion and Myocardial Performance,” Journal of the American Society of Echocardiography: Official Publication of the American Society of Echocardiography 17, no. 5 (May 2004): 443–47,
https://doi.org/10.1016/j.echo.2004.01.010.
20 John A. Lakoumentas et al., “The Tei Index of Myocardial Performance: Applications in Cardiology,” Hellenic Journal of Cardiology: HJC = Hellenike Kardiologike Epitheorese 46, no. 1 (February 2005): 52–58.
21 Julien Guihaire, “Remodelage du Ventricule droit dans l’hypertension Pulmonaire Chronique Expérimentale” thèse université Paris Sud , Pairx XI, 2014. https://tel.archives-ouvertes.fr/file/index/docid/800410/filename/these_definitive
22 Leah Wright et al., “Afterload Dependence of Right Ventricular Myocardial Strain,” Journal of the American Society of Echocardiography: Official Publication of the American Society of Echocardiography 30, no. 7 (July 2017): 676–684.e1,
https://doi.org/10.1016/j.echo.2017.03.002.
23 Matteo Cameli et al., “Right Ventricular Longitudinal Strain Correlates Well with Right Ventricular Stroke Work Index in Patients with Advanced Heart Failure Referred for Heart Transplantation,” Journal of Cardiac Failure 18, no. 3 (March 2012): 208–15, https://doi.org/10.1016/j.cardfail.2011.12.002.
24 Soulef Guendouz et al., “Prognostic Significance and Normal Values of 2D Strain to Assess Right Ventricular Systolic Function in Chronic Heart Failure,” Circulation Journal: