Performance of creatinine- or cystatin C-based
equations to
estimate glomerular filtration rate in sub-Saharan African
populations
Justine B. Bukabau1,7, Eric Yayo2,7, Appolinaire Gnionsahé3, Dagui Monnet2, Hans Pottel4, Etienne Cavalier5, Aliocha Nkodila1, Jean Robert R. Makulo1, Vieux M. Mokoli1, François B. Lepira1, Nazaire M. Nseka1, Jean-Marie Krzesinski6, Ernest K. Sumaili1,7 and Pierre Delanaye6,7
1 Renal Unit, Department of Internal Medicine, Kinshasa University Hospital, University of Kinshasa, Kinshasa,
Democratic Republic of Congo; 2Département de Biochimie, UFR Sciences Pharmaceutiques et Biologiques, Université
Felix Houphouet Boigny Abidjan, Ivory Coast; 3Département de Néphrologie, UFR Sciences Médicales, Université Felix
Houphouet Boigny, Abidjan, Ivory Coast; 4Department of Public Health and Primary Care, KU Leuven Campus Kulak
Kortrijk, Kortrijk, Belgium; 5 Division of Clinical Chemistry, CHU Sart Tilman (ULg CHU), University of Liège, Liège,
Belgium; and 6Division of Nephrology-Dialysis-Transplantation, CHU Sart Tilman (ULg CHU), University of Liège,
Liège, Belgium
7JBB, EY, EKS, and PD contributed equally to this work.
KEYWORDS : creatinine; cystatin C; glomerular filtration rate; iohexol; sub-Saharan Africa
ABSTRACT
Glomerular filtration rate (GFR) is the best index for kidney function; however, the applicability of GFR estimating equations in sub-Saharan African populations remains unclear. In a cross-sectional study of adults living in Kinshasa, Democratic Republic of Congo (n = 210) and Abidjan, Ivory Coast (n = 284), we evaluated the performance of creatinine and cystatin C-based equations using plasma clearance of iohexol as the reference standard. The race coefficient did not improve the performance of creatinine-based GFR estimates; in fact, both the Modification of Diet in Renal Disease (MDRD) and Chronic Kidney Disease Epidemiology (CKD-EPI) equations performed better without the race coefficient in participants with GFR ≥60 mL/min/1.73m2. The CKD-EPI and Full Age Spectrum (FAS) equations were unbiased and had similar precision (SD of 17.9 versus 19 mL/min/1.73 m2) and accuracy within 30% (P30, 86.7% versus 87.4%) in participants with GFR ≥60 mL/min/1.73m2. Both equations performed poorly in the subgroup with measured GFR < 60 mL/min/1.73m2 (n=80), but the FAS equation had smaller bias (— 4.8 mL/min/1.73m2 versus —7.7 mL/min/1.73m2 for CKD-EPI) and higher P30 (56.3% versus 31.3% for CKD-EPI). The corresponding equations including cystatin C alone or in combination with creatinine had similar performance. In a sub-Saharan African population, adjustment for race did not improve the performance of GFR estimating equations. The creatinine-based FAS and CKD-EPI equations performed reasonably well and were comparable when GFR was ≥ 60 mL/min/1.73m2. Cystatin C did not improve performance. The FAS equation may be preferable when GFR is < 60 mL/min/1.73m2, but this should be confirmed in larger studies.
Chronic kidney disease (CKD) is recognized as a worldwide public health problem.1-4 CKD is defined as the presence of persistent kidney damage (most of the time albuminuria) and/or decreased glomerular filtration rate (GFR) (<60 ml/min per 1.73 m2) for >3 months. Based on these 2 criteria (GFR and albuminuria), a staging system is proposed.5 Adverse outcomes of CKD such as end-stage renal disease, cardiovascular disease, and premature death can be prevented or delayed when treatment is initiated in the early stages of disease.6-8 Prevention is of paramount importance in low-income countries with no or limited access to dialysis techniques.2,9,10 In this context, GFR is the best quantitative marker of renal function. Measurement of GFR by using reference methods is, however, not easily feasible, especially in low-income countries. In clinical practice, GFR is thus estimated from endogenous biomarkers including creatinine and cystatin C (CysC),11, 2 those biomarkers being used in equations with other variables such as age, sex, and potentially ethnicity. Nowadays, the Modification of Diet in Renal Disease (MDRD)13 and Chronic Kidney Disease Epidemiology Collaboration (CKD-EPI)14 creatinine-based equations are the most used. Recently, a new equation, the "Full Age Spectrum" (FAS),15 was developed using serum creatinine (SCr) normalized or rescaled by the median normal creatinine concentration (Q) for age and sex.15,16 A mathematical factor is also applied to reflect the physiological decrease in GFR with aging.17 This concept allows the use of the same equation for different biomarkers and for subjects ranging from 2-years-old to the aging people (see Supplementary Methods for more details on the FAS equation and Q values). However, this equation has only been validated in Whites. Also, relatively few studies have considered the performance of the CKD-EPI and MDRD equations in African people, and most were focused on healthy adult black Africans and/or in one country.18-20 In the present analysis, we evaluated the performance of different equations (Table 1) for GFR estimation in a large cohort of sub-Saharan African people from 2 countries, including patients with CKD. Our goal was to study 3 topics of clinical interest for nephrologists in Africa regarding estimating GFR. First, we studied the relevance of ethnic corrections in the existing equations. The MDRD and CKD-EPI equations were thus considered and compared with and without the African American ethnic factors (ef) (MDRD ef or MDRD and CKD-EPI ef or CKD-EPI).18,19,21,22 In the same view, specific Q values for African people were proposed for the creatinine-based FAS equation. The creatinine-based FAS equation was considered with these Q values (FAS af) or with the values for Whites (FAS). Second, we compared the performance of different creatinine-based equations, as creatinine is nowadays the only biomarker used in developing countries. Third, we studied the potential added value of CysC-based equations (FAS CysC and CKD-EPI CysC; CysC-based equations do not require ethnic adaptation) and equations combining both biomarkers (CKD-EPI combined and FAS combined) in each equation model (CKD-EPI and MDRD vs. CKD-EPI CysC or CKD-EPI combined and FAS SCr vs. FAS CysC or FAS combined).23-25
MDRD 175 x SCr-1.154 x age-0.203 x (0.742 if female) x (1.212 if black) CKD-EPI SCr Female SCr ≤0.7 mg/dl 144 x (SCr/0.7)-0.329 x 0.993age x (1.159 if black) SCr >0.7 mg/dl 144 x (SCr/0.7)-1.209 x 0.993age x (1.159 if black) Male SCr ≤0.9 mg/dl 141 x (SCr/0.9)-0∙411 x 0.993age x (1.159 if black) SCr >0.9 mg/dl 141 x (SCr/0.9)-1.209 x 0.993age x (1.159 if black) CKD-EPI CysC
CysC ≤0.8 mg/l 133 x (CysC/0.8)-0∙499 x 0.996age x (0.932 if female)
CysC >0.8 mg/l 133 x (CysC/0.8)-1.328 x 0.996age x (0.932 if female)
CKD-EPI combined Female
SCr ≤0.7 mg/dl and CysC ≤0.8 mg/dl 130 x (SCr/0.7)-0∙248 x (CysC/0.8)-0∙375 x 0.995age x (1.08 if
black)
SCr ≤0.7 mg/dl and CysC >0.8 mg/dl 130 x (SCr/0.7)-0∙248 x (CysC/0.8)-0∙711 x 0.995age x (1.08 if
black)
SCr >0.7 mg/dl and CysC ≤0.8 mg/dl 130 x (SCr/0.7)-0∙601 x (CysC/0.8)-0∙375 x 0.995age x (1.08 if
black)
SCr >0.7 mg/dl and CysC >0.8 mg/dl 130 x (SCr/0.7)-0∙601 x (CysC/0.8)-0∙711 x 0.995age x (1.08 if
black) Male
SCr ≤0.9 mg/dl and CysC ≤0.8 mg/dl 135 x (SCr/0.9)-0∙207 x (CysC/0.8)-0∙375 x 0.995age x (1.08 if
black)
SCr ≤0.9 mg/dl and CysC >0.8 mg/dl 135 x (SCr/0.9)-0∙207 x (CysC/0.8)-0∙711 x 0.995age x (1.08 if
black)
SCr >0.9 mg/dl and CysC ≤0.8 mg/dl 135 x (SCr/0.9)-0∙601 x (CysC/0.8)-0∙375 x 0.995age x (1.08 if
black)
SCr >0.9 mg/dl and CysC >0.8 mg/dl 135 x (SCr/0.7)-0∙601 x (CysC/0.8)-0∙711 x 0.995age x (1.08 if
black) FAS
SCr 107.3/(SCr/Qcrea) when 2 ≤ age ≤ 40 yr
107.3/(SCr/Qcrea) [x (0.988) (age-40) when age >40 yr]
CysC 107.3/(CysC/Qcys) [x (0.988)(age-40) when age >40 yr]
Combined 107.3/[α x (SCr/Qcrea) + (1-α)x (CysC/Qcys)] [x 0.988(age-40)
when age >40 yr] (α = 0.5)
CKD-EPI combined, Chronic Kidney Disease Epidemiology Collaboration equation combining creatinine and cystatin C; CKD-EPI CysC, Chronic Kidney Disease Epidemiology Collaboration equation based on cystatin C; CKD-EPI SCr, Chronic Kidney Disease Epidemiology Collaboration equation based on serum creatinine without the ethnic correction factor; CysC, cystatin C; FAS, Full Age Spectrum; MDRD, Modification of Diet in Renal Disease; Qcrea, Q value for serum creatinine; Qcys, Q value for cystatin C; SCr, serum creatinine.
RESULTS
GENERAL CHARACTERISTICS OF THE STUDY POPULATION
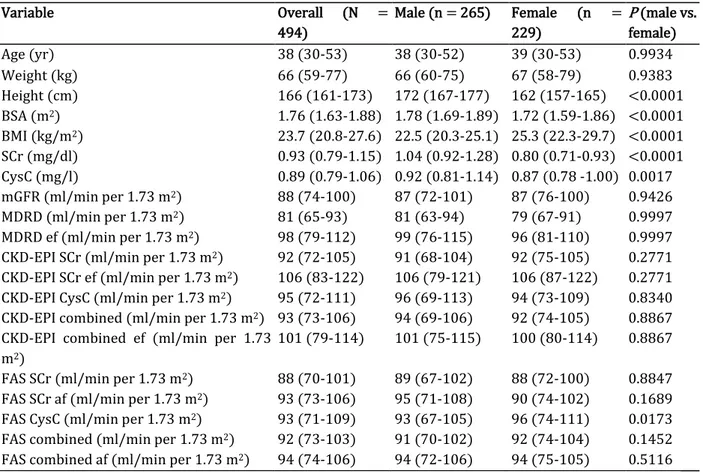
Table 2 presents the general characteristics of participants in the whole cohort and according to sex. A total of 494 (46.4% of women) adult participants were included in the present study. The median age was 38 years (interquartile range, 30-53 years); the median body surface area and body mass index were 1.76 m2 (interquartile range, 1.63-1.88 m2) and 24 kg/m2 (interquartile range, 21-28 kg/m2), respectively. The median measured GFR (mGFR) of participants was 88 ml/min per 1.73 m2 (interquartile range, 74-100 ml/min per 1.73 m2).
Table 2. General characteristics of the study population
Variable Overall (N = 494) Male (n = 265) Female (n = 229) P (male vs. female) Age (yr) 38 (30-53) 38 (30-52) 39 (30-53) 0.9934 Weight (kg) 66 (59-77) 66 (60-75) 67 (58-79) 0.9383 Height (cm) 166 (161-173) 172 (167-177) 162 (157-165) <0.0001 BSA (m2) 1.76 (1.63-1.88) 1.78 (1.69-1.89) 1.72 (1.59-1.86) <0.0001 BMI (kg/m2) 23.7 (20.8-27.6) 22.5 (20.3-25.1) 25.3 (22.3-29.7) <0.0001 SCr (mg/dl) 0.93 (0.79-1.15) 1.04 (0.92-1.28) 0.80 (0.71-0.93) <0.0001 CysC (mg/l) 0.89 (0.79-1.06) 0.92 (0.81-1.14) 0.87 (0.78 -1.00) 0.0017 mGFR (ml/min per 1.73 m2) 88 (74-100) 87 (72-101) 87 (76-100) 0.9426 MDRD (ml/min per 1.73 m2) 81 (65-93) 81 (63-94) 79 (67-91) 0.9997 MDRD ef (ml/min per 1.73 m2) 98 (79-112) 99 (76-115) 96 (81-110) 0.9997
CKD-EPI SCr (ml/min per 1.73 m2) 92 (72-105) 91 (68-104) 92 (75-105) 0.2771
CKD-EPI SCr ef (ml/min per 1.73 m2) 106 (83-122) 106 (79-121) 106 (87-122) 0.2771
CKD-EPI CysC (ml/min per 1.73 m2) 95 (72-111) 96 (69-113) 94 (73-109) 0.8340
CKD-EPI combined (ml/min per 1.73 m2) 93 (73-106) 94 (69-106) 92 (74-105) 0.8867
CKD-EPI combined ef (ml/min per 1.73 m2)
101 (79-114) 101 (75-115) 100 (80-114) 0.8867
FAS SCr (ml/min per 1.73 m2) 88 (70-101) 89 (67-102) 88 (72-100) 0.8847
FAS SCr af (ml/min per 1.73 m2) 93 (73-106) 95 (71-108) 90 (74-102) 0.1689
FAS CysC (ml/min per 1.73 m2) 93 (71-109) 93 (67-105) 96 (74-111) 0.0173
FAS combined (ml/min per 1.73 m2) 92 (73-103) 91 (70-102) 92 (74-104) 0.1452
FAS combined af (ml/min per 1.73 m2) 94 (74-106) 94 (72-106) 94 (75-105) 0.5116
BMI, body mass index; BSA, body surface area; CKD-EPI combined, Chronic Kidney Disease Epidemiology Collaboration equation combining creatinine and cystatin C; CKD-EPI combined ef, Chronic Kidney Disease Epidemiology Collaboration equation with the ethnic factor; CKD-EPI CysC, CKD-EPI equation based on cystatin C; CKD-EPI SCr, Chronic Kidney Disease Epidemiology Collaboration equation based on serum creatinine without the ethnic correction factor; CKD-EPI SCr ef, Chronic Kidney Disease Epidemiology Collaboration equation based on serum creatinine with the ethnic factor; CysC, cystatin C; FAS combined, Full Age Spectrum equation based on creatinine and cystatin C with White Q; FAS combined af, Full Age Spectrum equation combined with African Q; FAS CysC, FAS equation based on cystatin C; FAS SCr, Full Age Spectrum equation based on serum creatinine with White Q; FAS SCr af, Full Age Spectrum equation based on serum creatinine with African Q; MDRD, Modification of Diet in Renal Disease; MDRD ef, Modification of Diet in Renal Disease with the ethnic factor; mGFR, measured glomerular filtration rate; SCr, serum creatinine. Data are median (interquartile range).
COMPARISON OF EQUATIONS WITH OR WITHOUT ETHNIC CORRECTIONS
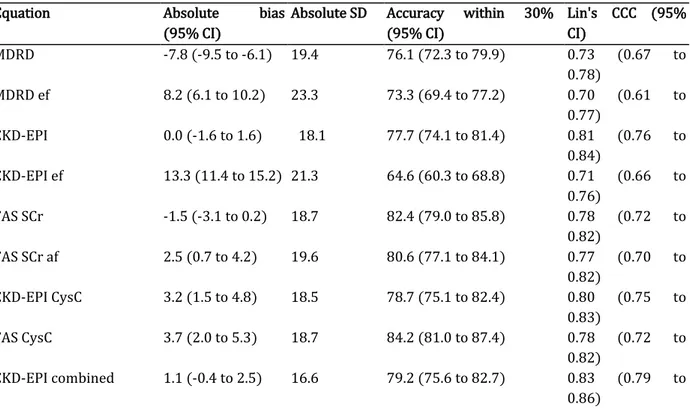
In the whole cohort (N = 494), both FAS SCr and CKD-EPI were unbiased whereas FAS SCr af, MDRD, MDRD ef, and CKD-EPI ef had a significant bias. Among these biased equations, bias of MDRD ef and MDRD had opposite signs (8.2 ml/min per 1.73 m2 vs. —7.8 ml/min per 1.73 m2) but equal absolute magnitude (8.2 ml/min per 1.73 m2 vs. 7.8 ml/min per 1.73 m2). Regarding precision, FAS SCr and FAS SCr af had the same precision (SD, 18.7 and 19.6 ml/min per 1.73 m2, respectively) but MDRD ef and CKD-EPI ef had lower precision than did MDRD and CKD-EPI, respectively (SD, 19.4 ml/min per 1.73 m2 vs. 23.3 ml/min per 1.73 m2 and 18.1 ml/min per 1.73 m2 vs. 21.3 ml/min per 1.73 m2, respectively). The accuracy within 30% (P30) of CKD-EPI ef was lower than that of CKD-EPI (64.6% vs. 77.7%; P < 0.0001), whereas P30 of MDRD (76.1%) was not different from that of MDRD ef (73.3%). Also, both FAS SCr and FAS SCr af had similar accuracy (82.4% vs. 80.6%, respectively) (Table 3).
In the subgroup with GFR >60 ml/min per 1.73 m2 (n = 414), the same observations were made as in the whole cohort, except that absolute bias of MDRD ef was significantly higher than that of MDRD (10.4 ml/min per 1.73 m2 vs. 7.6 ml/min per 1.73 m2; P = 0.0033) and that precision of CKD-EPI (SD, 17.9 ml/min per 1.73 m2) was similar to that of CKD-EPI ef (SD, 19.9 ml/min per 1.73 m2) (Supplementary Table S1).
In the subgroup with GFR <60 ml/min per 1.73 m2 (n = 80), MDRD ef, CKD-EPI ef, and FAS SCr af appearedunbiased whereas FAS SCr, MDRD, and CKD-EPI had bias significantly different from zero (—4.8 ml/min per 1.73 m2 vs. —9.0 ml/min per 1.73 m2 vs. —7.7 ml/min per 1.73 m2, respectively). Precision of all equations was comparable. P30 of equations without ethnic corrections was not different from P30 of the corresponding equation with ethnic corrections (Supplementary Table S2).
Table 3. Performance of equations in the whole cohort (N = 494)
Equation Absolute bias
(95% CI)
Absolute SD Accuracy within 30% (95% CI) Lin's CCC (95% CI) MDRD -7.8 (-9.5 to -6.1) 19.4 76.1 (72.3 to 79.9) 0.73 (0.67 to 0.78) MDRD ef 8.2 (6.1 to 10.2) 23.3 73.3 (69.4 to 77.2) 0.70 (0.61 to 0.77) CKD-EPI 0.0 (-1.6 to 1.6) 18.1 77.7 (74.1 to 81.4) 0.81 (0.76 to 0.84) CKD-EPI ef 13.3 (11.4 to 15.2) 21.3 64.6 (60.3 to 68.8) 0.71 (0.66 to 0.76) FAS SCr -1.5 (-3.1 to 0.2) 18.7 82.4 (79.0 to 85.8) 0.78 (0.72 to 0.82) FAS SCr af 2.5 (0.7 to 4.2) 19.6 80.6 (77.1 to 84.1) 0.77 (0.70 to 0.82) CKD-EPI CysC 3.2 (1.5 to 4.8) 18.5 78.7 (75.1 to 82.4) 0.80 (0.75 to 0.83) FAS CysC 3.7 (2.0 to 5.3) 18.7 84.2 (81.0 to 87.4) 0.78 (0.72 to 0.82) CKD-EPI combined 1.1 (-0.4 to 2.5) 16.6 79.2 (75.6 to 82.7) 0.83 (0.79 to 0.86)
CKD-EPI combined ef 7.8 (6.2 to 9.4) 18.1 76.7 (73.0 to 80.5) 0.80 (0.75 to 0.83) FAS combined 0.1 (-1.3 to 1.5) 15.8 86.4 (83.4 to 89.5) 0.84 (0.79 to 0.87) FAS combined af 2.1 (0.7 to 3.5) 16.1 85.4 (82.3 to 88.6) 0.83 (0.78 to 0.86)
CI, confidence interval; CKD-EPI, Chronic Kidney Disease Epidemiology Collaboration; CKD-EPI combined, Chronic Kidney Disease Epidemiology Collaboration equation combining creatinine and cystatin C; CKD-EPI combined ef, Chronic Kidney Disease Epidemiology Collaboration equation with the ethnic factor; CKD-EPI CysC, Chronic Kidney Disease Epidemiology Collaboration equation based on cystatin C; FAS combined, Full Age Spectrum equation based on creatinine and cystatin C with White Q; FAS combined af, Full Age Spectrum equation combined with African Q; FAS CysC, Full Age Spectrum equation based on cystatin C; FAS SCr, Full Age Spectrum equation based on serum creatinine with White Q; FAS SCr af, Full Age Spectrum equation based on serum creatinine with African Q; Lin's CCC , Lin's concordance correlation coefficient; MDRD, Modification of Diet in Renal Disease; MDRD ef, Modification of Diet in Renal Disease with the ethnic factor.
COMPARISON OF EQUATIONS BASED ON SCR
Because of the poorer results of equations with ethnic corrections, only equations without ethnic corrections have been compared in this section. In the whole cohort (N = 494), FAS SCr and CKD-EPI were unbiased whereas MDRD significantly underestimated GFR. The 3 equations had the same precision. P30 of FAS SCr was significantly higher than that of CKD-EPI (82.4% vs. 77.7%; P =0.0022) and MDRD (82.4% vs. 76.1%; P = 0.0002), with no difference between MDRD and CKD-EPI (Table 3).
In the subgroup with GFR >60 ml/min per 1.73 m2 (n = 414), the same observations were made as in the whole cohort, except that P30 was not different between the 3 equations (Supplementary Table S1).
In the subgroup with GFR <60 ml/min per 1.73 m2 (n = 80), all equations underestimated GFR but absolute bias of FAS SCr was smaller than that of CKD-EPI (4.8 ml/min per 1.73 m2 vs. 7.7 ml/min per 1.73 m2 ; P < 0.0001) and MDRD (4.8 ml/min per 1.73 m2 vs. 9.0 ml/min per 1.73 m2 ; P < 0.0001). Absolute bias of MDRD was larger than that of CKD-EPI (P < 0.0001). Precision of all equations was comparable. P30 of FAS SCr (56.3%) was significantly higher than that of MDRD (31.3%; P < 0.0001) and CKD-EPI (31.3%; P < 0.0001) (Supplementary Table S2). Comparisons of creatinine-based equations are shown in Table 4.
POTENTIAL ADDED VALUE OF CYSC
The CysC-based or combined equations were compared with the corresponding SCr-based equations without ethnic corrections, that is, CKD-EPI with CKD-EPI CysC or CKD-EPI combined and FAS SCr with FAS CysC or FAS combined. In the whole cohort (N = 494), FAS SCr, FAS combined, CKD-EPI, and CKD-EPI combined were unbiased whereas CKD-EPI CysC and FAS CysC overestimated GFR. Bias of FAS CysC was not different from that of CKD-EPI CysC (3.7 ml/ min per 1.73 m2 vs. 3.2 ml/min per 1.73 m2). CKD-EPI (SD, 18.1 ml/min per 1.73 m2), CKD-EPI CysC (SD, 18.5 ml/min per 1.73 m2), and CKD-EPI combined (SD, 16.6 ml/min per 1.73 m2) had the same precision. Also, FAS SCr (SD, 18.7 ml/ min per 1.73 m2) and FAS CysC (SD, 18.7 ml/min per 1.73 m2) had the same precision, but FAS combined (SD, 15.8 ml/minper 1.73 m2) had higher precision than did FAS SCr (P < 0.0001) and FAS CysC (P < 0.0001). P30 of CKD-EPI (77.7%) was not different from that of CKD-EPI CysC (78.7%) or CKD-EPI combined (79.2%), and P30 of
FAS SCr (82.4%) was not different from that of FAS CysC (84.2%) or FAS combined (86.4%) (Table 3).
In the subgroup with GFR >60 ml/min per 1.73 m2 (n = 414) (Supplementary Table S1), the same observations were made regarding bias, except that CKD-EPI combined also overestimated GFR. Absolute bias of CKD-EPI combined was lower than that of CKD-EPI CysC (2.8 ml/min per 1.73 m2 vs. 4.9 ml/min per 1.73 m2 ; P < 0.0001) and FAS CysC (2.8 ml/min per 1.73 m2 vs. 4.4 ml/min per 1.73 m2 ; P = 0.0026). Regarding precision and P30, the same observations were made as in the whole cohort (Supplementary Table S1).
In the subgroup with GFR <60 ml/min per 1.73 m2 (n = 80), only FAS CysC and FAS combined were unbiased whereas all other equations underestimated GFR. Bias of CKD-EPI was not different from that of CKD-EPI CysC or CKD-EPI combined. Precision of all equations was comparable. P30 of CKD-EPI (31.3%) was similar to that of CKD-EPI CysC (41.3%) or CKD-EPI combined (28.8%). P30 of FAS SCr (56.3%) was not different from that of FAS CysC (75%) or FAS combined (61.3%) (Supplementary Table S2).
Table 4. Comparison of performance of the 3 creatinine-based equations (without ethnic corrections)
Variable MDRD CKD-EPI FAS SCr
Bias
Whole cohort (N = 494) -7.8 (-9.5 to -6.1 )d 0.0 (-1.6 to 1.6)a -1.5 (-3.1 to 0.2)a
Participants with GFR ≥60 ml/min per 1.73 m2 (n = 414)
-7.6 (-9.5 to -5.7)d 1.5 (-0.2 to 3.3)a -0.9 (-2.7 to 1.0)a Participants with GFR <60 ml/min per 1.73 m2 (n
= 80) 9.0 (12.6 to -5.4)d 7.7 (11.6 to -3.8)c -4.8 (-8.5 to -1.1 )b Precision (SD) Whole cohort (N = 494) 19.4b 18.1a 18.7b
Participants with GFR ≥60 ml/min per 1.73 m2 (n = 80)
20.0b 17.9a 19.0b
Participants with GFR <60 ml/min per 1.73 m2 (n = 414) 16.2a 17.4b 16.6b P30 Whole cohort (N = 494) 76.1 (72.3 to 79.9)c 77.7 (74.1 to 81.4)c 82.4 (79.0 to 85.8)a Participants with GFR ≥60 ml/min per 1.73 m2 (n
= 414)
84.8 (81.3 to 88.3)b
86.7 (83.4 to 90)b 87.4 (84.2 to 90.7)a Participants with GFR <60 ml/min per 1.73 m2 (n
= 80) 31.3 (20.9 to 41.6)c 31.3 (20.9 to 41.6)c 56.3 (45.1 to 67.4)a
CKD-EPI, Chronic Kidney Disease Epidemiology Collaboration; FAS SCr, Full Age Spectrum equation based on serum creatinine with White Q; MDRD, Modification of Diet in Renal Disease; P30, accuracy within 30%.
Data are median (interquartile range). All bias and precision results are expressed in ml/min per 1.73 m2. All P30 results are
expressed in percentage. Bias: aUnbiased results. Among biased results b-d, absolute bias c is larger than b and absolute bias d is larger
than c. Precision: SDs are not statistically significantly different between equations, abest results; bworst results. P30: aThe best result
among the 3 equations. bResults not different from the best result. cResults with the lowest P30 of the 3 equations, significantly
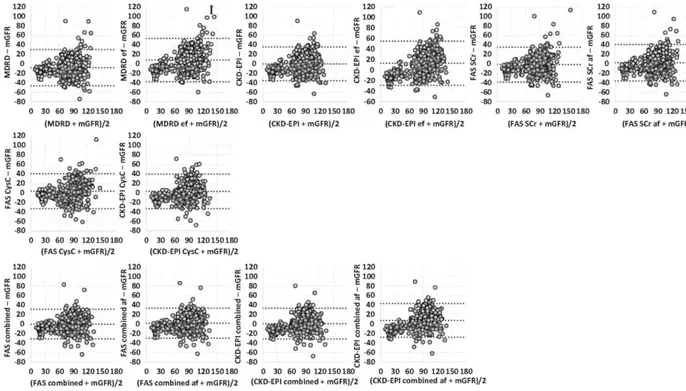
Figure 1. Bland and Altman plots for estimating glomerular filtration rate (eGFR) and measured glomerular filtration rate (mGFR) in the whole population. The x axis represents the mean of eGFR and mGFR. The y axis represents the difference between eGFR and mGFR. The first line has graphs of creatinine-based equations; the second line, graphs of cystatin C-based equations; and the third line, graphs of combined equations. In each plot, the central dotted line represents bias, and the range between 2 other lines represents 95% limits of agreement (=1.96 x SD). Arrows represent outliers. CKD-EPI, Chronic Kidney Disease Epidemiology Collaboration; CKD-EPI combined, Chronic Kidney Disease Epidemiology Collaboration equation combining creatinine and cystatin C; CKD-EPI combined ef, Chronic Kidney Disease Epidemiology Collaboration equation with the ethnic factor; CKD-EPI CysC, Chronic Kidney Disease Epidemiology Collaboration equation based on cystatin C; FAS combined, Full Age Spectrum equation based on creatinine and cystatin C with White Q; FAS combined af, Full Age Spectrum equation combined with African Q; FAS CysC, Full Age Spectrum equation based on cystatin C; FAS SCr, Full Age Spectrum equation based on serum creatinine with White Q; FAS SCr af, Full Age Spectrum equation based on serum creatinine with African Q; MDRD, Modification of Diet in Renal Disease; MDRD ef, Modification of Diet in Renal Disease with the ethnic factor.
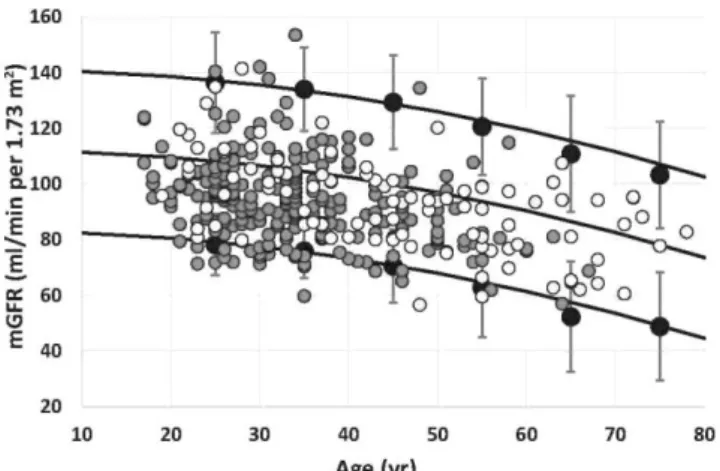
Figure 2. Comparison of measured glomerular filtration rate (mGFR) values in healthy Whites, Congolese, and Ivorian subjects. Solid gray circles represent mGFR results and solid black lines represent 2.5th percentile (Pct), 50th Pct, and 97.5th Pct for mGFR in the Ivorian population (n = 237).18 Solid black circles with error bars represent upper and lower reference limits obtained from the meta-analysis including 633 White potential living kidney donors.26 Added white circles represent Congolese healthy subjects (n = 95).
Table 5. Percentage of participants classified with eGFR in the same staging as with mGFR Percentage of participants
Equation correctly classified
MDRD 52.4 MDRD ef 58.1 CKD-EPI 57.9 CKD-EPI ef 57.1 FAS SCr 59.3 FAS SCr af 60.5 CKD-EPI CysC 58.3 FAS CysC 59.1 CKD-EPI combined 60.3 CKD-EPI combined ef 59.9 FAS combined 59.7 FAS combined af 61.3
CKD-EPI, Chronic Kidney Disease Epidemiology Collaboration; CKD-EPI combined, Chronic Kidney Disease Epidemiology Collaboration equation combining creatinine and cystatin C; CKD-EPI combined ef, Chronic Kidney Disease Epidemiology Collaboration equation with the ethnic factor; CKD-EPI CysC, Chronic Kidney Disease Epidemiology Collaboration equation based on cystatin C; eGFR, estimated glomerular filtration rate; FAS combined, Full Age Spectrum equation based on Caucasian creatinine and cystatin C with Q; FAS combined af, Full Age Spectrum equation combined with African Q; FAS CysC, Full Age Spectrum equation based on cystatin C; FAS SCr, Full Age Spectrum equation based on serum creatinine with Caucasian Q; FAS SCr af, Full Age Spectrum equation based on serum creatinine with African Q; MDRD, Modification of Diet in Renal Disease; MDRD ef, Modification of Diet in Renal Disease with the ethnic factor; mGFR, measured glomerular filtration rate.
BLAND AND ALTMAN PLOT, CONCORDANCE CORRELATION COEFFICIENT, AND
CKD STAGING IN THE WHOLE COHORT
Bland and Altman plots are shown in Figure 1. Regarding Lin's concordance correlation coefficients (CCCs), the single biomarker equations had CCCs of ~0.80, not statistically significantly different from each other, except for MDRD, MDRD ef, and CKD-EPI ef, where Lin's CCCs are closer to 0.70 and significantly different from those of others. The combined equations have significantly higher Lin's CCCs than do the single biomarker equations, except for CKD-EPI ef combined whose performance is less.
The ability of equations to correctly classify a participant in the CKD staging was tested for each equation in the whole cohort. Equations had the same global performance, with 40% of participants being in a different CKD stage with equations than with mGFR (Table 5). The worst
equation was MDRD, with only 52.4% of participants being correctly classified, and the best equation was FAS combined af, with the same staging as mGFR in 61.3% of participants.
PERCENTILES OF NORMAL MGFR
African subjects considered as healthy were compared with percentiles previously established in healthy Whites. Figure 2 demonstrates that percentiles of normal GFR in healthy African subjects matched with those in Whites, both in Ivory Coast and in the Democratic Republic of Congo (DRC).18,26
DISCUSSION
In the present study, we compared the performance of different equations to estimate GFR in the largest cohort from sub-Saharan Africa ever described. SCr is still the best choice among renal biomarkers, especially in low-income countries, as this tool is cheap and easy to perform.27,28 The first important question we wanted to ask was whether ethnic corrections (African American coefficient in MDRD and CKD-EPI and African-derived Q value in FAS) were accurate in the African context. We found that the ethnic factor (>1) in both MDRD and CKD-EPI equations are not accurate in our African population and overestimate GFR. This is particularly the case in healthy subjects with high GFR values. This inadequacy of the ethnic factor for these equations is probably explained by the fact that they have been developed in African American people with different anthropometrical characteristics. Indeed, sub-Saharan blacks have low muscle mass compared with African Americans, potentially secondary to poorer diet or overall health related to HIV infection or other chronic diseases. This point is illustrated by the relatively low body mass index and body surface area of our cohort (24 kg/m2 and 1.73 m2, respectively). It could be argued that MDRD ef, CKD-EPI ef, and FAS SCr af are unbiased in patients with CKD, contrary to the corresponding equations without ethnic factors, but precision and P30 are not different, and, more importantly, the global performance of these equations remained poor when GFR was <60 ml/min per 1.73 m2 (P30, between 41% and 51%). Even in African Americans, the ethnic factor has been questioned in subjects with high GFR values.21 Previous data from Africa (and African European) also suggested that such an ethnic factor was not valuable.18-22,29,30 Regarding ethnicity, we showed that FAS SCr af had the same global performance as FAS SCr observed in Whites, both in patients with low GFR values and in subjects with high GFR values. This is easily explained, as Q af was not different from the Q values observed in Whites. This observation confirmed limited previous data suggesting that SCr normal values were comparable in Africa and Europe.17,31 Regarding reference values, we also confirmed that healthy people from West Africa or Central Africa have the same distribution of mGFR as Whites,17,18 notably with the same decrease in mGFR with aging.32
Among the different SCr-based equations, both CKD-EPI and FAS-SCr equations had the same performance in the whole population and in subjects with GFR >60 ml/min per 1.73 m2. These equations are unbiased, have the same precision, and have the same P30 (only P30 in the whole population was slightly higher for FAS SCr than for CKD-EPI). The poor performance of MDRD
was expected in this population with high GFR values.14 In patients with GFR <60 ml/ min per 1.73 m2, all equations were biased but bias was lower and P30 higher for FAS SCr than for MDRD or CKD-EPI. For the first time, FAS SCr was tested in a large African cohort, and our results confirmed the value of this equation, as suggested by several European studies.15,25,33,34
CysC is a biomarker of interest, notably because its concentration is independent of any tubular secretion effect and of muscular mass.11,23,25 For this reason, most CysC-based equations developed until now are used without any correction for ethnicity.23,25,35However, in our African cohort, we found no substantial added value for CysC when used alone or in combination with SCr in CKD-EPI equations. In FAS equations, we found that FAS combined was unbiased just like FAS SCr. Only precision of FAS combined was higher than that of FAS SCr and FAS CysC in the whole population and in subjects with high GFR values. In patients with CKD, FAS CysC and FAS combined were the only unbiased equations but precision and P30 were not different from those of FAS SCr (only a trend for FAS CysC compared to FAS SCr, 75% vs. 52.2%; P = 0.0107). The potential added values of FAS CysC and FAS combined deserve further evaluation in a larger sample of CKD. These results must also be discussed in the light of cost-effectiveness of a biomarker, namely, CysC, which is much more costly and less available in low-income countries. In our cohort, the performance of all SCr-based equations is particularly poor in patients with CKD (P30 of 31.6% for both MDRD and CKD-EPI, and of 56.3% for FAS SCr). Only FAS CysC had P30 around 75%. Even if this accuracy value is lower than accuracy values observed in European or North American studies,23,25,35 it is comparable to some results observed in Asia24,36 and Africa.20 These results are quite challenging. Several hypotheses can be proposed to explain such poor global performance. Some authors have actually suggested that SCr tubular secretion could be different in Africans and Whites,37 but this point is still debated.29 Another explanation could be the low GFR values of our population with CKD. Indeed, it is well known from the literature that performance of all equations, and notably P30, is poor in patients with low GFR values. Currently, no screening programs for the early detection of CKD are proposed in Ivory Coast and DRC Access to health care and laboratories is also more problematic. For these reasons, patients with CKD followed by nephrologists in these countries are more severely ill and are referred at later CKD stages than those in developing countries with better health care systems.10 This is reflected by several results: in our CKD subgroup (n = 96), we excluded 16 patients with very low GFR values (mGFR <15 ml/min per 1.73 m2). In the remaining 80 patients with CKD, the mean GFR value was still low at 34 ± 12 ml/min per 1.73 m2. Yet, precise estimates of kidney function are critically important for such patients because of their large implications for estimating the prevalence and classification of CKD for the appropriate management of comorbid conditions and medication dosing. Further studies in African patients with CKD are thus needed.
Our study has several limitations. Even if it is the largest cohort of sub-Saharan African people with mGFR, the proportion of patients with CKD is still small. Moreover, our study was limited to African people living in Africa. Our conclusion might not be valid for Africans living in other continents. Ideally, our results should have included Whites as a sort of control group. Also, GFR was measured with iohexol plasma clearance, a recognized and accepted reference method,38-40 whereas CKD-EPI and MDRD have been developed (in majority) with iothalamate urinary clearance data. Such urinary clearances are, however, much more cumbersome and costly than
plasma clearances, and this is particularly relevant in developing countries. Moreover, the CKD-EPI equation has been favorably tested against iohexol plasma clearance in other cohorts.41
Sensu stricto, the fact that iohexol plasma clearance has never been validated against urinary inulin clearance (the so-called criterion standard for mGFR) in African subjects can be considered as a limitation. Finally, the ability of equations to correctly classify the subject in the currently CKD classification system is limited, as ~ 60% of participants in the same CKD stage with estimating equations and with mGFR were observed. These results are similar to recent data published in Europe.42
In conclusion, we showed that both MDRD and CKD-EPI equations perform better in our African population when the African American ethnic factors are omitted, especially in subjects with high GFR values. FAS SCr af has the same performance as FAS SCr. Among creatinine-based equations, FAS SCr and CKD-EPI equations performed similarly, and we suggest that FAS SCr could be slightly better in patients with CKD, but these results need to be confirmed in larger African CKD cohorts. Keeping in mind the economic aspect, it seems unreasonable to recommend CysC in Africa, but the interest of CysC (and more particularly of the FAS CysC equation) merits to be considered in patients with CKD and low GFR values. Further studies using this equation in this specific African population are also needed.
METHODS
This was a cross-sectional study enrolling 510 participants living in Kinshasa (n = 222), the capital of the DRC and in Abidjan (n =288), the most populated city of Ivory Coast. Patients with low GFRvalues (<15 ml/min per 1.73 m2; n =16) were excluded from the analyses because the performance of all equations was poor in this range of GFR. Analyses presented here thus concerned 494 participants (210 from DRC and 284 from Ivory Coast). In Kinshasa, participants were visited twice at home by trained research personnel, who recorded information on demographic characteristics, diet, smoking, alcohol consumption, and use of indigenous herbal remedies. Data about first-degree family relatives; medical history of kidney disease, hypertension, and diabetes; and current treatment were also recorded. All participants were asked to avoid medications that influence GFR (e.g., anti-inflammatory agents, diuretics, and renin-angiotensin blocking agents) and those that can interfere with creatinine secretion (e.g., cimetidine or trimethoprim). Briefly, medication was not allowed except for contraceptives in female participants.
In DRC, healthy persons were randomly selected from the general population as described elsewhere.19 Healthy subjects were all those who did not have hypertension, diabetes mellitus, obesity, urinary abnormalities, and impaired renal function (GFR <60 or >130 ml/ min per 1.73 m2). Patients with CKD were recruited from the general population and from the medical services (Renal Unit of Kinshasa University Hospital). They had a decrease in GFR (<60 ml/ min per 1.73 m2) with or without albuminuria.
In Ivory Coast, healthy subjects were recruited from blood donors and healthy status was assessed by clinical and biological evaluation. Diabetes and hypertension were excluded, and subjects had normal biological results (HIV, hepatitis B or C, and GFR between 60 and 130
ml/min per 1.73 m2) and no albuminuria.18 Patients with CKD were recruited from patients followed by nephrologists at the university hospital of Abidjan.
In the present analyses, the threshold proposed by the Kidney Disease: Improving Global Outcomes, that is, 60 ml/min per 1.73 m2, was used to define low and high GFR values.5
In DRC, the study protocol was approved by the Ethics Committee of the Public Health School of the University of Kinshasa (N°ESP/CE/029/2015) and by the institutional review boards at each site. Written informed consent was obtained from all participants, and all participants with abnormal findings received counseling and educational pamphlets.
In Ivory Coast, the study was approved by the national ethics committee (under the number 039/MSLS/CNER-dkn). A written informed consent was obtained for all participants.
GFR MEASUREMENT AND ESTIMATION
GFR was measured using iohexol plasma clearance (Omnipaque, 240 mg I/ml, GE Healthcare, Machelen, Belgium) as the reference method.39,40 After verification of the participant's identity, a rest of 5 minutes was observed. The syringe with iohexol was weighed before and after the injection to an accuracy of 0.01 g. In the morning, a catheter was placed in a large vein of the forearm and 5 ml of blood was taken at time 0 for the determination of both SCr and CysC. By the same vein, 5 ml of iohexol was injected before removing the catheter and the empty syringe was weighed. Then, 4 blood samples were drawn from a different i.v. access (usually from the contralateral arm) at 120, 180, 240, and 300 minutes after the injection of iohexol. The blood sample was allowed to stand for 30 to 60 minutes before being centrifuged. After centrifugation, samples were stored at — 80 °C. Then, samples were shipped for iohexol measurement at the laboratory of the University of Liège, Belgium, and measured by liquid chromatography-tandem mass spectrometry43 or high performance liquid chromatography44 Concentrations of iohexol measured by high performance liquid chromatography and liquid chromatography-tandem mass spectrometry were calibrated by a factor previously described.45 To ensure the quality of iohexol measurements, the laboratory is accredited for the ISO 15189 standard and also participates in the interlaboratory quality test for iohexol conducted by Equalis AB (Uppsala, Sweden).39 mGFR was then calculated using the slope-intercept method and corrected using the Brochner-Mortensen equation.46 The results were normalized by body surface area by using the Gehan and Georges formula47 as follows: Body surface area — 0.0235 x weight0.51456 x height0.42246
SCr levels were determined in the same laboratory by using an enzymatic method with an IDMS-traceable calibrator using Roche Cobas (Roche Diagnostics, Mannheim, Germany).48 Serum CysC levels were measured by means of the latex immunoturbidimetric method using Roche Cobas (Roche Diagnostics) and standardized to ERM-DA 471/IFCC.49
GFR (in ml/min per 1.73 m2) was estimated by using the following equations: MDRD, CKD-EPI, and FAS using SCr and/or CysC.13--15,25 The FAS equation was used with the Q values for Whites or Africans. African Q values were obtained by calculating the median creatinine concentration for age and sex of healthy subjects in the "PDMRA" (for "Prévalence, détection précoce et prévention des maladies rénales chroniques et facteurs de risque associés" that means prevalence, early detection, and prevention of CKD and associated risks) survey database
(unpublished data): 0.72 mg/dl for women and 0.96 mg/dl for men (see more details in Supplementary Methods). As a reminder, the corresponding Q values for Whites are 0.70 and 0.90 mg/dl, respectively. The MDRD and CKD-EPI equations were studied with and without the ethnic correction factor (African American) (Table 1).
STATISTICAL ANALYSES
All analyses and calculations were performed using SAS 9.4 (SAS Institute Inc., Cary, NC). Data are expressed as mean ± SD when the distribution was normal and as median with interquartile range (quartile 1-quartile 3) when not. Normality was assessed using the Shapiro-Wilk test. The means and medians of 2 groups were compared using the Student f-test or the Mann-Whitney U test, respectively. We assessed the performance of equations using several statistical tools. Lin's CCC evaluated the degree to which pairs of observations fall on the 45° line through the origin. It is a measure of both correlation and agreement.50 Such CCC was calculated only in the large range of GFR (whole population), as all results in subgroups showed poor agreement because of the restriction of the range of GFR. Then, bias (the difference between eGFR and mGFR; systematic error) was calculated. Precision was evaluated by the SD of bias (random error). Biases were compared in 2 steps. First, we considered equations as unbiased when bias was not different from zero (when 95% confidence interval includes zero). Second, we compared absolute bias among biased equations by using the paired t test. Precision of equations were compared using the variance ratio test (F test). We also calculated P30. The difference in P30 between eGFRs was determined using the exact McNemar test.
Because we considered 12 equations, there were 66 [=(12 x 11)/ 2] pairwise comparisons of highly correlated equations, making the strict Bonferroni correction inappropriate, as it is too conservative. Given that our study is observational in nature and that we compare 1 equation with the 11 others, we propose to use P < 0.05/11 — 0.0045 to claim statistical significance. Finally, we also tested the ability of each equation to classify participants with eGFR in the same CKD staging as with mGFR. The Kidney Disease: Improving
Global Outcomes classification was considered for this analysis: stage 1, ≥90 ml/min per 1.73 m2; stage 2, between 60 and 89 ml/min per 1.73 m2; stage 3a, between 45 and 59 ml/min per 1.73 m2; stage 3b, between 30 and 44 ml/min per 1.73 m2; stage 4, between 15 and 29 ml/min per 1.73 m2; and stage 5, <15 ml/min per 1.73 m2. In a final analysis, we compared the distribution (percentiles) of normal GFR in African subjects with a healthy status with the distribution observed in Whites as previously described.18,26
DISCLOSURE
ACKNOWLEDGMENTS
We thank Rodolphe Ahmed, Head of the Medical Center of Kinshasa, and Jacques Sissoko, Director of SAMU-CI, for giving us the framework with the necessary tools to ensure the iohexol procedure in Kinshasa and in Abidjan, respectively. We also thank the local teams who provided the iohexol procedure: Bejos Kifakiou, the nurse Muntsie, and laboratory technicians from Kinshasa medical center as well as Ella Brou with Floriana Abake from Abidjan. We thank the technicians who contributed to iohexol measurement in Liège: Anne-Catherine Bekaert and Eric Brevers. We thank Arnaud Borsu and Jean Barahira from Liège for training in the iohexol plasma clearance procedure.
AUTHOR CONTRIBUTIONS
JBB, EKS, EY, PD, and EC conceived and designed the study. JBB, EY, EC, EKS, AG, DM, AN, JRRM, VMM, FBL, and NMN performed the study. PD, HP, JBB, AN, EC, and EKS analyzed the data. J-MK, EC, PD, JBB, and EY contributed reagents/materials/analysis tools. JBB, EKS, PD, HP, and EY wrote the manuscript. All authors read and approved the final manuscript.
SUPPLEMENTARY MATERIAL
Supplementary Methods.
Table S1. Performance of equations with measured glomerular filtration rate (mGFR) ≥60 ml/min per 1.73 m2.
Table S2. Performance of equations with measured glomerular filtration rate (mGFR) <60 ml/min per 1.73 m2.
Supplementary material is linked to the online version of the paper at www.kidney-international.org.
REFERENCES
1. Mills KT, Xu Y, Zhang W, et al. A systematic analysis of worldwide population-based data on the global burden of chronic kidney disease in 2010. Kidney Int. 2015;88:950-957.
2. Stanifer JW, Jing B, Tolan S, et al. The epidemiology of chronic kidney disease in sub-Saharan Africa: a systematic review and meta-analysis. Lancet Glob Health. 2014;2:e174-e181.
3. Global Burden of Disease Study 2013 Collaborators. Global, regional, and national incidence, prevalence, and years lived with disability for 301 acute and chronic diseases and injuries in 188 countries, 1990-2013: a systematic analysis for the Global Burden of Disease Study 2013. Lancet. 2015;386:743-800.
4. Glassock RJ, Warnock DG, Delanaye P. The global burden of chronic kidney disease: estimates, variability and pitfalls. Nat Rev Nephrol. 2017;13:104-114.
5. KDIGO 2012 Clinical Practice Guideline for the Evaluation and Management of Chronic Kidney Disease. Kidney Int Suppl. 2013;3:1-150.
6. Hostetter TH. Prevention of end-stage renal disease due to type 2 diabetes. W Engl J Med. 2001;345:910-912.
7. Rodriguez-lturbe B, Bellorin-Font E. End-stage renal disease prevention strategies in Latin America. Kidney Int. 2005;68:S30-S36.
8. Brouwers FP, Asselbergs FW, Hillege HL, et al. Long-term effects of fosinopril and pravastatin on cardiovascular events in subjects with microalbuminuria. Am Heart J. 2011 ;161:1171 -1178. 9. Sumaili EK, Krzesinski J-M, Zinga CV, et al. Prevalence of chronic kidney disease in Kinshasa: results of a pilot study from the Democratic Republic of Congo. Nephrol Dial Transplant. 2009;24:117-122.
10. Ashuntantang G, Osafo C, Olowu WA, et al. Outcomes in adults and children with end-stage kidney disease requiring dialysis in sub-Saharan Africa: a systematic review. Lancet Glob Health. 2017;5:e408-e417.
11. Séronie-Vivien S, Delanaye P, Pieroni L, et al. Cystatin C: current position and future prospects. Clin Chem Lab Med. 2008;46:1664-1686.
12. Delanaye P, Cavalier E, Pottel H. Serum creatinine: not so simple! Nephron. 2017;136:302-308.
13. Levey AS, Bosch JP, Lewis JB, et al. Modification of Diet in Renal Disease Study Group. A more accurate method to estimate glomerular filtration rate from serum creatinine: a new prediction equation. Ann Intern Med. 1999;130:461-470.
14. Levey AS, Stevens LA, Schmid CH, et al. A new equation to estimate glomerular filtration rate. Ann Intern Med. 2009;150:604-612.
15. Pottel H, Hoste L, Dubourg L, et al. An estimated glomerular filtration rate equation for the full age spectrum. Nephrol Dial Transplant. 2016;31:798-806.
16. Pottel H, Vrydags N, Mahieu B, et al. Establishing age/sex related serum creatinine reference intervals from hospital laboratory data based on different statistical methods. Clin Chim Acta. 2008;396:49-55.
17. Pottel H, Hoste L, Yayo E, et al. Glomerular filtration rate in healthy living potential kidney donors: a meta-analysis supporting the construction of the Full Age Spectrum equation. Nephron. 2017;135:105-119.
18. Yayo E, Ayé M, Yao C, et al. Measured (and estimated) glomerular filtration rate: reference values in West Africa. Nephrol Dial Transplant. 2018;33:1176-1180.
19. Bukabau JB, Sumaili EK, Cavalier E, et al. Performance of glomerular filtration rate estimation equations in Congolese healthy adults: the inopportunity of the ethnic correction. PLoS One. 2018;13:e0193384.
20. Moodley N, Hariparshad S, Peer F, et al. Evaluation of the CKD-EPI creatinine based glomerular filtration rate estimating equation in Black African and Indian adults in KwaZulu-Natal, South Africa. Clin Biochem. 2018;59:43-49.
21. Delanaye P, Mariat C, Maillard N, et al. Are the creatinine-based equations accurate to estimate glomerular filtration rate in African American populations? Clin J Am Soc Nephrol. 2011;6:906-912.
22. van Deventer HE, George JA, Paiker JE, et al. Estimating glomerular filtration rate in black South Africans by use of the modification of diet in renal disease and Cockcroft-Gault equations. Clin Chem. 2008;54:1197-1202.
23. Inker LA, Schmid CH, Tighiouart H, et al. Estimating glomerular filtration rate from serum creatinine and cystatin C. W Engl J Med. 2012;367:20-29.
24. Grubb A, Horio M, Hansson LO, et al. Generation of a new cystatin C-based estimating equation for glomerular filtration rate by use of 7 assays standardized to the international calibrator. Clin Chem. 2014;60: 974-986.
25. Pottel H, Delanaye P, Schaeffner E, et al. Estimating glomerular filtration rate for the Full Age Spectrum from serum creatinine and cystatin C. Nephrol Dial Transplant. 2017;32:497-507. 26. Pottel H, Delanaye P, Weekers L, et al. Age-dependent reference intervals for estimated and measured glomerular filtration rate. Clin Kidney J. 2017;10:545-551.
27. Perrone RD, Madias NE, Levey AS. Serum creatinine as an index of renal function: new insights into old concepts. Clin Chem. 1992;38:1933-1953.
28. Delanaye P. Nephrology and Clinical Chemistry: The Essential Link. Published 2012. https://doi.org/10.2174/97816080533391120101.
29. Flamant M, Vidal-Petiot E, Metzger M, et al. Performance of GFR estimating equations in African Europeans: basis for a lower race-ethnicity factor than in African Americans. Am J Kidney Dis. 2013;62: 182-184.
30. Anker N, Scherzer R, Peralta C, et al. Racial disparities in creatinine-based kidney function estimates among HIV-infected adults. Ethn Dis. 2016;26: 213-220.
31. Yayo S, Konan J, Aye-Yayo M, et al. Cystatin C, age and gender in healthy African black adults: Ivorian exemple. Int J Biochem Res Rev. 2016;10:1-6.
32. Delanaye P, Schaeffner E, Ebert N, et al. Normal reference values for glomerular filtration rate: what do we really know? Nephrol Dial Transplant. 2012;27:2664-2672.
33. Björk J, Back SE, Ebert N, et al. GFR estimation based on standardized creatinine and cystatin C: a European multicenter analysis in older adults. Clin Chem Lab Med. 2018;56:422-435.
34. Björk J, Grubb A, Gudnason V, et al. Comparison of glomerular filtration rate estimating equations derived from creatinine and cystatin C: validation in the Age, Gene/Environment Susceptibility-Reykjavik elderly cohort. Nephrol Dial Transplant. 2018;33:1380-1388.
35. Schaeffner ES, Ebert N, Delanaye P, et al. Two novel equations to estimate kidney function in persons aged 70 years or older. Ann Intern Med. 2012;157:471-481.
36. Horio M, Imai E, Yasuda Y, et al. GFR estimation using standardized serum cystatin C in Japan. Am J Kidney Dis. 2013;61:197-203.
37. Coresh J, Toto RD, Kirk KA, et al. Creatinine clearance as a measure of GFR in screenees for the African-American Study of Kidney Disease and Hypertension pilot study. Am J Kidney Dis. 1998;32:32-42.
38. Soveri I, Berg UB, Bjôrk J, et al. Measuring GFR: a systematic review. Am J Kidney Dis. 2014;64:411-424.
39. Delanaye P, Melsom T, Ebert N, et al. lohexol plasma clearance for measuring glomerular filtration rate in clinical practice and research: a review. Part 2: Why to measure glomerular filtration rate with iohexol? Clin Kidney J. 2016;9:700-704.
40. Delanaye P, Ebert N, Melsom T, et al. lohexol plasma clearance for measuring glomerular filtration rate in clinical practice and research: a review. Part 1: How to measure glomerular filtration rate with iohexol? Clin Kidney J. 2016;9:682-699.
41. Fan L, Levey AS, Gudnason V, et al. Comparing GFR estimating equations using cystatin C and creatinine in elderly individuals. J Am Soc Nephrol. 2015;26:1982-1989.
42. Luis-Lima S, Escamilla-Cabrera B, Negrin-Mena N, et al. CKD staging with cystatin C or creatinine-based formulas: flipping the coin. Nephrol Dial Transplant. 2019;34:287-294.
43. Nyssen L, Delanaye P, Le Goff C, et al. A simple LC-MS method for the determination of iohexol and iothalamate in serum, using ioversol as an internal standard. Clin Chim Acta. 2016;463:96-102.
44. Cavalier E, Rozet E, Dubois N, et al. Performance of iohexol determination in serum and urine by HPLC: validation, risk and uncertainty assessment. Clin Chim Acta. 2008;396:80-85.
45. Delanaye P, Jouret F, Le Goff C, et al. Concordance between iothalamate and iohexol plasma clearance. Am J Kidney Dis. 2016;68:329-330.
46. Brochner-Mortensen J. A simple method for the determination of glomerular filtration rate. Scand J Clin Lab Invest. 1972;30:271-274.
47. Gehan EA, George SL. Estimation of human body surface area from height and weight. Cancer Chemother Rep. 1970;54:225-235.
48. Piéroni L, Delanaye P, Boutten A, et al. A multicentric evaluation of IDMS-traceable creatinine enzymatic assays. Clin Chim Acta. 2011;412:2070-2075.
49. Bargnoux AS, Piéroni L, Cristol JP, et al. Multicenter evaluation of cystatin C measurement after assay standardization. Clin Chem. 2017;63:833-841.
50. Lin L. A concordance correlation coefficient to evaluate reproducibility. Biometrics. 1989;45:255-268.