Editorial Manager(tm) for Biodegradation Manuscript Draft
Manuscript Number:
Title: Development of an enzymatic assay for the determination of cellulose bioavailability in Municipal Solid Waste
Article Type: Original research article Section/Category:
Keywords: biodegradability; biochemical methane potential assay; cellulosic compounds; enzymatic hydrolysis test; municipal solid waste
Corresponding Author: Mr Christian Rodriguez University of Liège First Author: Christian Rodriguez, MD
Order of Authors: Christian Rodriguez, MD; Serge Hiligsmann, Ir; Marc Ongena, Dr; Robert Charlier, Pr; Philippe Thonart, Pr
TITLE
1 2
Development of an enzymatic assay for the determination of cellulose
3
bioavailability in Municipal Solid Waste
4 5
AUTHORS
6 7
Christian Rodriguez1, Serge Hiligsmann1, Marc Ongena1, Robert Charlier3 &
8
Philippe Thonart1,2
9 10
AFFILIATIONS AND ADDRESSES
11 1
Walloon Center of Industrial Biology, Unit of Microbial Technology, University of 12
Liège, B40, B-4000 Sart-Tilman, Belgium. 13
2
Walloon Center of Industrial Biology, Unit of Bio-Industries, Faculty of Agricultural 14
Sciences of Gembloux, Passage des Déportés, 2, B– 5030 Gembloux, Belgium. 15
3
Department of Géomac, University of Liège, B52/3, B-4000 Sart-Tilman, Belgium. 16 17 COMMUNATING AUTHORS 18 Rodriguez Christian 19
Walloon Center of Industrial Biology, Unit of Microbial Technology, University of 20
Liège, B40, B-4000 Sart-Tilman, Belgium. 21 Phone : ++32.4.366.39.99 22 Fax : ++32.4.366.28.61 23 E-mail : ch.rodriguez@ulg.ac.be 24 * Manuscript
KEYWORDS
25
biodegradation, cellulosic compounds, enzymatic hydrolysis test, biochemical methane 26
potential assay, municipal solid waste 27
28
ABSTRACT
29
As there is a constant need to assess the biodegradation potential of refuse disposed of 30
in landfills, we have developed a method to evaluate the biodegradability of cellulosic 31
compounds (cellulose and hemicellulose) in municipal solid waste. This test is based on 32
the quantification of monosaccharids released after the hydrolysis of solid waste 33
samples with an optimised enzyme preparation containing commercially available 34
cellulases and hemicellulases. We show that the amounts of monosaccharids could be 35
related to the biodegradability of the cellulosic material contained in the samples. This 36
enzymatic cellulose degradation test was assayed on 26 samples originating from two 37
Belgian landfills and collected at different depths. As results correlated well with those 38
obtained with a classical biochemical methane potential assay, this new and rapid test is 39
sufficiently reliable to evaluate cellulose bioavailability in waste samples. 40 41 ABREVIATIONS 42 43 44
INTRODUCTION
44 45
Municipal solid waste (MSW) has been disposed of in landfills for several decades. The 46
organic matter contained in the landfill body is degraded microbiologically generating 47
leachate and biogas that have to be managed for several years. There is thus a constant 48
need to assess the biodegradability of buried MSW in order to evaluate the efficiency of 49
different MSW pretreatments, to predict the duration of the aftercare period or to 50
estimate the remaining potential for landfill gas production. 51
The gas potential can be indirectly determined via stoichiometric and empirical 52
equations from the determination of total organic carbon (TOC), chemical oxygen 53
demand (COD) and other specific parameters such as cellulose and lignin contents 54
(Chandler et al, 1980; Parkin, G.F. & Owen, W.F., 1986; Metcalf & Eddy Inc., 1991; 55
Wang et al., 1997). It is also possible to measure the calorific value (H0) describing the 56
potential amount of energy that will be gained in an incineration process. Alternatively, 57
powerful analytical methods such as NMR and FT-IR spectroscopy, have been 58
developed to monitor the changes in the chemical structure of MSW during composting 59
(Pichler et al., 2000 and Smidt et al., 2002). Some biological tests based on aerobic and 60
anaerobic assays have also been developed to evaluate the biodegradability of MSW 61
and the gas generating potential. At the same time, several workers have estimated the 62
biodegradability of solid waste components by the use of a biochemical methane 63
potential (BMP) assay (Shelton & Tiedje, 1984; Bogner, 1990; Wang et al., 1994; 64
Stinson & Ham, 1995; Eleazer et al., 1997) or by an incubation test (Binner et al., 65
1999). Both assays are based on the measure of methane gas produced by a 66
methanogenic biomass degrading the organic matter in anaerobic conditions. Other tests 67
oxygen consumed or the carbon dioxide produced during a respiration test (Pagga et al., 69
1995; Binner et al., 1999). 70
Whilst different methods offer certain advantages, they also suffer from certain 71
limitations. For instance, chemical parameters such as COD and TOC do not take into 72
account the biodegradable fraction of the organic matter. Spectroscopic methods require 73
sophisticated equipment and are limited to the study of chemical transformations. 74
Anaerobic tests need to be run for several months and respiration tests simulate aerobic 75
conditions that do not prevail into the landfill. 76
The organic fraction of MSW is made up of 30-50 % of cellulosic substances that can 77
undergo biological degradation (Rees, 1980; Barlaz et al., 1989; Eleazer et al., 1997). 78
Cellulose and hemicellulose are therefore the most significant carbon source for 79
methanogenesis in landfills as their degradation contributes to 90% of the total methane 80
produced (Barlaz et al., 1989). However, the biodegradation of cellulosic substrates, 81
such as paper, cardboard, wood and textile, is very slow with a half-life of about 15 82
years (Gendebien et al., 1992) and therefore represents one of the limiting steps of the 83
biological processes occurring in MSW landfills. 84
Our study focused on the first stage of the bioconversion process, i.e. the enzymatic 85
hydrolysis step. In this work, a new test allowing a reliable and rapid evaluation of the 86
enzymatic cellulose bioavailability was developed. This test was based on enzymatic 87
hydrolysis of residual cellulosic material to quantify the biodegradability with 88
subsequent measurement of the quantity of sugars liberated. This enzymatic cellulose 89
degradation test (ECD) has been performed on refuse samples originating from various 90
layers of two different landfills and results were compared with those obtained from 91
BMP assays realised in parallel. 92
MATERIAL AND METHODS 94 95 Sample preparation 96 97
Waste refuses were collected from boreholes (up to 35 m-depth) made in two Belgian 98
landfills L1 and L2. Waste was extracted from a borehole and separated into samples 99
corresponding to 1 m intervals. Large glass pieces, stones, plastics and metal pieces 100
were removed manually while the remaining refuse materials were shredded with a 101
cutting mill to a particle size of ≤ 5 mm and homogenised. Samples containing 3 to 35 102
% cellulosic material were then dried at 105°C for 24 h. 103
104
Chemical analysis
105 106
Cellulosic materials were analysed according to a HPLC method adapted from Pettersen 107
& Schwandt (1991). 300 mg of each MSW sample was hydrolysed with 3 ml of 72 % 108
H2SO4 for 1 h at 30 °C. The samples were then diluted to 2.5 % H2SO4 with distilled 109
water and autoclaved at 120 °C for 1h. Samples were run in triplicate and D (+) Fucose 110
(Fluka, Buchs, Switzerland) was used as standard to correct for further hydrolysis due to 111
the autoclave operation. Samples were analysed by HPLC on an Agilent 1100 series 112
apparatus (Agilent Technologies, Massy, France) equipped with a refractometric 113
detector. Sugars were separated on a C-610-H ion exchange column (300 mm x 7,8 mm, 114
Supelco, Bellefonte, PA.) and quantified using standards. All samples were filtered 115
through 0,2 µm Minisart Syringe filter (Vivascience, Hannover, Germany) prior to 116
analysis. 117
Lignin was determined gravimetrically following extraction with triethylene glycol as 118
described by Edwards, 1972 and after a clean-up procedure of the waste material with a 119
modified neutral detergent fibre (NDF) pre-treatment (Rowland and Roberts, 1999). 120
121
Enzymatic hydrolysis test
122 123
Enzymes 124
125
The enzymes used for the hydrolysis test were all purchased from Novo Nordisk 126
(Bagsvaerd, Denmark). Viscozyme L® and Celluclast 1.5L® are liquid cellulolytic 127
preparations and Celluzyme® is a solid cellulolytic preparation. 128
Celluzyme solutions were prepared by dissolving the commercial product in 0.1 N 129
phosphate buffer at pH 5.5 to which 0.05 % NaNO3 was added to prevent microbial 130
growth. The solutions were then filtered on a GF/C membrane (Whatman, Maidstone, 131
England). Celluclast 1.5L and Viscozyme L were dialysed overnight in the same buffer 132
using nitrocellulose membranes with a cut-off of 10 kD (Sigma-Aldrich, St Louis, 133
USA). One litre of the working enzymes mixture was obtained by adding 500 ml of 134
Celluzyme 20 g/l, 100 ml of dialysed Viscozyme L and 50 ml of dialysed Celluclast 135
1.5L to 350 ml of 0.1 N phosphate buffer-0.05 % NaNO3 at pH 5.5. 136
137
Determination of enzyme activities 138
139
The filter paper assay (FPase activity) was used for cellulase activity determination 140
(Mandels et al., 1976). Endoglucanase (CMCase) and β-glucosidase activities were 141
measured after incubating 200 µl of enzymatic solution with respectively 1500 µl of 142
carboxymethylcellulose 1 % and 1500 µl cellobiose 1 % (adapted from Miller et al., 143
1960 & Gordon and Phillips, 1989), both prepared in the same buffer as mentioned 144
above before being heated for 2 min at 100°C to stop the reaction. Hemicellulase 145
(xylanase) activity was determined by using oats spelt xylan (Sigma-Aldrich, St Louis, 146
USA) following the procedure for filter paper assay. 147
All activities were calculated after 1 hour at pH 5.5 and 40 °C. In all cases, one enzyme 148
unit was defined as the quantity of micromoles of monosaccharid liberated per minute. 149
According to the technical data given for each enzyme, pH and temperature values were 150
fixed so as they cover the range allowing an optimal activity. 151
The cellulase and hemicellulase activities of Celluzyme, Celluclast 1.5L and Viscozyme 152
L were first tested in order to determine the best compromise to use them in a mixture. 153
Celluzyme activities were tested at 5, 10 and 20 g/l. Celluclast and Viscozyme activities 154
were tested after being respectively diluted 20, 50, 100 times for the Celluclast and 10, 155
50, 100 times for the Viscozyme. For each dilution, controls were made to measure the 156
background of sugars already present in Novo Nordisk enzymatic preparations. 157
158
Kinetic of enzymatic hydrolysis 159
160
Cellulase and hemicellulase-mediated hydrolysis were performed either with each 161
enzyme (Celluzyme, Celluclast 1.5L and Viscozyme L) preparation or with a mixture of 162
all three. For hydrolysis, 1000 mg of sample were mixed with 30 ml of an enzymatic 163
solution for 40 hours at 40 °C. The biodegradability of refuse samples is evaluated by 164
the mass of monosaccharids liberated reported to the total mass of sample hydrolysed. 165
Biochemical Methane Potential (BMP) assay
168 169
The BMP assay and the volumes of methane produced were determined following the 170
procedure described by Wang et al. (1994). The concentrations of methane and carbon 171
dioxide in the biogas produced in a BMP assay were measured on a gas chromatograph 172
(Hewlett Packard 5890 series II) equipped with a thermal conductivity detector (TCD) 173
using a GasPro GSC column (30 m x 0,32 mm,) (Alltech, Deerfield, USA) coupled to a 174
CP-Carboplot P7 column (27,5 m x 0,53 mm, Varian, Middelburg, The Netherlands). 175
Helium N45 (Air Liquide, Liège, Belgium) was used as carrier and reference gas. 176
Calibration was performed using gas mixtures standards purchased by Air liquide 177
(Liège, Belgium). Equation 1 (Parkin and Owen, 1986) was used to calculate the 178
theoretical methane potential of monosaccharids when converted to methane. 179
180
CnHaOb + [n – (a/4) – (b/2)]H2O → [(n/2) – (a/8) + (b/4)]CO2 + [(n/2) + (a/8) – (b/4)]CH4 (1)
181 182
RESULTS
183 184
Cellulolytic and hemicellulolytic activities of enzymes used
185 186
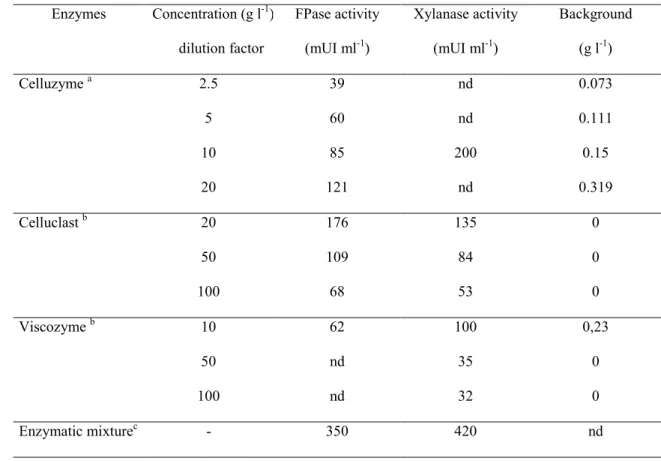
Cellulase (FPase) and xylanase activities of the different commercial products 187
(Celluzyme, Celluclast and Viscozyme) and the content of sugars already present in 188
these preparations (background) were measured at various concentrations (table 1). All 189
three original enzyme solutions had both xylanolytic and cellulolytic activities. These 190
results enabled the determination of the best compromise between a high enzymatic 191
activity and a low background, i.e. a mixture containing Viscozyme and Celluclast 192
diluted 10 and 20 times respectively and 10 g/l of Celluzyme. The resulting activities of 193
the mixture show a FPase activity of 350 mIU/ml and a xylanase activity of 420 194
mIU/ml. The FPase and xylanase activities measured for the enzymatic mixture were 195
close to the sum of each enzyme activity. Moreover, specific CMCase and cellobiase 196
assays made sure that this mixture had endoglucanase (30 mUI/ml) and β-glucosidase 197
(540 mUI/ml) activities. A lack of β-glucosidase activity would lead for example to an 198
accumulation of cellobiose that is known for its feedback effect on cellulases. An 199
efficient β-glucosidase activity is also essential in order to degrade cellulose completely 200
to monomeric sugars that will be quantified by HPLC. 201
202
Enzymatic hydrolysis of cellulosic substrates
203 204
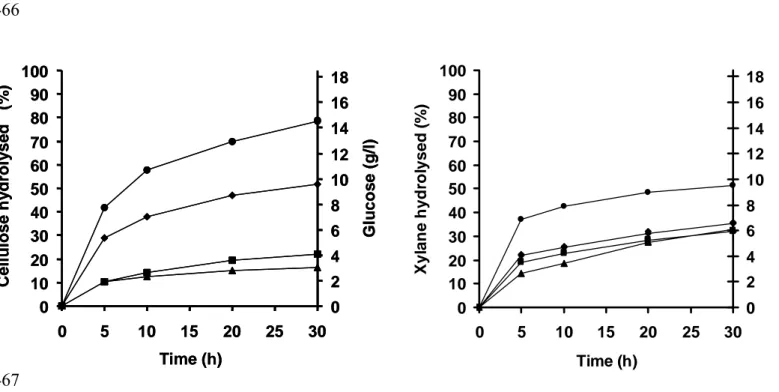
In a next step, enzymatic hydrolysis was performed on cellulosic (Whatman n°1 paper), 205
and hemicellulosic (xylan from oat spelts) substrates in order to investigate the time 206
needed to reach the end of the kinetic phase and to determine the concentrations of 207
glucose and xylose associated with the decrease of the enzymatic activity. The 208
hydrolysis associated with the degradation of 500 mg of these substrates was followed 209
for 30 hours. Each enzyme and the enzyme mixture was tested in triplicate (figure 1). 210
For both substrates, the rate of hydrolysis was higher during the first five hours of 211
incubation and decreased after 20 hours (beginning of the stationary phase). With 212
respectively 80 and 50 % of cellulose and xylan hydrolysed after 30 hours, the mixture 213
of enzymes increased significantly the hydrolysis yield in comparison with each enzyme 214
tested alone. This degradation of cellulose and xylane was associated with an 215
accumulation of glucose and xylose that reached respectively 15 and 10 g/l in the 216
obtained when other cellulosic substrates are degraded without being interpreted as a 218
limiting enzymatic activity if the concentrations reached are lower. 219
Enzymatic hydrolysis was also performed on spruce wood (figure 2), containing 51 % 220
cellulosic materials and 29 % of lignin. Wood was tested because their cellulosic 221
compounds are closely linked to lignin, limiting therefore the bioavailability of these 222
polysaccharids. Results showed a lower percentage of hydrolysis compared to those 223
obtained with substrates such as pure cellulose and xylan (figure 1). The level of 224
degradation induced by the mixture of cellulases was similar to that observed with 225
celluclast as only 0.6 g/l of monosaccharids was released into the medium. This 226
relatively low yield of hydrolysis led to the question of whether enzyme inhibition or 227
bioavailability was limiting cellulose/hemicellulose conversion to glucose/xylose. To 228
address this, a cellulose spike (100 mg of Whatman n°1 filter paper) was added to the 229
enzymatic medium for 14 hours after 30 hours of incubation. The medium spike 230
recovery was 78 % of the glucose expected from filter paper addition. These data 231
suggest that there was not an environmental condition within the enzymatic cellulose 232
degradation (ECD) test that limited cellulose conversion to glucose, but rather the 233
bioavailability of the cellulose. 234
235
Comparison of ECD and BMP assays on MSW samples
236 237
The BMP assay, which involves an anaerobic process close to the one taking place in a 238
landfill, was compared to the ECD test. Both tests were performed on waste samples 239
collected from various layers of two different MSW landfills (L1 and L2). Therefore, 240
the selected samples had distinct chemical compositions (from 3 to 35 % of cellulosic 241
material) and different disposal times (from several months to more than 20 years). The 242
monosaccharids or methane respectively released were reported to the mass of the 243
sample in order to describe the potential of biodegradation of cellulosic substances in 244
MSW samples. 245
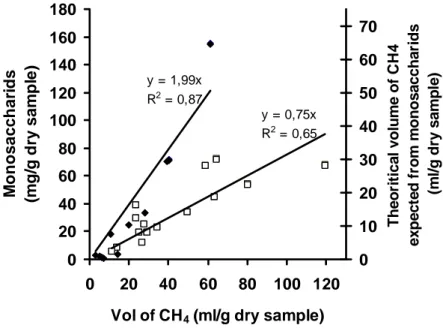
The Figure 3 shows the correlation between the total specific amount of sugars liberated 246
after 48 hours of enzymatic hydrolysis and the total specific volume of methane 247
produced after 100 days of anaerobic degradation. The two measures appear to be 248
significantly correlated (calculated with a Student test, P = 0.05) both for samples from 249
L1 (r2 = 0.87) and L2 (r2 = 0.65). However, the regression lines have different slopes 250
although there is still a globally significant correlation (r2 = 0.46) when all the 26 251
samples from L1 and L2 are considered together. On the other hand, the volumes of 252
methane experimentally measured for samples L1 are close to those theoretically 253
produced if all the sugars released during the ECD test were converted to methane 254
(figure 3). This is not the case for samples L2 where experimental methane potential is 255
higher than the theoretical methane potential of the sugars released by the ECD test 256
suggesting that MSW samples were more completely degraded by the anaerobic 257
biomass. 258
259
Assessment of the enzymatic hydrolysis
260 261
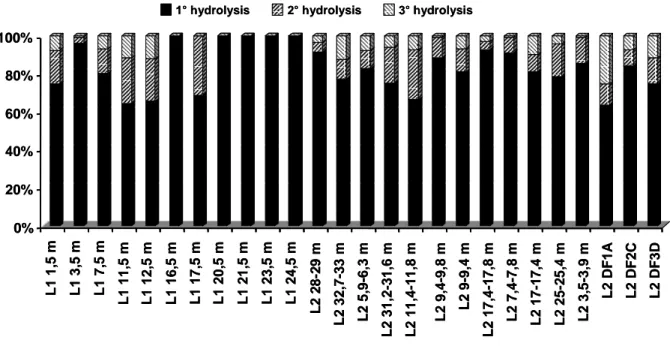
Further experiments have been carried out to validate the enzymatic test and particularly 262
to achieve a complete hydrolysis of the cellulose bioavailable The samples submitted to 263
the enzymatic hydrolysis were dried at 50 °C to constant weight and then submitted to a 264
second, and in the same way, to a third hydrolysis. The figure 4 shows the average 265
proportion of each hydrolysis compared to the total percentage of cellulose hydrolysed. 266
after three hydrolysis. The second and the third hydrolysis degraded respectively 11 and 268
6 %. In the case of the samples coming from L1, the correlation coefficient between the 269
total specific amount of monosaccharids liberated by the enzymatic test and the total 270
specific volume of methane produced by the BMP test rises from 0.87 to 0.91 after the 271
second hydrolysis and to 0.92 after the third one. However, this correlation coefficient 272
decreases from 0.69 to 0.64 and to 0.47 for samples coming from L2. 273
Anyway, the low concentrations measured after the first hydrolysis in most of the 274
samples suggest that one hydrolysis is sufficient enough to calibrate the test with a BMP 275 assay. 276 277 DISCUSSION 278 279
The results presented in this paper show that the ECD test describes as well as the 280
anaerobic BMP assay the degradation potential of MSW samples collected at various 281
depths in two different landfills. Other works also compared the results of anaerobic 282
tests to other assays based on respiration activity or volatile solids measurements (VS), 283
Binner et al. (1999) showed a good relationship between results from a 7 days 284
respiration assay and an anaerobic assay running over 90 days when both were applied 285
to 23 MSW samples coming from different mechanical biological pre-treatment plants. 286
They also showed that the respiration activity was related to the mass lost by the 287
samples after ignition at 1000°C (Ignition Loss) but the correlation was only significant 288
for the samples coming from the same treatment plant. By comparing different stability 289
criteria for mechanical biological pretreated waste, Cossu et al. (2001) also showed a 290
relationship between a respiration activity and an anaerobic fermentation test but only 6 291
samples were considered in this case. 292
However, the biodegradation potential evaluated by respiration assays or by some 293
chemical analysis (TOC and VS) do not take into account the non biodegradability of 294
some organic compounds under the anaerobic conditions taking place in landfills. For 295
example, lignin that is intimately associated with cellulose in woody tissues and plants, 296
is only slowly degradable under anaerobic conditions (Young and Frazer, 1987; 297
Colberg, 1988). Therefore, its resistance is thought to delay strongly the biodegradation 298
of the cellulosic material (Crawford, 1981) due to a lack of cellulose availability. On the 299
other hand, the main disadvantage of anaerobic tests, such as a BMP assay, is that they 300
must be carried out over a very long period (more than 100 days). In this context, the 301
ECD test we report here is more appropriate as it assesses the fraction of cellulose that 302
is readily available without changes of the lignin properties. Results from ECD test and 303
BMP assay applied to 26 samples from two Belgian landfills showed a significant 304
correlation. However, the regression slopes between ECD and BMP results were quite 305
different in the two considered landfills. The lower slope of the regression line L2 306
(figure 3) implies that MSW samples were more completely degraded by the anaerobic 307
biomass, suggesting that cellulose was more available for the anaerobic microflora than 308
for the enzymatic mixture even if this mixture was active enough to degrade all the 309
cellulose contained in the samples. The presence of other carbon sources (proteins, 310
lipids) as substrates for the anaerobic microflora in the BMP assay or as a barrier 311
limiting cellulose bioavailability for enzymes in the ECD test might also explain the 312
variations observed between L1 and L2 samples. However, protein and lipids respective 313
contents are usually not higher than 5-6 % in fresh MSW (Rees, 1980; Barlaz et al., 314
1989) and 5-8 % of the TOC in old waste Bäumler et al. (2001). Moreover, Gendebien 315
et al. (1992) considered that food waste, that is mainly composed of proteins and lipids, 316
Nevertheless, our results show that the ECD test combined with the BMP assay could 318
highlight a different trend between samples coming from two different landfills. Such a 319
differential bioconversion behaviour of cellulosic substances to methane reinforces the 320
need for parameters evaluating the biodegradation potential instead of, or in 321
combination with, other chemical measurements like TOC, VS, COD... 322
In fact, the study of MSW with combined tests gives a good idea of the methane 323
potential still expected from the mass of enzymatically degraded (hemi)cellulose. 324
Moreover, limit values can be recommended, as suggested by Binner et al. (1999), in 325
order to define MSW with a low biodegradation potential. For example, assuming that 326
gas generating potential of fresh MSW ranges between 100 and 200 Nl/kg MSW 327
(Barlaz et al., 1990; Pacey, 1990; Gendebien et al., 1992, Binner et al., 1999), a limit 328
value of 10 % of this potential (10-20 Nl/kg) could be considered as acceptable to 329
classify waste samples as sample with a low methane potential. The correlating values 330
with the ECD when the 26 samples of L1 and L2 are considered together ranges 331
between 10 and 20 g of monosaccharids / kg of waste. 332
333
CONCLUSIONS
334 335
In this paper, a new and rapid enzymatic test using a mixture of 336
cellulases/hemicellulases has been compared to a classic 100 days-BMP assay in order 337
to assess the cellulose degradation of MSW. Both methods have been performed on two 338
sets of MSW samples under suitable conditions for biodegradation i.e. no limiting 339
moisture content, optimal pH and temperature. The results show a good correlation 340
between the two assays. As it allows a large set of trials with reduced incubation time, 341
this enzymatic test is a promising tool to study the biodegradation potential of cellulosic 342
material in MSW samples. Moreover, it simulates the microbial degradation of cellulose 343
in the presence of the lignin barrier using high activities of (hemi)cellulolytic enzymes. 344
It may thus assess rapidly the methane potential of waste refuses and may point out 345
different behaviours of bioconversion when combined with methanisation tests. 346
347
Acknowledgement
348 349
The study was financed by funds Actions de Recherche Concertées from the Direction 350
générale de l'Enseignement non obligatoire et de la Recherche scientifique- Direction 351
de la Recherche scientifique - French talking community of Belgium. 352
353
References
354 355
Barlaz MA, Ham RK & DM Schaefer DM (1989) Mass balance analysis of 356
anaerobically decomposed refuse. J. Env. Eng. 115 (6): 1088-1089 357
Barlaz MA, Ham RK & Schaefer DM (1990) Methane production from municipal 358
refuse: a review of enhancement techniques and microbial dynamics. Crit. Rev. 359
Environ. Control 19(6): 557-584 360
Bäumler R, Lindel H, Knicker H & Kögel-Knabner I (2001) Sability of organic matter 361
in an old landfill site – a case study in Northern Bavaria (Germany). In: T.H. 362
Christensen, R. Cossu and R. Stegmann (Ed) Proceedings Sardinia 01, Eighth 363
International Waste Management and Landfill Symposium, Santa Margherita di Pula, 364
Cagliari, 1-5 Oct. 2001, Vol 4 (457-464), Cisa, EuroWaste Srl, Padova 365
Binner E & Zach A (1999) Biological reactivity of residual wastes and dependence on 366
Bogner JE (1990) Controlled study of Landfill biodegradation rates using modified 368
BMP assays. Waste Manage. Res. 8: 329-352 369
Chandler JA, Jewell WJ, Gossett JM, Van Soest PJ & Robertson JB (1980) Predincting 370
Methane Fermentation Biodegradability. Biotechnol. Bioeng. Symp. 10: 93-107 371
Colberg PJ (1988) Anaerobic microbial degradation of cellulose, lignin, oligolignols 372
and nonaromatic lignin derivatives. In : Zehnder AJB (Ed) Biology of Anaerobic 373
Microorganisms (pp 333-372). Wiley-Liss, New-York 374
Cossu R, Raga R & Vascellari V (2001) Comparison of different stability criteria for 375
MBP waste in view of landfilling. In: T.H. Christensen, R. Cossu and R. Stegmann (Ed) 376
Proceedings Sardinia 99, Seventh International Waste Management and Landfill 377
Symposium, Santa Margherita di Pula, Cagliari, 4-8 Oct. 1999, Vol 1 (473-478), Cisa, 378
EuroWaste Srl, Padova 379
Crawford R L (1981) Lignin Biodegradation and Transformation. Wiley-Interscience, 380
New-York 381
Edwards CS (1973) Determination of lignin and cellulose in forages by extraction with 382
triethylene glycol. J. Sci. Food Agr 24: 381-388 383
Eleazer W E, Odle WS, Wang YS & MA Barlaz (1997) Biodegradability of municipal 384
solid waste components in laboratory-scale landfills. Environ. Sci. Technol. 31: 911-385
917 386
Gendebien A, Pauwels M, Constant M, Ledrut-Damanet M-J, Nyns EJ, Willumsen H-C, 387
Butson J, Fabry R & Ferrero G-L (1992) The process of methanogenesis in landfills. In: 388
Landfill gas. From environment to energy (pp121-140). Commission of the European 389
Communities, Luxemburg 390
Gordon, GLR & Phillips MW (1989) Degradation and utilisation of cellulose and straw 391
by three different anaerobic fungi from the ovine rumen. Appl. Environ. Microb. 55 (7): 392
1703-1710 393
Mandels M, Andreotti, R & Roche C (1976) Measurement of saccharifying cellulase. 394
Biotechnol. Bioeng. Symp. 5: 21-33 395
Metcalf & Eddy Inc. (1991). Wastewater Engineering: Treatment, Disposal and Reuse, 396
3rd Edition, McGraw Hill Inc, New York 397
Miller GL, Blum RWE, Glennon WE & Burton AL (1960) Measurement of 398
carboxylmethyl cellulase activity. Anal. Biochem. 1: 127-132 399
Pagga U, Beimborn DB, Boelens J & De Wilde B (1995) Determination of the aerobic 400
biodegradability of polymeric material in a laboratory controlled composting test. 401
Chemosphere. 31(n°11/12): 4475-4487 402
Pacey J G (1990) Sanitary landfilling: process, technology and environmental impact. 403
Academic press, London 404
Parkin GF and Owen WF (1986) Fundamentals of anaerobic digestion of wastewater 405
sludges. J. Environ. Eng. Div. ASCE 112 (EE5): 867-920 406
Pettersen, RC and Schwandt, VH (1991) Wood sugar analysis by anion 407
chromatography. J. Wood Chem. Technol. 11: 495-501 408
Pichler M, Knicker H & Kögel-Knabner I. Changes in the chemical structure of 409
municipal solid waste during composting as studied by solid-state dipolar dephasing and 410
PSRE 13C NMR and solid-state 15N NMR spectroscopy. Environ. Sci. Technol. 34 (18): 411
4034-4038 412
Rees, JF (1980). The fate of Carbon Compounds in the Landfill Disposal of organic 413
Matter. J. Chem. Technol. Biotechnol. 30: 161-175 414
Rowland AP & JD Roberts (1999) Evaluation of lignin and lignin-nitrogen fractionation 415
following alternative detergent fiber pre-treatment methods. Commun. Soil Sci. Plant 416
Anal. 30 (1&2): 279-292 417
Shelton DR & Tiedje JM (1984) General method for determining anaerobic 418
biodegradation potential. Appl. Environ. Microb. 47 (4): 850-857 419
Smidt E, Lechner P, Schwanninger M, Haberhauer G and Gerzabek MH (2002). 420
Characterization of waste organic matter by FT-IR spectroscopy – Application in waste 421
science. Appl. Spectrosc. 56: 1170-1175 422
Stinson, JA & Ham, RK (1995) Effect of lignin on the anaerobic decomposition of 423
cellulose as determined through the use of a biochemical methane potential method. 424
Environ. Sci. Technol. 29, 2305-2310 425
Wang YS, Byrd CS & Barlaz MA (1994) Anaerobic biodegradability of cellulose and 426
hemicellulose in excavated refuse samples using biochemical methane assay. Journal of 427
Industrial Microbiology. 13, 147-153 428
Wang YS, Odle WS, William E, Barlal MA (1997) Methane potential of food waste and 429
anaerobic toxicity of leachate produced during food waste decomposition. Waste 430
Manage. Res. 15, 149-167 431
Young LY & Frazer AC (1987). The fate of lignin and lignin-derived compounds in 432
anaerobic environments. Geomicrobiol. j. 5: 261-293 433
Figure Legend
434 435
Fig.1 Cellulose or hemicellulose hydrolysed when Whatman n°1 paper (A) and Xylan
436
from oats spelt (B) are degraded for 30 h with Viscozyme (10 fold diluted) (▲), with
437
Celluzyme (10 g/l) (■), with Celluclast (20 fold diluted) (♦) and with the enzymatic 438
mixture (●). Concentrations of glucose (A) or xylose (B) released during the 439
degradation of Whatman n°1 paper and Xylan with the enzymatic mixture. 440
441
Fig.2 Cellulosic substances (cellulose and hemicellulose) hydrolysed when spruce wood
442
are degraded for 30 h with Viscozyme (10 fold diluted) (▲), with Celluzyme (10 g/l)
443
(■), with Celluclast (20 fold diluted) (♦) and with the enzymatic mixture(●). 444
Concentrations of monosaccharids released during the degradation of the spruce wood 445
with the enzymatic mixture. 446
447
Fig.3 Relationship between the total specific amount of monosaccharids (and the
448
corresponding methane potential) liberated by the enzymatic test after 48 h and the total 449
specific volume of methane produced by a 100 days-BMP test. The 26 samples tested 450
are originating from different layers of two different Belgian landfills called L1 (♦) and 451
L2 (□). 452
453
Fig. 4 Proportion of the total percentage of cellulose and hemicellulose hydrolysed after
454
each of the 3 hydrolysis. The 26 samples tested are originating from different layers of 455
landfills L1 and L2. 456
Table 1 FPase and xylanase activities of Celluzyme, Viscozyme, Celluclast and
457
enzymatic mixture measured at different concentrationsa or dilutionsb of the 458
commercial products. Background of sugars measured in the different 459 enzymatic preparations 460 Enzymes Concentration (g l-1) dilution factor FPase activity (mUI ml-1) Xylanase activity (mUI ml-1) Background (g l-1) Celluzyme a 2.5 39 nd 0.073 5 60 nd 0.111 10 85 200 0.15 20 121 nd 0.319 Celluclast b 20 176 135 0 50 109 84 0 100 68 53 0 Viscozyme b 10 62 100 0,23 50 nd 35 0 100 nd 32 0 Enzymatic mixturec - 350 420 nd nd: non determined 461
c For 1 litre : 500 ml of Celluzyme 20 g/l, 100 ml of dialysed Viscozyme L and 50 ml of 462
dialysed Celluclast 1.5 L and 350 ml of 0.1 N phosphate buffer-0,05 % NaN3 at pH 5.5. 463
464 465
Figure 1 465 466 467 468 0 10 20 30 40 50 60 70 80 90 100 0 5 10 15 20 25 30 Time (h) Cell ul ose h y d rol y se d (% ) 0 2 4 6 8 10 12 14 16 18 Gl uco s e (g/ l) 0 10 20 30 40 50 60 70 80 90 100 0 5 10 15 20 25 30 Time (h) Cell ul ose h y d rol y se d (% ) 0 2 4 6 8 10 12 14 16 18 Gl uco s e (g/ l) 0 10 20 30 40 50 60 70 80 90 100 0 5 10 15 20 25 30 Time (h) X y la n e h y d ro lysed ( % ) 0 2 4 6 8 10 12 14 16 18 xyl ose ( g /l )
Figure 2 468 469 470 471 472 473 474 475 0 1 2 3 4 5 6 7 8 9 10 0 5 10 15 20 25 30 Time (h) Total cel lu lo se and hem icell u lo se h y dro ly s e d (% ) 0 0,1 0,2 0,3 0,4 0,5 0,6 0,7 0,8 0,9 G luc o s e a nd xy lo s e ( g /l ) 0 1 2 3 4 5 6 7 8 9 10 0 5 10 15 20 25 30 Time (h) Total cel lu lo se and hem icell u lo se h y dro ly s e d (% ) 0 0,1 0,2 0,3 0,4 0,5 0,6 0,7 0,8 0,9 G luc o s e a nd xy lo s e ( g /l )
Figure 3 475 476 477 478 479 480 y = 1,99x R2 = 0,87 y = 0,75x R2 = 0,65 0 20 40 60 80 100 120 140 160 180 0 20 40 60 80 100 120
Vol of CH4 (ml/g dry sample)
M onos ac c h ar id s (m g/ g dr y s a m pl e) 0 10 20 30 40 50 60 70 T h eor it ica l vo lume o f C H 4 ex p ect e d f rom m o no s acchar id s (m l/ g d ry sampl e)
Figure 4 480 481 482 483 484 485 100% 0% 20% 40% 60% 80% L1 1, 5 m L1 3, 5 m L1 7, 5 m L1 11, 5 m L1 12, 5 m L1 16, 5 m L1 17, 5 m L1 20, 5 m L1 21, 5 m L1 23, 5 m L1 24, 5 m L2 28 -2 9 m L2 32, 7-3 3 m L2 5, 9-6, 3 m L2 31, 2-3 1 ,6 m L2 11, 4-1 1 ,8 m L2 9, 4-9, 8 m L2 9-9, 4 m L2 17, 4-1 7 ,8 m L2 7, 4-7, 8 m L2 17-1 7 ,4 m L2 25-2 5 ,4 m L2 3, 5-3, 9 m L2 D F 1 A L2 D F 2C L2 D F 3D
1° hydrolysis 2° hydrolysis 3° hydrolysis
100% 0% 20% 40% 60% 80% L1 1, 5 m L1 3, 5 m L1 7, 5 m L1 11, 5 m L1 12, 5 m L1 16, 5 m L1 17, 5 m L1 20, 5 m L1 21, 5 m L1 23, 5 m L1 24, 5 m L2 28 -2 9 m L2 32, 7-3 3 m L2 5, 9-6, 3 m L2 31, 2-3 1 ,6 m L2 11, 4-1 1 ,8 m L2 9, 4-9, 8 m L2 9-9, 4 m L2 17, 4-1 7 ,8 m L2 7, 4-7, 8 m L2 17-1 7 ,4 m L2 25-2 5 ,4 m L2 3, 5-3, 9 m L2 D F 1 A L2 D F 2C L2 D F 3D