Effective stress method to be used in beam finite elements to
take local instabilities into account
JEAN-MARC FRANSSEN, BAPTISTE COWEZ and THOMAS GERNAY ArgencoDepartment
University of Liège
Chemin des Chevreuils, 11 4000 Liège
Belgium
[email protected], [email protected], [email protected] ABSTRACT
In the fire situation, Bernoulli beam finite elements are the workhorse used in numerical calculation model for simulating the behaviour of the structure. Such finite elements treat all sections as class 1 (stocky) sections whatever the slenderness of the plates that make the section, allowing the development of a full plastic stress distribution in the section which leads to complete plastic redistribution along the members in the structure. This type of element is thus not adapted for modeling structures that contain slender sections of class 2, 3 or 4. This document presents a new approach to take into account local instabilities in slender sections using beam finite elements. The new approach is based on an effective constitutive law of steel. The effective law is not symmetrical with respect to tension and compression because, in tension, the stress-strain relationship is not modified whereas, in compression, the stress-strain relationship is modified. KEYWORDS:structures in fire, local buckling, bernoulli, beam finite elements, slender cross-section, numerical modeling
NOMENCLATURE LISTING
a Plate length (m) ksl Slenderness reduction factor
b Plate width (m) N Total reaction in the plate (N) d Plate in-plane shortening (m) Greek
beff Plate effective width (m)
λ
θ Temperature dependent slendernessD Damage scalar
λ θ
E( )
Eulerian slenderness E0 Initial stiffness (MPa) εeff Proposed effective strainEunloading Unloading stiffness (MPa) εpl Plastic deformation
fy Yield strength (MPa) σb,eff Effective width stress (MPa)
fy,eff Effective yield strength (MPa) σeff Proposed effective law (MPa)
fp,eff Proportionality limit (MPa)
INTRODUCTION
The use of slender steel sections has increased in recent years because they provide excellent strength to weight ratio; this trend has also been favored by the development of higher steel grades. A major issue with slender sections is local buckling that may occur in compression zones of the elements made of slender plates, in the flange under compression for elements in bending, in both flanges and also in the web for elements in compression. In the fire situation, Bernoulli beam finite elements are the workhorse used for simulating the behavior of the structure. The problem is that such finite elements treat all sections as class 1 (stocky) sections whatever the slenderness of the plates that make the section, allowing the development of a full plastic stress distribution in the section which leads to complete plastic redistribution in the structure. This type of element is thus not adapted for modeling structures that contain slender sections of class 2, 3 or 4.
1. EXISTING SOLUTIONS
To take local instabilities into account in a precise manner, the designer is left with no other choice than to use shell finite elements that can represent the local buckling phenomena. These elements are yet very expensive already for modeling single construction members, let alone for modeling complete structures.
It is thus desirable to use cheaper beam elements modified to take local buckling into account. The approach that is most often used is based on the concept of effective width [1,2]; the width of the plates is reduced in such a way that the plastic capacity of the reduced section is equal to the capacity of the slender plate which exhibits local buckling. This approach has first been proposed and has been used for analytical analyses. Yet, because the effective width depends on the stress level which in turn depends on the effective width, this procedure is iterative, which is already a serious complication when it comes to analyzing the situation of a single member under a defined loading.
If this approach has to be applied in beam finite elements used in transient or step
complete structures, the additional level of iteration on the effective width leads to a severe modification, not only in the formulation of the finite element, but also in the fo
code. Moreover, convergence problems may occur because it is not possible to derive the real tangent stiffness matrix of the elements.
One possible approximation is to assume that the stress has reached the yiel
zones and to perform the complete simulation with the minimum values of the effective width, thus eliminating the additional iteration level and requiring no modification of the code; only the definition of the sections is modified by the user. This procedure yet leads to incorrect value of the stiffness from the very early stage of initial loading as well as during all the simulation because excessive reduction of width has been imposed. This is all the more true in a structur
difficult to determine a priori where the compression and tension zones will exist in the structure. Moreover, different zones may change from tension to compression and vice versa, possibly seve
during the course of the simulation as thermal strains develop
relieved by plasticity or, by the large displacements which generally develop at failure. mentioned that some authors proposed a strain-based approach to determine the effective width [3]. Other studies have been carried on modified beam finite elements
displacement field on a classical beam element [4] but it also leads to a severe element formulation.
2. NEW PROPOSAL
It is here proposed to take local instabilities into account in beam type elements constitutive law of steel. The effective law has to be derived with the same objective
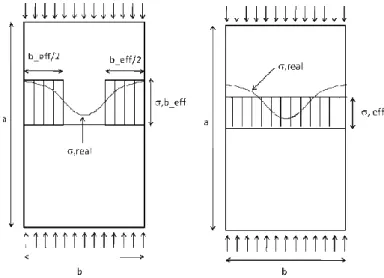
the plastic capacity obtained with the effective law in the full section is equal to the capacity of the slender plate with the real material under local buckling. Figure 1 shows the difference between the effective width approach and the new proposal of an effective stress.
Fig 1. Difference between effective width method (left)
It is thus desirable to use cheaper beam elements modified to take local buckling into account. The approach that is most often used is based on the concept of effective width [1,2]; the width of the plates is d in such a way that the plastic capacity of the reduced section is equal to the capacity of the slender local buckling. This approach has first been proposed and has been used for analytical depends on the stress level which in turn depends on the effective width, this procedure is iterative, which is already a serious complication when it comes to analyzing the situation of a single member under a defined loading.
pplied in beam finite elements used in transient or step-by-step analyses of complete structures, the additional level of iteration on the effective width leads to a severe modification, not only in the formulation of the finite element, but also in the formulation of the solution strategies of the code. Moreover, convergence problems may occur because it is not possible to derive the real tangent
One possible approximation is to assume that the stress has reached the yield strength in all compression zones and to perform the complete simulation with the minimum values of the effective width, thus eliminating the additional iteration level and requiring no modification of the code; only the definition of ified by the user. This procedure yet leads to incorrect value of the stiffness from the very early stage of initial loading as well as during all the simulation because excessive reduction of width has been imposed. This is all the more true in a structure subjected to fire because thermal strains make it where the compression and tension zones will exist in the structure. Moreover, different zones may change from tension to compression and vice versa, possibly several times, develop. In later stage during the fire, restrain may be relieved by plasticity or, by the large displacements which generally develop at failure. It has to be
based approach to determine the effective width [3].
Other studies have been carried on modified beam finite elements by adding a complementary local displacement field on a classical beam element [4] but it also leads to a severe modification of the finite
into account in beam type elements by means of an effective constitutive law of steel. The effective law has to be derived with the same objective as the effective width: the plastic capacity obtained with the effective law in the full section is equal to the capacity of the slender plate with the real material under local buckling. Figure 1 shows the difference between the effective width
Because local buckling develops only in compression, the
only in compression and remains unchanged in tension, which leads to a non to compression-tension.
The tangent modulus at the origin of the law is not modified (which comes from t
compression stresses do not produce local instabilities), but the development of local instabilities is reflected by a reduction of the limit of proportionality,
characteristic strain corresponding to the beginning of the relationship.
The effective stress-strain relationship in compression conditions of the plates, either supported on four sides
flanges), and possibly also on the steel grade, but these conditions are known at the time of creating the model and can easily be entered by the user as new material properties
the temperature, but this is already the case for the real law considered up to accommodated by the numerical code.
The method used in this research to determine the effective stress
simulation of isolated plates modeled in SAFIR [5] with shell elements, simply supported on three or four sides and subjected to progressive imposed shortening in one direction. The simulations are performed first at ambient temperature and then at various elevated temperatures. From each simulation of a plate, the effective strain at any time is considered as the shortening of the plate divided by initial length of the plate, see Eq. (1), whereas the effective stress is considered as the r
divided by the sectional area of the plate, see Eq. (2).
If the obtained curves would be very different in shape from these currently used for the virgin material, new effective stress-strain relationship should be developed. It has been decided here to keep the relationship proposed by the Eurocode.
From the effective stress-effective strain curve obtained each effective proportionality limit and the effective strain c
determined, depending on the relevant conditions of the plate
Fig.2 Method used in this research to evaluate the stress
a d eff = ε bt N eff = σ
Because local buckling develops only in compression, the stress-strain relationship needs to be modified in tension, which leads to a non-symmetrical law with respect
The tangent modulus at the origin of the law is not modified (which comes from the fact that low compression stresses do not produce local instabilities), but the development of local instabilities is of the limit of proportionality, of the effective yield strength and of the g to the beginning of the horizontal plateau in the stress-strain
strain relationship in compression depends on the slenderness and on the boundary conditions of the plates, either supported on four sides (as in a web) or supported on three sides (as in half , and possibly also on the steel grade, but these conditions are known at the time of creating the model and can easily be entered by the user as new material properties. The material law also depends on case for the real law considered up to now and this can be easily
The method used in this research to determine the effective stress-strain relationship is based on the simulation of isolated plates modeled in SAFIR [5] with shell elements, simply supported on three or four sides and subjected to progressive imposed shortening in one direction. The simulations are performed first d then at various elevated temperatures. From each simulation of a plate, the effective strain at any time is considered as the shortening of the plate divided by initial length of the plate, see Eq. (1), whereas the effective stress is considered as the reaction force applied on the edge of the plate
If the obtained curves would be very different in shape from these currently used for the virgin material, uld be developed. It has been decided here to keep the
obtained each plate, the effective yield strength, the and the effective strain corresponding to the beginning of the plateau were nding on the relevant conditions of the plate.
search to evaluate the stress-strain diagram of a single plate
(1)
The tables that give the values of the parameters of the effective law (limit of proportionality, effective yield strength and characteristic strains) at various values of the temperature and slenderness are established for both boundary conditions. It has to be noticed that a simple adaptation of the subroutine at the material level can be made and easily introduced in any computer code. The user only has to introduce a different material model for the web and for the flanges, to give the slenderness of each plate as a new material property, and the software automatically takes care of the temperature, of the stress level and of the direction of the stress, tension or compression in each integration point. This procedure can be used also for analyses of structures at room temperature. It has to be underlined that, compared to existing methods, there is no stepwise variation of the behavior at the interface between the four classes; in fact, there is no need to define the class because the adaptation of the material model is a continuous function of the slenderness. The limit of this approach is that it cannot capture local buckling produced by shear forces, but this is also the case for the effective width approach.
3. PARAMETRICAL STUDY ON PLATES
The main difficulty of this research resided in the determination of the parameters that influence the effective stress-strain diagram and the selection of the appropriate values for these parameters. Further information about the principal parameters are described in [6].
The dimensions of the studied plates were based on the base of the elastic theory of plates [7,8]. The minimal critical stress for a plate simply supported on four sides and subjected to uniaxial compression appearsfor an integer value of the length-to-width ratio of the plate. If the plate is infinitely long, the plate buckles into an integer number of square cells of dimensionsb×b.
According to this, square plates simply supported on four sides were used in this research to determine the effective stress-strain diagram of webs.
From similar considerations, rectangular plates simply supported on three edges with a length-to-width ratioof 1/2are used to determine the effective stress-strain diagram of flanges.
A wide range of plates has been modeled to see the influence of the amplitude of the initial geometric imperfection. It has beenobserved that the initial imperfection has a major influence on the effective yield strength but it does not influence as much the effective limit of proportionality and the stiffness. At this time, the amplitude of the initial imperfection has been taken as recommended byEurocode 3 part 1-5 [9] (min (a/200; b/200) for webs, b/50 for flanges).
Is has also been shown that the slenderness ratio b /thas almost no influence on the stiffness of the plate. With an increasing thickness, an increase of the proportionality limit and of the yield strength is observed From the preliminary analyses, it was decided that the effective stiffness of the new material remains the same as the real stiffness of steel. The effective yield strength and limit of proportionality are determined for different slenderness of the plate but the aspect ratio of the plates remains constant (one value for plates supported on 3 sides and one value for plates supported on 4 sides).
4. PROPOSED MODEL
The proposed effective law of steel is presented in this section. The first part specifies the approach used to take into account the reduction of the yield strength, the proportionality limit and the characteristic deformation in the compression zone of the strain diagram. The second part describes the full stress-strain relationship in case of unloading.
4.1 Slenderness reduction factor
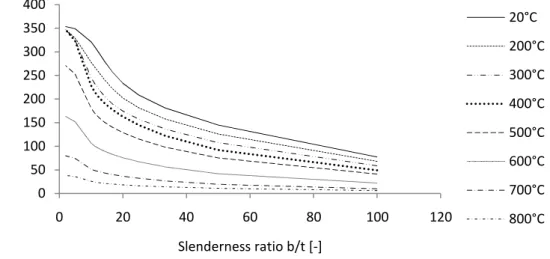
The influence of the slenderness on the yield strength for different temperatures for single plates simply supported on four sides submitted to compression in one directionis represented in Figure 3 with steps of 100°C. A steel grade of 355 MPa was used for these numerical simulations. The yield strength decreases with an increasing slenderness.
Fig.3. Effective yield strength measured for plates for different temperatures in function of the slenderness
The same results using non-dimensional parameters for the introducing a non dimensional parameter for the effective Figure 4.
( )
( )
( )
E yE
f
θ
λ θ
π
θ
=
( )
Eb
t
θλ
λ θ
=
, , y y sl y efff k
k
f
θ=
Fig 4. Reduction of the yield strength for different temperatures It is observed that these curves can be separated into
(20°C ≤θ ≤ 100°C), another one at 200°C and the last one be seen that these curves look similar to the buckling curves
0 50 100 150 200 250 300 350 400 0 20 40 60 fy eff Slenderness ratio b/t [ 0 0,1 0,2 0,3 0,4 0,5 0,6 0,7 0,8 0,9 1 0 0,5 ksl[-]
for plates for different temperatures in function of the slenderness
dimensional parameters for the slendernessas given at Eq (3) and Eq. (4), and effective yield strength according to Eq.(5)are shown in
(3)
(4)
(5)
Reduction of the yield strength for different temperatures
three different groups, one for ambient temperature at 200°C and the last one for higher temperatures (300°C ≤θ). It can also the buckling curves ofEurocode3 part 1. It was thus chosen to
80 100 120 Slenderness ratio b/t [-] 20°C 200°C 300°C 400°C 500°C 600°C 700°C 800°C 1 1,5 20°C 100°C 200°C 300°C 400°C 500°C 600°C 700°C 800°C
approximate those results with the Perry-Robertson equation Eq curves equation in the Eurocode.
(
)
(
2)
1
θ θϕ α
=
+
β λ γ
+
+
λ
(
2 2)
1
1
slk
θϕ
ϕ λ
=
≤
+
−
At this step of the study, different values of the parameters temperature, at 200°C and at elevated temperatures (≥3
support conditions. Between these different temperatures, a linear interpolation is used. developed for structures in the fire situation, it is crucial to know the
temperature. Indeed, in fire situations, the structure is generally heated after being loaded at ambient temperature. Also, some parts of the structure may be unaffected by the fire.
must thus be able to catch the behaviour of slender steel sections at room temperature.
Table 1. Parameters used to define the slenderness reduction factor Supports conditions Temperature
Flange (3 sides) Cold (≤ 200°C Hot (≥ Web (4 sides) Cold (≤ 200°C Hot (≥ 300°C
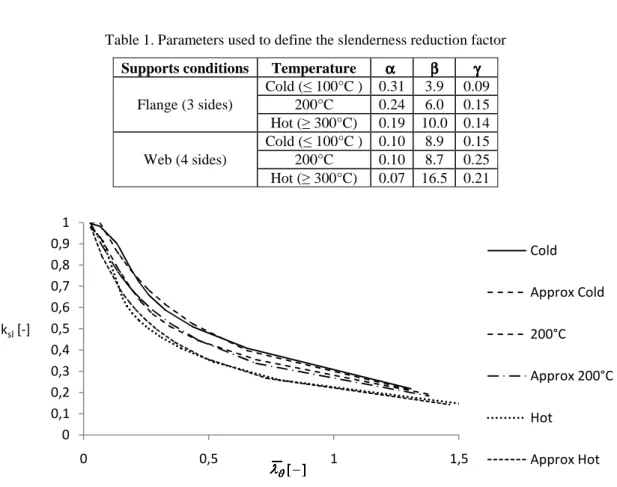
Fig.5. Proposed slenderness reduction factor at ambient and elevated temperatures
Figure 5 shows how the uniaxial results are approximated by Eq. (7) reduction factor ksl was applied on the yield strength, the
to the beginning of the plateau. The proposed stress-strain relationship in for a plate simply supported on three sides with a slenderness ratio
0 0,1 0,2 0,3 0,4 0,5 0,6 0,7 0,8 0,9 1 0 0,5 ksl[-]
equation Eq.(6) [10]as it is the case for the buckling
(6)
(7)
values of the parameters α, β and γare considered for ambient ≥300°C). The values differ also for the two considered Between these different temperatures, a linear interpolation is used.Even if this model is fire situation, it is crucial to know the values of the parameters at ambient , the structure is generally heated after being loaded at ambient Also, some parts of the structure may be unaffected by the fire. The proposed effective law
lender steel sections at room temperature.
to define the slenderness reduction factor Temperature α α α α ββββ γγγγ ≤ 100°C ) 0.31 3.9 0.09 200°C 0.24 6.0 0.15 300°C) 0.19 10.0 0.14 ≤ 100°C ) 0.10 8.9 0.15 200°C 0.10 8.7 0.25 ≥ 300°C) 0.07 16.5 0.21
. Proposed slenderness reduction factor at ambient and elevated temperatures
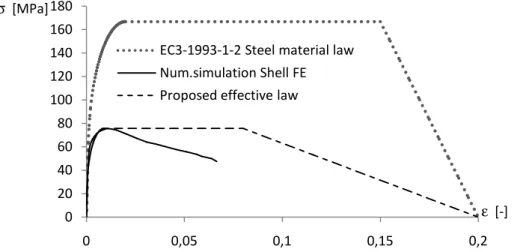
uniaxial results are approximated by Eq. (7) with the values of Table 1. The same the proportionality limit and the strain corresponding strain relationship in compression is shown at Figure 6 for a plate simply supported on three sides with a slenderness ratio b/t of 20and a temperature of 600 °C.
1 1,5 Cold Approx Cold 200°C Approx 200°C Hot Approx Hot
Fig.6. Proposed effective law versus actual steel material law from the Eurocode (EN1993-1-2)
It has to be noticed that at this step of the study, the proposed effective law reproduces the behaviour observed for single plates. Slender cross-sections are considered as an assembly of plates that are simply supported on three or four sides. The contribution of the web to increase the stiffness of the half-flanges is thus not taken into account. In reality, the plate isnot simply supported on the side shared with another plate. The actual support condition is between a simple support and a fixed support. The assumption made in this study is thus conservative. This will be questioned in further studies if the proposed model appears to be too conservative.
4.2 Unloading after loading
As the proposed material law will be introduced in numerical codes, it is important to observe what happens when unloading occurs after loading first in tension or after first loading in compression. The proposed model to catch these loading paths is presented hereafter.
Compression after tension
Figure 7 shows the behaviour observed for a single plate simply supported on three sides with a slenderness ratio b/t = 20 at a temperature of 500°C when the plate is at first submitted to tension and then submitted to compression.
Fig.7. Proposed effective law when unloading after loading in tension 0 20 40 60 80 100 120 140 160 180 0 0,05 0,1 0,15 0,2 σ [MPa] ε [-] EC3-1993-1-2 Steel material law
Num.simulation Shell FE Proposed effective law
-300 -200 -100 0 100 200 300 -0,03 -0,02 -0,01 0 0,01 0,02 0,03 Proposed Model Num. simulation shell FE Monotonous loading
The difference between the behaviour observed and the proposed modelis in the peak observed in compression after elastic unloading. The numerical result is obtained from the modeling of a single plate forced to enter into severe strain reversal. Also, the proposed model has been developed for structures in fire situation and not for cyclic loading. From a large number of numerical tests performed on structures or building assemblies subjected to fire, it was never possible to find any point of integration reaching this part of the diagram before collapse of the structure. Thus, this peak of the stress-strain diagram has not been taken into account and a simplified model was adopted. Once the stress becomes negative, thus when compression stress appears, the point follows the initial curve with an offset corresponding to the plastic deformation in tension.
Tension after compression
As for the unloading after loading in tension, it was not possible to find integration points going back into the tensile stress zone before collapse of the structure. Thus, a simplified relationship has been adopted for this part of the diagram. Nonetheless, as it can be seen on Figure 8, a reduced stiffness is observed during unloading (here for a plate simply supported on three sides, with a slenderness ratio b/t = 20 at a temperature of 500°C). This phenomenon had to be taken into account because some integration points will reach this part of the diagram. The questionwas studied for a large number of plates, for different slenderness, temperatures and support conditions. For each case, the plate was first loaded in compression in order to reach different values of plastic deformation and then unloaded.
Fig.8. Proposed effective law when unloading after loading in compression.
It has been observed that the reduction of stiffness is linked to the plastic deformation, the slenderness and the support condition but doesn’t depend on the temperature. For the same plate under various temperature conditions, the ratio between original elastic stiffness (EN1993-1-2) at this temperature and the observed reduced stiffnessduring unloading remains constant.
Steel generally does not exhibit damage mechanisms linked to micro-cracks as it could be the case, for example, in concrete. In this case, the loss of stiffness in unloading is probably due to the plastic deformation of the plate that develops under first loading in compression. Nonetheless, as for concrete models, it was chosen from phenomenological observations to adopt a damage scalar to capture this effect [11].
Eq. (8, 9 & 10) gives the damage scalar for plates and Table 2 gives the values of the parameters to be used in these equations. -300 -200 -100 0 100 200 300 -0,03 -0,02 -0,01 0 0,01 0,02 0,03 Proposed Model
Num. simulation shell FE
(
)
01
unloadingE
=
E
−
D
(8).
pl pl ba
D
ε
ε
+=
(9).
db
=
c
λ
θ+
e
(10)Table 2.Parameters to determine the damage scalar
Supports conditions a c d e
Web (4 sides). 0.84 0.0003 -3.5 0.0015
Flange (3 sides) 0.95 0.0010 -1.9 0.0010
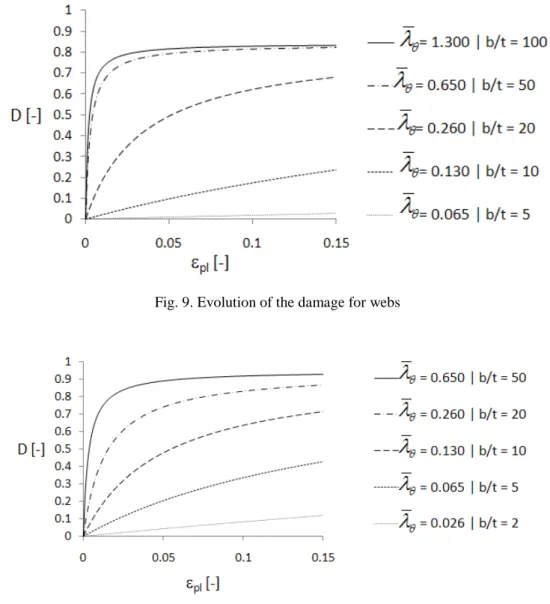
Figures 9 and 10 show the evolution of the damage scalar respectively for plates simply supported on four sides (as a web) and on three sides (as half flanges). The damage scalar is represented in function of the plastic deformation for different slenderness.
Fig. 9. Evolution of the damage for webs
5. VALIDATION AGAINST SHELL FINITE ELEMENTS MODELS
In order to validate the proposed model, it was decided to compare results obtained with the new model to results obtained with shell finite elements. This validation study was conducted on a large range of beams and columns with the software SAFIR. The results obtained for two different beams are presented here. To use the proposed model when modeling beams, the user has to declare two materials, one for the half flanges and one for the web. If the bottom and upper flanges do not present the same slenderness ratio, the user has to declare a third material. For both materials, the useronly has to give two additional parameters compared to the classic steel material law from the Eurocode. One parameter is the slenderness ratio of the plate, the second parameter is the support condition of the plate (half-flanges are represented by plate simply supported on three sides and webs are represented by plates simply supported on four sides). The slenderness ratio is calculated as recommended by Eurocode 1993-1-1. Those parameters are known by the user before creating the model and do not request complex calculation.
The validation tests were first completed at ambient temperature and then at elevated temperature. The example shown here below consists in a simply supported beam subjected to a distributed load.The dimensions of the beam are given in Table 3. Figure 11 shows the results at ambient temperature while the results at 500°c are shown in Figure 12.
Table 3. Dimensions of the tested beam Beamspan [mm] Cross-section height [mm] Web thickness [mm] Cross-section width[mm] Flangethickness [mm] 6000 300 4 150 4
Fig.11. Displacement at mid-span of a simply supported beam subjected to an increasing distributed loadat a temperature of 20°C -0,12 -0,1 -0,08 -0,06 -0,04 -0,02 0 0 50 100 150 200 250 D is p la ce m e n t a t m id s p a n [ m ] Distributed load [kN/m] SAFIR shell
SAFIR beam EC3
Fig.12. Displacement at mid-span of a simply supported beam subjected to a distributed load at a temperature of 500°C
6. VALIDATION AGAINST EXPERIMENTAL LABORATORY TESTS
In the scope of the European project FIDESC4 (Fire behavior of steel members with class 4 cross sections), eight tests on columns axially loaded have been carried out in the fire laboratory of the University of Liège. The main objective of this project is the creation of a full range of experimental evidence about the fire behaviour of steel members with welded or hot-rolled class 4 cross sections (I and H shape).
Numerical simulations have been run to reproduce the experimental results from the fire tests. The objective is to simulate the tests using the real (measured) properties of the steel of the columns, the real global and local imperfections, the real temperature distribution along the column, the real value of the load and the measured eccentricities of the load.
For these tests,the load was first applied;then the columns were heated along the whole length at a constant velocity of 200°C/hour.The results for three different tests are presented here. In the charts, the results of the experimental tests are compared with numerical simulation using shell FE and beam FE. For beam FE, two different curves are plotted, one for the results obtained with the theoretical law of steel from the Eurocode (EN 1993-1-2), and the other one for the proposed effective law.
Table 4. Dimensions of the specimens N°2, 3& 6 Specimen Columnlength [mm] Cross-section height [mm] Web thickness [mm] Cross-section width[mm] Flangethickness [mm] N°2 & N°3 2700 450 4 150 5 N°6 2700 360 4 150 5
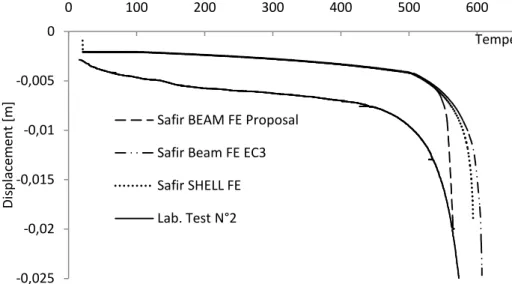
For the specimen N°2, a load of 122.4 kN was applied with an eccentricity in the direction of the weak axis of 5 mm at the bottom and at the top of the column. The initial global imperfection is 2.7 mm in the direction of the weak axis.Figure13shows the evolution of thetransverse displacement at mid-height of the column in the direction of the weak axis. Table5 gives the final temperatures observed for the test and the numerical methods. -0,3 -0,25 -0,2 -0,15 -0,1 -0,05 0 0 50 100 150 D is p la ce m e n t a t m id s p a n [ m ] Distributed load [kN/m] SAFIR shell
SAFIR beam EC3
SAFIR beam proposal
Fig.13. Displacement at mid-height of the column in the direction of the weak axis for specimen N°2
Table 5. Failure temperature for specimen N°2
Lab.Test SAFIR Shell SAFIR beam EC3 SAFIR beam proposal
Failuretemperature [°C] 604 594 608 564
Specimen N°3 has the same dimensions as specimen N°2. A load of 204 kN was applied with an eccentricity in the direction of the weak axis of 4 mm at the bottom of the column and 13 mm at the top of the column. The initial global imperfection is 5.4 mm in the direction of the weak axis. Figure 14 shows the evolution of the transverse displacement at mid-height of the column in the direction of the weak axis. Table6 gives the final temperatures observed for the test and the numerical methods.
Fig.14. Displacement at mid-height of the column in the direction of the weak axis for specimen N°3 Table 6. Failure temperature for specimen N°3
Lab.Test SAFIR Shell SAFIR beam EC3 SAFIR beam proposal
Failuretemperature [°C] 452 459 495 337 -0,025 -0,02 -0,015 -0,01 -0,005 0 0 100 200 300 400 500 600 700 D is p la ce m e n t [m ] Temperature [°C]
Safir BEAM FE Proposal Safir Beam FE EC3 Safir SHELL FE Lab. Test N°2 -0,04 -0,035 -0,03 -0,025 -0,02 -0,015 -0,01 -0,005 0 0 100 200 300 400 500 600 D is p la ce m e n t [m ] Temperature [°C] Safir BEAM FE Proposal
Safir Beam FE EC3 Safir SHELL FE Lab. Test N°3
The dimensions of the specimen N°5 are given in Table 4. A load of 231kN was applied with an eccentricity in the direction of the strong axis of 71 mm at the bottom and at the top of the column. The initial global imperfection is 2.2 mm in the direction of the weak axis. Figure 15 shows the transverse displacement at mid-height of the column in the direction of the weak axis. The table 7 gives the final temperatures observed for the test and the numerical methods.
Fig.15. Displacement at mid-height of the column in the direction of the strong axis for specimen N°5 Table 7. Failure temperature for specimen N°5
Lab.Test SAFIR Shell SAFIR beam EC3 SAFIR beam proposal
Failuretemperature [°C] 508 528 600 465
7. CONCLUSIONS
The proposed effective law is a simple way to take into account in numerical models based on beam finite elements the local instabilities that may occur in slender sections. The stress-strain relationship in compression is modified by a reduction of the proportionality limit, of the effective yield strength and of the strain corresponding to the beginning of the horizontal plateau. The elastic stiffness during unloading after first plastification in compression is also reduced according to a damage model in order to take into account the plastic deformation of the plate.
The level of reduction depends on the slenderness of each plate that makes the section and on the boundary conditions of the plate; these two parameters can be easily evaluated by the user and introduced as new material parameters. The numerical code in which the new effective law is used takes care, at each integration point, of the variation of temperature and mechanical strain.
Some comparisons have been made with numerical results obtained by much more expensive shell finite elements and with experimental test results. The results are generally satisfactory although sometimes too conservative. A possible way of improvement could be to take into account the support provided by the plates to each other which create some supports that are not completely free in rotation; the slenderness of the plates may thus be lower than considered in these applications.
-0,02 -0,015 -0,01 -0,005 0 0 100 200 300 400 500 600 700 D is p la ce m e n t [m ] Temperature [°C]
Safir BEAM FE Proposal Safir Beam FE EC3 Safir SHELL FE Lab. Test N°5
REFERENCES
[1] EN 1993-1-3. “Eurocode 3 – Design of steel structures – Part 1–3: General rules – supplementary rules for cold-formed members and sheeting”,European Committee for Standardization, European Prestandard, Brussels, 2006.
[2] Bambach, M.R., Rasmussen, K.J.R, “Effective Widths of Unstiffened Elements with Stress Gradient”, Journal of Structural Engineering, Vol.130, No.10, 1611-1619, 2004
[3] Knobloch, Fontana,M. “Strain-based approach to local buckling of steel sections subjected to fire”, Journal of Constructional Steel Research, Vol. 62, 44-67. 2006,
[4] Degée, H., “Stability and non-linear behavior of thin-walled members and structures”, International Journal of Structural Stability and Dynamics”, Vol.7, No.2, 213-241, 2007.
[5] Franssen, J.-M., “SAFIR, A thermal/Structural Program for Modelling Structures under Fire”, Eng J A.I.S.C., 42, 143-158, 2005
[6] Franssen, J-M, Cowez,B, “Consideration of local instabilities in beam finite elements by means of effective constitutive laws”, Proceedings of the 7th International Conference on Structures in Fire, Zurich, 2011.
[7] Jones, R.M., Buckling of bars, plates and shell, Bull Ridge Publishing, Blacksburg, Virginia, 2006. [8] Rees, D. Mechanics of Optimal Structural Design : Minimum Weight Structures, John Wiley & Sons
Ltd, United Kingdom, 2009.
[9] EN 1993-1-5. “Eurocode 3 – Design of steel structures – Part 1–5: Plated structural
elements”,European Committee for Standardization, European Prestandard, Brussels, 2003.
[10] EN 1993-1-2. “Eurocode 3: Design of steel structures – Part 1-2: General rules –Structural fire design”. European Committee for Standardization, European Prestandard, Brussels, 2005
[11] J.-L.Chaboche. “Continuum Damage Mechanics: Part1 – General Concepts”, Journal of Applied Mechanics, Vol.55. 59-64, 1988
![Table 3. Dimensions of the tested beam Beamspan [mm] Cross-section height [mm] Web thickness [mm] Cross-section width[mm] Flangethickness [mm] 6000 300 4 150 4](https://thumb-eu.123doks.com/thumbv2/123doknet/6862460.192112/10.748.50.717.466.856/table-dimensions-tested-beamspan-section-thickness-section-flangethickness.webp)
![Table 4. Dimensions of the specimens N°2, 3& 6 Specimen Columnlength [mm] Cross-section height [mm] Web thickness [mm] Cross-section width[mm] Flangethickness [mm] N°2 & N°3 2700 450 4 150 5 N°6 2700 360 4 150 5](https://thumb-eu.123doks.com/thumbv2/123doknet/6862460.192112/11.748.153.617.60.345/dimensions-specimens-specimen-columnlength-section-thickness-section-flangethickness.webp)