RESEARCH
Cross-border spatial accessibility of health
care in the North-East Department of Haiti
Dominique Mathon
1, Philippe Apparicio
1*and Ugo Lachapelle
2Abstract
Background: The geographical accessibility of health services is an important issue especially in developing coun-tries and even more for those sharing a border as for Haiti and the Dominican Republic. During the last 2 decades, numerous studies have explored the potential spatial access to health services within a whole country or metropoli-tan area. However, the impacts of the border on the access to health resources between two countries have been less explored. The aim of this paper is to measure the impact of the border on the accessibility to health services for Haitian people living close to the Haitian-Dominican border.
Methods: To do this, the widely employed enhanced two-step floating catchment area (E2SFCA) method is applied. Four scenarios simulate different levels of openness of the border. Statistical analysis are conducted to assess the differences and variation in the E2SFCA results. A linear regression model is also used to predict the accessibility to health care services according to the mentioned scenarios.
Results: The results show that the health professional-to-population accessibility ratio is higher for the Haitian side when the border is open than when it is closed, suggesting an important border impact on Haitians’ access to health care resources. On the other hand, when the border is closed, the potential accessibility for health services is higher for the Dominicans.
Conclusion: The openness of the border has a great impact on the spatial accessibility to health care for the popula-tion living next to the border and those living nearby a road network in good condipopula-tions. Those findings therefore point to the need for effective and efficient trans-border cooperation between health authorities and health facili-ties. Future research is necessary to explore the determinants of cross-border health care and offers an insight on the spatial revealed access which could lead to a better understanding of the patients’ behavior.
Keywords: Spatial accessibility, Health care, Enhanced two-step floating catchment area, Border, Haiti, Dominican Republic
© The Author(s) 2018. This article is distributed under the terms of the Creative Commons Attribution 4.0 International License (http://creat iveco mmons .org/licen ses/by/4.0/), which permits unrestricted use, distribution, and reproduction in any medium, provided you give appropriate credit to the original author(s) and the source, provide a link to the Creative Commons license, and indicate if changes were made. The Creative Commons Public Domain Dedication waiver (http://creat iveco mmons .org/ publi cdoma in/zero/1.0/) applies to the data made available in this article, unless otherwise stated.
Background
The geographical accessibility of health services is an important issue in public health and for improved health outcomes, especially in developing countries [1–6]. Dur-ing the last two decades, numerous studies have explored the potential spatial access to health services within a whole country or metropolitan area [7–10]. Scholars have also analyzed cross-border mobility for health care in several diverse contexts [11–24]. But fewer studies
address the impact of an international border and its openness on the spatial access to health care resources [25, 26].
The concept of borders has been evolving throughout the years from their being seen as barriers to their being considered as contact zones, but regional integration and border openness have been questioned in several con-texts [27–32]. Studies analyzing cross-border mobility for the use of health care services emphasize the unique-ness of the different border contexts and the importance of the direction of flows [16, 24]. Cross-border mobility for health care access may be explained by a variety of factors. It depends on the various individuals’ situations
Open Access
*Correspondence: [email protected]
1 Environmental Equity Laboratory, INRS Centre Urbanisation Culture
Société, 385, rue Sherbrooke Est, Montréal, Québec H2X 1E3, Canada Full list of author information is available at the end of the article
and needs. It may be motivated by dissatisfaction with health care provision in the home country or by actual deficiencies there. A lack of coverage (in terms of health care insurance) or a quest for specialized health care may influence individual choice. Glinos et al. [12] indicate that, during the decision-making process, patients bal-ance factors such as proximity, family support and social ties. Affordability, availability and quality of care are also determinants. Analyzing patient mobility between Laos and Thailand, Bochaton [14, 15] demonstrates the importance of well-established mobility practices as well as social networks among border populations in the seek-ing of cross-border health care. Social networks are also considered by Dione [16] as one of the determinants of patients’ cross-border mobility in four African countries sharing a border. Proximity (physical accessibility) is also one of the main determinants of patient mobility in the very different contexts of European [11] and African countries [16].
Access to health care is multidimensional, and most of the studies on patients’ cross-border mobility for health care access have used the seminal framework developed by Penchansky and Thomas [33]. These authors consider five dimensions in order to measure “the degree of fit between the clients and the system” [33]. Two of these dimensions are spatial: (1) availability (adequacy between the supply and the demand); and (2) accessibility, or the location of the supply relative to the location of the cli-ents. The other three are aspatial and reflect socioeco-nomic and cultural factors: (1) accommodation, or the adequate matching of the supply organization with the clients’ abilities and perceptions; (2) affordability, or the prices of the services relative to the clients’ income or ability to pay; and (3) acceptability (clients’ and providers’ attitudes toward one another). These dimensions may act as either facilitators or barriers.
Regarding spatial accessibility, scholars define this in terms of the possible use of the services (potential acces-sibility) and their actual use (realized accesacces-sibility) [34, 35]. This differentiation between potential access and realized access makes it possible to better identify the barriers to or facilitators of access. The extent of the spa-tial separation between supply and demand can therefore be analyzed. In this article, we focus on potential spatial accessibility in a borderland context. The border acts either as a geographical constraint or as a facilitator.
Our hypothesis is that accessibility varies depending on the level of border openness. In addition, the lack of ser-vices (push factor) in Haiti and the more attractive sup-ply (pull factor) in the Dominican Republic may lead to polarized flows in a push/pull dynamic.
The aim of this paper is to evaluate the spatial accessi-bility of health care services for Haitians living along the
Haitian-Dominican border, and to measure the impact of this border on their health care access using the well-known E2SFCA method.
The Haitian‑Dominican border
The Haitian-Dominican border inherited from the colo-nial period has given rise to a “double insularity” [36, 37] that has been settled through a long process of social and spatial differentiation as well as ideological distancing [36–38]. Both countries have forged and asserted their particular national identities through their respective his-tories and struggles to achieve the construction of their own nation state [37, 39]. The discontinuities (territorial, cultural, socioeconomic and political) are therefore quite visible at the Haitian-Dominican border [40, 41]. An entire apparatus (gates, military control on the Domini-can side, etc.) is in place to mark and create this distance [41–43]. At the same time, the relative and recent border opening has given rise to a transitioning process which is redefining the function of the border as moving toward a “space of coexistence and cooperation” while sustaining asymmetrical and conflicting interactions along the bor-der line [40, 42, 44, 45].
Officially (since 1987), the border has been opened during the day and closed at night. There are four offi-cial entry points and several informal crossing points, the number of which is not precisely known [38]. These informal crossing points underscore the permeability of the border as well as the complexity of the cross-border mobility [43]. The flow of the population may be con-strained by different conflictual situations: a national decision (epidemiological surveillance, control of smug-gling, etc.) or a particular local situation (protest about Dominican soldiers’ aggressive behaviours, protest over national decisions, protests from Haitian or Dominican traders, etc.) [44]. From 2000 to 2016, the border was closed a number of times for varying numbers of hours or days. But the intensity and importance of the commer-cial exchanges for both countries, at different levels, may act as a leverage for conflict settlement.
Cross-border movements from both sides have existed since the colonial period, but Haitian labour flows started in the early twentieth century with the North Ameri-can occupation of both countries [38, 43, 46–48]. Vari-ous mechanisms are in place in the Dominican Republic to regulate such flows (illegality of the Haitian work force, massive deportations, etc.) [38, 48]. According to the recent survey on migration, more than 80% of immigrants in the Dominican Republic are Haitian [49, 50]. The importance of Haitian labour for the construc-tion industry as well as for the agricultural sector is well documented [38, 43, 46, 47, 49–51]. Some studies [38, 46] have revealed a “feminization of Haitian migration
flows.” Others [42] have emphasized the difficulty of dis-tinguishing between irregular migration, smuggling and trafficking.
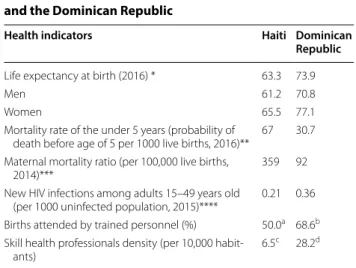
On the other hand, there is some evidence that the per-centage of Haitian immigrants using health care facilities is higher than for other immigrants [49]. Furthermore, during the last two decades, the Dominican Republic has been used to channel international aid to Haiti. Mon-tiel et al. [46] emphasize the differential impact of this, including, for example, the reinforcement of the Domini-can health care system at the expense of the Haitian one. They consider this to be a factor that could have encour-aged a growing number of Haitians to cross the border in search of health care [46]. Their comments are in line with evidence from other studies addressing cross-border health care mobility in different contexts [12, 15, 16]. But beyond the significant and quite systematic health out-come disparities between both countries (Table 1), what are the differences between the two health care systems?
Main characteristics of the public health care systems in Haiti and the Dominican Republic
The health care system in most Latin American and Car-ibbean countries is segmented, with a variety of financing
structures and affiliation types. It is also fragmented, with a supply offered by many institutions (public and private) and facilities that are not well integrated into the health care network [52]. This fragmentation and segmentation exacerbate inequities in access [52], which is also the case in Haiti [53] and the Dominican Republic [53, 54].
Reforms of the health care system: Access to health care and equity
During the last two decades, both countries—like most Latin American [53, 54] and Caribbean countries [55]— have been involved in an ongoing process of reforming their health care sector. These reforms are intended to improve health outcomes and to reduce health inequities. They are based on the following principles: a regulatory role for public health institutions, multisectoral produc-tion of health care, universal access, equity and solidarity, and efficiency and efficacy of the health care system [56– 59]. Changes have been made in the structure and organ-ization of the public health care system in both countries in order to improve access to health care and especially to primary care. Nevertheless, the pace and the imple-mentation of such reforms have fluctuated from one side of the border to the other [55].
In the Dominican Republic, the reform has been the starting point for universal access to health care [54]. Catchment areas have been defined to maximize resource allocation for primary care as well as for equity. Citizens must be assigned to or registered in a Primary Care Unit (Unidad de Atención Primaria). But the coverage is still deficient (less than 50% of the population was covered in 2012), with disparities found among different socioeco-nomic groups (the poorest have limited access to health care) and also between rural and urban areas [54].
In Haiti, changes have also been made to improve coherence with administrative boundaries and respect for the equity and universality principles included in the health reform [60]. But the Haitian health system still faces complex organizational and institutional challenges [55]. Moreover, data from the Enquête Mortalité,
Mor-bidité et Utilisation des Services (EMMUSV) highlight
the lack of coverage: less than 5% of the respondents [61] have health care insurance. As for the Dominican Repub-lic, wealthier and urban people have more access, which means that any form of equity is still largely incomplete [61, 62].
Organization of the health care system
Both countries have a three-tiered health care system [56, 57, 60, 63, 64], but with some specific differences, as shown in Fig. 1. The pyramidal model is organized according to three levels of complexity: primary, second-ary and tertisecond-ary. It is designed to break away from the
Table 1 Basic health indicators for Haiti
and the Dominican Republic
Sources: *World Development Indicators. World Bank Group at databank.
worldbank.org
**Estimates Developed by the UN Inter-agency Group for Child Estimation (UNICEF, WHO, World Bank, UN DESA Population Division) at childmortality.org ***WHO, UNICEF, UNFPA, World Bank Group, and the United Nations Population Division. Trends in Maternal Mortality: 1990–2015. Geneva, World Health Organization, 2015
****2015, Source: UNAIDS/WHO; estimates 2016
a 2015
b 2014; PAHO/WHO, Health in the Americas—Summary: Regional Outlook and
Country Profiles, 2017
c Source: MSPP, 2012
d Source: 2005–2013, WHO Global Health Workforce Statistics database
Health indicators Haiti Dominican
Republic
Life expectancy at birth (2016) * 63.3 73.9
Men 61.2 70.8
Women 65.5 77.1
Mortality rate of the under 5 years (probability of
death before age of 5 per 1000 live births, 2016)** 67 30.7 Maternal mortality ratio (per 100,000 live births,
2014)*** 359 92
New HIV infections among adults 15–49 years old
(per 1000 uninfected population, 2015)**** 0.21 0.36 Births attended by trained personnel (%) 50.0a 68.6b Skill health professionals density (per 10,000
habit-ants) 6.5
existing hospital-centred structure in order to improve the population’s access to primary care. The reference and counter-reference system allows patients to transit within the system from the entry point to specialized ser-vices when required.
The primary level consists of outpatient services and community care. The first level therefore offers basic health care (minimum service package) and prevention and promotion activities. One of the main organizational differences between the Haitian and Dominican health care systems is found at this level. In Haiti, the primary level is subdivided into three parts. It includes different kinds of facilities located in distinct territorial entities: (1) Health community centre located in the Section
com-munale (the smallest territorial division) and offering
ambulatory care and prevention and promotion activi-ties; (2) Health centre in the Commune delivering preven-tive and curapreven-tive care, including normal childbirth; and (3) Community Reference Hospital (HCR) in the
Arron-dissement providing a range of care including sensitive
interventions requiring specialists in internal medicine, surgery, pediatrics, obstetrics and gynecology. However, the official documents are somewhat confusing, as two of them [57, 65] consider only two subdivisions and others [60] mention three. Either way, the subdivision appears to be the Haitian health authorities’ response in order to accommodate the prevailing in terms of primary care facilities and to carry out the transition process toward the mainstream pyramidal model [60, 65].
It is important to emphasize that, in the Dominican Republic, each citizen is assigned a Primary Care Unit near their home (Unidad de Atención Primaria—UNAP) regardless of their insurance system [59], which is not the
case in Haiti. Moreover, these units offer the same range of services as the first two Haitian first-level subdivisions.
The facilities of the second level (General Hospital in the Dominican Republic, whether administered at the municipal or provincial level, and Departmental Hospi-tal in Haiti) offer basic specialized care in both countries. The services offered by the third level cover all contin-gencies during hospitalization and attend to the most complex cases.
Binational cooperation in health
The Haitian health master plan (2012–2022) considers reinforcing coordination with the Dominican Republic in order to reduce health issues in the epidemiological field in the borderland regions. It also seeks to develop relevant strategies and partnerships in the management of infectious diseases. There is a binational agreement for the control of tuberculosis aimed at successful coordina-tion of the accoordina-tions undertaken in the borderland regions and mainly targeting migrants, the populations of the
bateyes (settlements around sugar mills where Haitian
migrant workers live in very precarious conditions) and of the industrial areas, as well as those living in the bor-derland regions. In the case of natural disasters (floods in 2004 and the earthquake in 2010), the Dominican health facilities have supported the Haitian population by offer-ing medical services to those needoffer-ing them [44, 66, 67]. There are also coordinated vaccination campaigns in the borderland regions. But, as far as the official documents of both countries indicate, there is no cross-border coop-eration in health care involving any hospitals or other facilities.
Data and methods
Study area
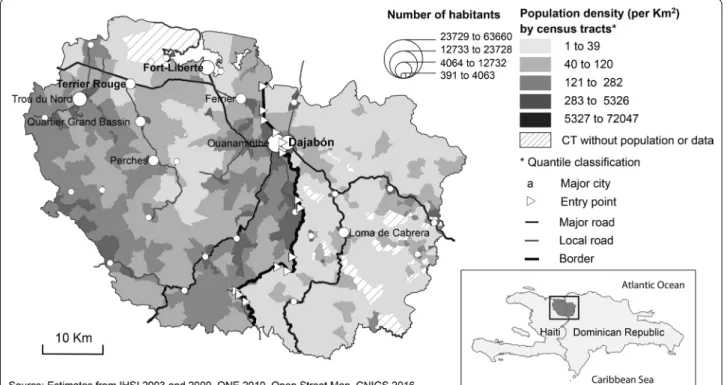
The area studied is in the northern part of the island of Haiti/Quisqueya, and focuses on the region along the Haitian-Dominican border, with one official daytime entry point (Ouanaminthe-Dajabón) and several infor-mal crossing points (Fig. 2). Evidence for the last three decades has shown a significant growth in the intensity and diversity of interactions along the border, especially at the entry point, that is, Ouanaminthe-Dajabón [68, 69], the border’s second leading entry point.
The cities of Ouanaminthe and Dajabón have played an important role throughout the history of both countries [70]. They have also witnessed violent conflicts such as the massacre of thousands of Haitians in October 1937. This borderland is evolving nowadays from a barrier to a contact zone and an interdependent zone [41, 69, 70]. Several stakeholders (international organizations, the transnational capital, merchants, grassroots organiza-tions, etc.) are engaged in this process [70]. The reloca-tion of a private Dominican industrial free-trade zone in the fertile plain of Maribahoux in Ouanaminthe (a project financed by the International Finance Corpora-tion) however highlights the advantages derived by the Dominican Republic from its different level of develop-ment from that of Haiti. It shows how such disparities are helping to widen the gaps and are fostering more asymmetrical interactions [41, 70, 71]. Furthermore, the
recent proliferation of binational projects promoted and financed by international organizations is tending to set the framework for a new era of cross-border cooperation [41] in different fields, including health issues.
The level of poverty is globally higher in the border-land regions of both countries [72, 73], but there are still important disparities in terms of infrastructures, ser-vices, etc. between the North-East Department and the Province of Dajabón. As shown in Fig. 2, the Haitian side of the border is denser, with more and larger sized cities.
In the health sector, this intense mobility has forced the implementation of binational mechanisms for epi-demiological surveillance. Gaps in the supply of social services (health, education) tend to lead to asymmetrical interactions and polarized flows in a push/pull dynamic [68, 69, 74]. On the other hand, few studies [49, 75] have indicated that the ratio of foreigners using health care facilities is higher in the Dominican borderland region compared with the rest of the country.
Statistics from the Dominican public health secretary show that, in 2015, almost 10% of public hospital patients (consultation and emergency) in the Province of Dajabón were foreigners. The rate is even higher for the primary care centres (35%) (Table 2). Information about foreign patients’ nationality is not available. The high percentage of Haitian migrants (87.2% of the immigrant population in Dominican Republic was born in Haiti according to the Second National Immigrant Survey held on 2017) and
proximity to the border suggest that most of those for-eign patients are Haitian, but there is no direct evidence for this. The condensed version of the Second National Immigrant Survey (ENI-2017) indicates that 77% of the migrants born in Haiti as well as 78% of those born in Dominican Republic of foreigners parents used the pub-lic health services [50], Moreover, hundreds of thousands of Haitian descendants [39] are not considered to be Dominicans because of the 2013 judgment TC/0168/13 of the Dominican Constitutional Court and the 169-14 Law [76]. It is thus difficult to estimate the percentage of patients crossing the border to obtain health care and the proportion of Haitians living in the Dominican Republic.
Data
Three types of GIS data are needed to assess the potential accessibility of health care services.
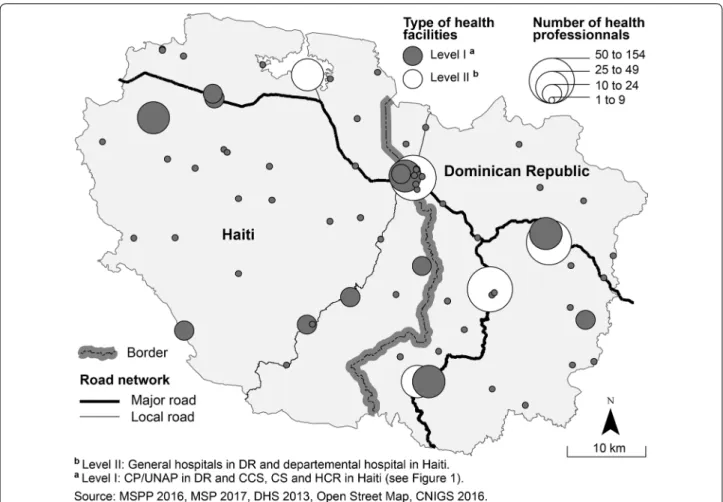
a. For the supply side: The geographic locations of pub-lic health facilities in each country have been col-lected from the websites of the health secretaries of Haiti and the Dominican Republic. Data on the num-ber of health professionals for each health facility have been provided by the Department of Informa-tion of the Dominican Republic’s public health min-istry (Departamento de Información de salud). For Haiti, such data were available on the health map on the website of the public health ministry (Ministère
de la santé publique et de la population). According
to those respective sources, there is a total of 70 pub-lic health facilities (35 on each side) and 932 health professionals (322 on the Haitian side and 610 in the Dominican Republic) (Fig. 3). It is worth noticing on the Haitian side (North-East Department), there is only one public facility of the second level and none at the border city of Ouanaminthe. Meanwhile the Province of Dajabon counts with four public facilities
of the second level (municipal hospitals or general hospital) and one of them located in the border city of Dajabón.
b. For the demand side: The demographic data have been extracted from the censuses at the equivalent of the census block level (Section d’énumération—
SDE) for Haiti (N = 422) and at the neighbourhood
level (Barrio) for the Dominican Republic (N = 202). The neighbourhood was the finest spatial unit avail-able. The average population is 868 for the SDE and 317 for the Barrio. The demographic data for Haiti and the Dominican Republic were provided by the national statistical institutes (Institut
Haï-tien de Statistiques et d’Informatique—IHSI and Oficina Nacional de Estadística—ONE, respectively).
Because the last census in Haiti was held in 2003, we had to estimate the population for 2010 (the year of the Dominican census). Our estimates are based on those made by the IHSI for 2009, in applying their population growth rate. The use of a centroid consid-ers that the population is evenly distributed within the spatial unit used (SDE or Barrio), which is not the case, especially for a scattered rural population area. To better reflect the reality of the settlements in the rural areas, we use an adjusted centroid of the spatial unit. The adjustments are based on photo interpreta-tions of Google and Bing imagery.
c. For the travel distance: The road network data were retrieved from Open Street Map (OSM) for both countries. Data were also provided by Haiti’s National Centre of Geospatial Information (Centre National
d’Information Géospatiale – CNIGS). The data were
validated using Google and Bing imagery. The road classification of the Haitian and Dominican transport secretaries was used. A maximum travel speed was assigned to each class of road as indicated in Table 3 based on various sources and photointerpretation to
Table 2 Dominican health care facilities use for consultation and Emergency by national and foreign patients, 2015.
Source: MSP, Vice Ministry of Planning and Development – Department of Health Information (DIS)
(29) equals to the number of first level centers/primary care units
*Database of monthly records of Hospitals Services (67A) 2015 updated on April 27th 2016 **Monthly reports of services of the centers of first level of attention (R-8) 2015
Health care facilities National patients Foreign patients
Consultation Emergency Total Consultation Emergency Total
Hospital Municipal Partido* 6475 7337 13,812 610 380 990
Hospital Dr. Ramon Adriano Villalona* 15,478 4910 20,388 1265 420 1685
Hospital Municipal Restauración* 9881 2332 12,213 2902 472 3374
Hospital Ramon Matias Mella* 15,963 14,502 30,465 555 819 1374
assess roads conditions. For pathways, the maximum travel speed is 3 km/h in order to in some way reflect the geographic constraints, since the central part of
the area studied is nested in a mountainous chain. The entry points were georeferenced based on aerial photo interpretation.
Methods
To measure the impact of the opening of the border on the spatial access to health care, we consider different scenarios with varying border crossing time impedance: open, semi-open, or closed. These scenarios are hypo-thetical, since the level of control is not the same along the border or at the informal crossing points or entry points. Furthermore, different factors (objective and sub-jective) influence the smoothness of the flows of Haitians at the Dominican border.
The estimates of the time spent crossing are based upon: (1) on-site observations in July 2016 and June 2017 at the Ouanaminthe-Dajabón entry point; and (2) informative discussions with key resources in Oua-naminthe and organization members working along the border line.
Fig. 3 Health care facilities and health professionals in the studied area
Table 3 Road classification and speed
Sources: *MTPTC 2015; CIAT 2010
**2010 at oisevi.org; DIGESETT, Ley 241-67
Country Road type Speed
Haiti* National roads 70 km/h
Departmental roads and segment of
national roads in living areas 50 km/h Communal roads, local roads, streets 30 km/h Track and others, unclassified roads 15 km/h
Pathways 3 km/h
Dominican
Republic** Major roads and regional roadsLocal roads 80 km/h50 km/h
Streets 35 km/h
Country roads 30 km/h
Others, unclassified roads 15 km/h
a. The first scenario is an open border, where there is less control (or almost none) at the Dominican bor-der. The border is open on Friday and Monday when the so-called “binational” market takes place in Dajabón. Haitians are “free” to cross, and no papers are needed. But, due to the intense flows, delays could be observed. A 15-min cost is thus added to the travel time required to cross the border in order to take into account light traffic or migration con-trols.
b. The second and third scenarios consider the bor-der half closed. In this case, there is more control at the Dominican border. It is a twofold situation: a) a normal border control for migration and light traffic (scenario 2); and b) stricter control and heavy traffic (scenario 3). The cost varies from 30 min for scenario 2–60 min for scenario 3.
c. In the fourth and last scenario, the border is closed. No crossing is permitted. This is, for example, the case during the night or in some other particular contexts such as conflicts, elections, etc.
For all four scenarios, we consider only one direction flow: from Haiti to the Dominican Republic. This choice is based on the hypothesis that, due to the disparities between both countries, a push/pull dynamic polarizes cross-border flows toward the Dominican Republic.
The Enhanced Two‑Step Floating Catchment Area (E2SFCA) method
The potential spatial accessibility as described earlier is the distance between the supply (in this case, the number of health professionals) and the demand, defined by the overall population. Numerous studies have demonstrated the importance of the distance (metres or travel time) to access health care in developing countries [1, 2, 4]. Geo-graphic constraints as well as road conditions can trigger low access to health care and impact the use of health care facilities, with important repercussions for health
outcomes and public health. Several methods are used to measure spatial accessibility [77, 78]. The approach based on available supply assumes that all users within the same catchment area have equal access regardless of the geographic constraints [9, 77]. The gravity model and its derived two-step floating catchment area (2SFCA) method consider spatial interactions and the mobility of the population [35]. The well-known two-step floating catchment area method computes the ratio between the supply (number of physicians or health professionals) and the demand (population) within a catchment area for each supply point at first and ultimately for each demand point [79, 80]. To overcome the limitations of the 2SFCA, an enhanced method has been developed by Luo and Qi [10] by applying weights to differentiate travel time zones in accounting for distance decay.
This method is used to evaluate the cross-border potential spatial accessibility of the health care services. Since the area studied includes rural areas, the catchment area (within a 60-min driving, motorbiking and walking time) has been divided into four travel time zones, as proposed by some authors [79, 81]: 0–15, 15–30, 30–45 and 45–90 min. The 45–90 min travel zone considers the 60-min cost for a semi-open border with stricter control, as indicated above. The maximum travel speed for each class of road accounts for the assumed mixed transpor-tation mode (walking combined with motorbiking, the most usual transportation mode in the studied area).
The method is implemented in two steps, using the equations below. The first step assigns an initial ratio to each health service within the catchment area. In the sec-ond step, for each demand location within the catchment area, we search all supply locations and then sum up the initial ratio Rj at these locations. The resulting Ak
repre-sents the accessibility of the population at location k, Rj
the supply-to-population ratio at the health service (sup-ply) location j that falls within the catchment area, and
dkj the distance (min) between k and j. The same distance
weights derived from the Gaussian function used in step 1 are applied to different travel time zones to account for distance decay. A larger value implies better accessibility. Rj= Sj k∈ dkj∈Dr PkWkj = Sj k∈ dkj∈d1 PkW1+ k∈ dkj∈d2 PkW2+ k∈ dkj∈d3 PkW3+ k∈ dkj∈d4 PkW4 Ak = k∈ dkj∈Dr Rj= k∈ dkj∈d1 RjW1+ k∈ dkj∈d2 RjW2+ k∈ dkj∈d3 RjW3+ k∈ dkj∈d4 RjW4
where Sj represents the weight given to service S such
as its size (i.e. number of health professionals) (“supply side”), dkj is the distance (travel time) between spatial unit
centroid k and health service j, d0 is the threshold travel time (min), Pk represents the demand at location k that
falls within catchment area j and W1, W2, W3, W4 = 1.00, 0.80, 0.55, 0.15 with a slow step-decay function or 1.00, 0.60, 0.25, 0.05 with a fast step-decay function.
The calculations are done using two kinds of software (ArcGIS and SAS). The cost-distance matrix obtained using the Network Analyst extension in ArcGIS has been exported to SAS to compute the E2SFCA. The final results are mapped in ArcGIS.
Statistical analysis was conducted to explore the dif-ferences and variation for the E2SFCA calculations. The Wilcoxon test was computed to assess the differences and variation observed in the E2SFCA results for each scenario and country. Finally, linear regression models were used to predict the accessibility of health services (E2SFCA) according to the four scenarios and their variation. All statistical analyses were carried out using SAS software.
Results
As mentioned before, four simulations are considered to measure the impact of the opening of the border on the level of accessibility of public health services for the borderland population of the North-East Department and the Province of Dajabón. To facilitate the comparison between the four scenarios, a quantile classification with five classes has been used and mapped (Fig. 4). Following are the results for each scenario.
Scenario 1: Open border
The first scenario is with an open border. A penalty of 15 min is added to the travel time of Haitians crossing the border. The results show contrasting levels of acces-sibility in the North-East Department between areas next to the border and more remote locations (Fig. 4a). Two features stand out. First, a large area located mostly in the commune of Ouanaminthe has the highest ratio of accessibility. A smooth gradation is observed to the west (along the national road connecting this region with the North Department and its capital, Cap-Haïtien, the second most important city in Haiti), and to the north-west toward Fort-Liberté (the North-East Department’s capital). Second, a sharp drop in the level of accessibil-ity is seen between those two regions (respectively [P60 to P80[and [P80 to Max], the last two quintiles) and the other remote locations (corresponding to the first quin-tile, [Min to P20[). The areas with the highest level of accessibility are those where hospitals with a larger num-ber of health professionals are located. They are also
better connected to a road network in good condition, with higher maximum speeds.
The pattern in the Dominican Republic is quite dif-ferent: the municipalities at the edge of the Province have the highest level of accessibility, and those next to the border have moderate to low access. There are scat-tered areas with a very low level of access to health care. Dajabón, the main city of the Province, has a moderate level of accessibility with an open border because of its proximity to Ouanaminthe, a city with a population of 60,000. Therefore, an open border induces potential overload of the Dominican health care services due to an increased demand from Haitians and consequently lowers the health professional-to-population accessibil-ity ratio for the Dominicans. But the overall situation in terms of accessibility in the Dominican Republic remains better than in Haiti, even with an open border.
Scenario 2 and scenario 3: Half‑closed border
Scenario 2 is with a half-closed border, with a 30-min cost to cross the border, and the scenario 3 is with a 60-min cost. The map indicates some changes in the pat-tern compared with the open border (Fig. 4b). First, there is a small drop in the extent of the area with the high-est accessibility on the Haitian border side. Second, on the Dominican side, the level of accessibility is globally higher than that observed in the first scenario because of a decrease in the potential demand from Haitians at the Dominican sites.
Scenario 3 is a half-closed border, with a 60-min cost added for crossing the border, indicating more control on the Dominican border (Fig. 4c). The results show a sig-nificant reduction in the extent of the area with a higher level of accessibility on the Haitian side of the border. On the Dominican side of the border, there is a noticeable improvement in the overall level of accessibility in the Province of Dajabón. The 60-min cost added causes a sig-nificant decrease in the Haitians’ potential demand at the Dominican sites which is limited to the 15 min travel zone. Therefore, the Dominicans accessibility level increases beyond the 30–45 min travel zones. The results also emphasize the impact of the low road coverage especially on the Haitian population’s access to health resources.
Scenario 4: Closed border
With the border closed, the results show the potential spatial accessibility of health care facilities in each coun-try (Fig. 4d). Globally, the level of accessibility is higher in the Dominican Republic than in Haiti. In fact, the quasi-totality of the Haitian spatial units belongs to the first two quintiles (light gray), while those of the Dominican
Republic belong to the last two quintiles (dark gray), drawing attention to the existing disparities between both countries in terms of potential accessibility to health care. This scenario also confirms the striking gaps within the North-East Department, especially between the remote locations and the urban areas.
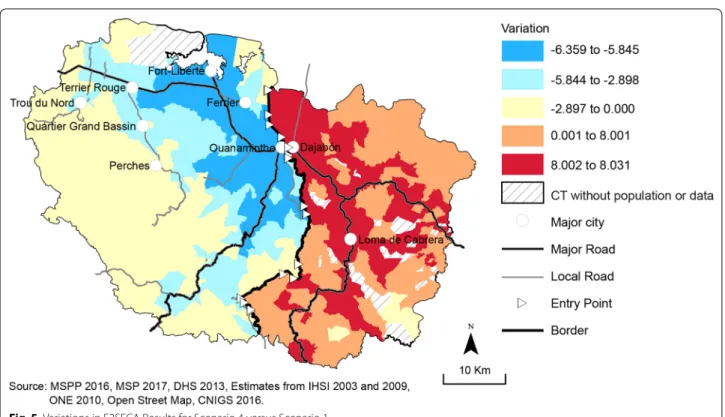
Variation between scenario 4 and scenario 1
Figure 5 shows the variation in the level of spatial acces-sibility between scenario 4 (closed border) and scenario
1 (open border). It highlights the areas most affected by the border’s level of openness. As shown in Fig. 5, the solid blue areas are those that benefit from an open bor-der. The red ones are those gaining better access when the border is closed. The border has almost no impact on an extended territory (pale yellow) of the North-East Department where the variation differences are negative but close to zero.
In both countries, the areas next to the border are those that are more sensitive to the impact of the border on
their level of spatial accessibility. Those areas are the ones where an open border induces an increased demand from Haitians at the Dominican health services located near the border (within the 15–45 min travel zone). It is also important to note the importance of the road network in the border effect, as the pattern is aligned with the main road network. For example, borderland areas (southern part of the North-East Department in Haiti) covered with pathways and with geographic constraints don’t benefit at
the same level as those with a good road network cover-age. A similar sensibility pattern is observed in the Prov-ince of Dajabón.
Results of nonparametric test and regression models
To explore differences (location and scale) and vari-ation in the E2SFCA results for each country, we con-duct a nonparametric test (Wilcoxon test). Figure 6 shows that, scenarios 2 (mean rank = 283 for Haiti vs
Fig. 5 Variations in E2SFCA Results for Scenario 4 versus Scenario 1
375 for Dominican Republic, z = 6.01, p < 0.0001) to 4 (mean rank = 220 for Haiti, 505 vs Dominican Repub-lic, z = 1.52, p < 0.0001), as well as for the variation (scenario 4–scenario 1) (mean rank = 212 for Haiti vs 522 for Dominican Republic, z = 20.26, p < 0.0001), the results are significant (p < 0.0001), but that is not the case for scenario 1 (mean rank = 320 for Haiti vs 296 for Dominican Republic, z = − 0.17, p = 0.117). It is rel-evant to note: a) the dispersion of the scores for Haiti compared to those for the Dominican Republic; and b) the gap in mean rank between Haiti and the Domini-can Republic for scenario 3 (border half-closed) and scenario 4 (closed border). The variability and disper-sion in the range for Haiti emphasize the disparities within the North-East Department shown in Fig. 4. The results for the variation between an open border and a closed border confirm the impact of the border on the level of spatial accessibility of health care for the Haitian population.
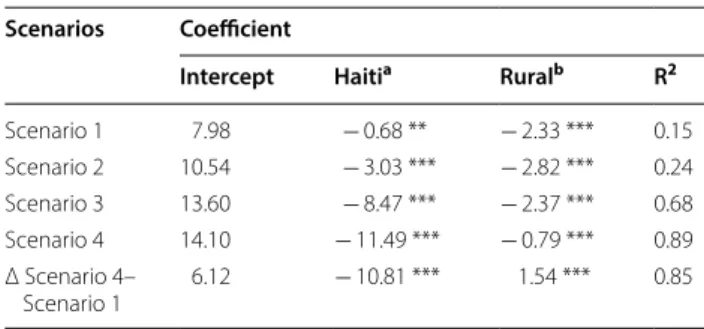
Finally, several linear regression models are con-ducted to predict the accessibility of health services (E2SFCA results) according to the four scenarios and variation between the two extremes. Two independent variables are introduced in these models: Haiti (D.R. is defined as the reference category), and rural area (ver-sus urban area). The results of these models are shown in Table 4.
First, note that R2 increases from 0.15 to 0.89 for sce-narios 1–4. Next, the degree of border openness has a significant impact on accessibility on both sides of the border, to the detriment of Haiti (with increasingly strong negative regression coefficients). Not surprisingly, the coefficients for rural areas confirm that these areas have poorer accessibility, regardless of the scenario. In addi-tion, the positive and significant coefficient for the varia-tion between scenarios 4 and 3 shows that the closure of the border strongly affects accessibility in urban centres that are close to the border.
Discussion
The E2SFCA results and statistical analyses clearly highlight the impact of the border on the potential spa-tial accessibility of public health services for Haitian and Dominican border populations with a peculiar pat-tern caused by the one directional movement assumed for the model. In fact, the simulations carried out show that Haitian populations in areas close to the border line—particularly near an entry point (formal or infor-mal)—and served by a road network in good condition have higher levels of accessibility when the border is open (scenario 1) or semi-closed (scenario 2), with a 30-min penalty. At the same time, an increased demand from Haitians of those specific areas for the Domini-can health services lowers the health professional to population accessibility ratio in Dominican Republic causing striking variations according to the openness of the border. It is therefore interesting to note that, by increasing the cost from 30 to 60 min, the level of accessibility varies widely across the border. Thus, the opening of the border only impacts spatial accessibility for the Haitian population in the vicinity (travel time zones 0–15 min and 15–30 min). These results are not surprising, as these areas have a road network in good condition, confirming the importance of a good road network [4, 82–84] and of the type of distance [78] in potential spatial accessibility. As a result, rural areas are those with the lowest level of accessibility, on the one hand, and, on the other hand, these areas benefit very little from the opening of the border, despite its prox-imity. A weak road network (absence of roads or roads in poor condition) and topographical constraints asso-ciated with a limited offer of services (type of service and number of health professionals) indeed character-ize Haitian rural areas. In Dominican Republic, an open border besides creating as mentioned before a decrease in the level of accessibility generates more disparities within the Province of Dajabón, especially for the pop-ulation at its edges. Introducing a 30 or a 60-min cost for a semi-closed border smoothens the gaps within Dajabón since the Haitians’ demand at the Dominican health services decrease.
Scenario 4 highlights the differences in the potential spatial accessibility of health services between the two countries. These differences clearly underline the health and spatial discontinuities due to the border. The dispari-ties in the spatial accessibility of public health services are very low (or almost non-existent) within the Domini-can territory, in striking contrast with Haiti, where they are high. Those gaps can lead to a one-directional flow like the one assumed by the model. Furthermore, several empirical studies [16, 85, 86] in different border con-texts indicate a pattern of polarized flows because of an
Table 4 Linear regression for E2SFCA (n = 624)
Signif. codes:: *** 0.001, ** 0.01
a Reference: Dominican Republic b Reference: urban
Scenarios Coefficient
Intercept Haitia Ruralb R2
Scenario 1 7.98 − 0.68 ** − 2.33 *** 0.15 Scenario 2 10.54 − 3.03 *** − 2.82 *** 0.24 Scenario 3 13.60 − 8.47 *** − 2.37 *** 0.68 Scenario 4 14.10 − 11.49 *** − 0.79 *** 0.89 Δ Scenario 4– Scenario 1 6.12 − 10.81 *** 1.54 *** 0.85
unsatisfied demand in one side and a more attracted one on the other side. Nevertheless, this push/pull dynamic could have considerable impact on the health services of the recipient country depending on their public health care capacity, the volume of cross-border patients and the borderland context including the level of cooperation or integration of the countries involved. It is worth notic-ing that the challenges for both countries regardnotic-ing those issues are high even more when considering the results of the potential spatial accessibility model.
However, an optimization of the E2SFCA to weight the population according to the real use of health services on both sides of the border would have given a closer insight into the reality of potential spatial accessibility. It would also have been appropriate to assess the impact of the border on potential spatial accessibility by integrat-ing socioeconomic and demographic factors to analyze the correlation between population characteristics and cross-border spatial accessibility.
The results also call for better cooperation and inte-gration of the two countries’ health care systems. In this regard, the stakes for Haiti and the Dominican Republic are high, not only because of the instability of relations between the two countries, but also because of the thorny issue of migration. As Alexandre [48] points out, cross-border movements between Haiti and the Dominican Republic, including movements linked to health, cannot be thought of without considering a reform of the migra-tion legislamigra-tion in both countries.
Conclusion
The results emphasize the impact of a good road network on the spatial accessibility of health care, as discussed in many studies. They also show the impact of the openness of an international border on the potential accessibil-ity of health care in borderland regions, highlighting the importance of distance. Proximity is thus seen as one of the determinants in cross-border mobility and in health care seeking behavior. But other factors such as the attractiveness (quality, cost) of health care services must be considered to analyze individuals’ behaviors. In our research, we also assume that all the Haitian population of the North-East Department would potentially choose to cross the border, but this is not actually the case. An optimization of the model would make it possible to bet-ter evaluate the impact of the border and to obtain more robust results, with a better appreciation of the reality of the situation. A gender-oriented analysis could also have been of interest considering, inter alia, the high maternal mortality rate in Haiti and the high number of unassisted deliveries, particularly in the rural Haitian areas.
The study also highlights the need for more research so as to better understand the determinants of cross-border
health care use. Moreover, the distance thresholds are arbitrary and do not necessarily reflect specific patients’ behavior, suggesting the need for qualitative inquiry to assess the therapeutic. In-depth interviews and surveys could therefore offer an insight into revealed spatial access and lead to a better understanding of patients’ behavior and how this is related to their practices around the border.
Furthermore, cross-border movements in health are part of bigger issues. They should be addressed not only in shrinking the gaps in health access resources but also in creating the needed legal and institutional environ-ment for them to develop smoothly.
Authors’ contributions
DM is the principal investigator of the study. She carried out the GIS, statistical and mapping analyses. PA revised all the statistical and mapping analyses. PA and UL jointly drafted and critically revised the paper. All authors read and approved the final manuscript.
Author details
1 Environmental Equity Laboratory, INRS Centre Urbanisation Culture Société,
385, rue Sherbrooke Est, Montréal, Québec H2X 1E3, Canada. 2 Département
d’études urbaines et touristiques, Université du Québec à Montréal, Case post-ale 8888, Succurspost-ale Centre-Ville, Montréal, Québec H3C 3P8, Canada.
Acknowledgements
The authors would like to thank the anonymous reviewers for their care-ful reading of our manuscript and their many insightcare-ful comments and suggestions.
Competing interests
The author(s) declare that they have no competing interests.
Availability of data and materials
Please contact author for data requests.
Consent for publication
The authors provide full consent for publishing the manuscript.
Ethics approval and consent to participate
Not applicable.
Funding
The authors are grateful for the financial support provided by the Canada Research Chair in Environmental Equity.
Publisher’s Note
Springer Nature remains neutral with regard to jurisdictional claims in pub-lished maps and institutional affiliations.
Received: 11 August 2018 Accepted: 18 October 2018
References
1. Perry B, Gesler W. Physical access to primary health care in Andean Bolivia. Soc Sci Med. 2000;50(9):1177–88.
2. Rushton G. Use of location-allocation models for improving the geo-graphical accessibility of rural services in developing countries. Int Reg Sci Rev. 1984;9(3):217–40.
3. Tanser F, Gijsbertsen B, Herbst K. Modelling and understanding primary health care accessibility and utilization in rural South Africa: an exploration using a geographical information system. Soc Sci Med. 2006;63(3):691–705.
4. Rosero-Bixby L. Spatial access to health care in Costa Rica and its equity: a GIS-based study. Soc Sci Med. 2004;58(7):1271–84. 5. Barnes-Josiah D, Myntti C, Augustin A. The “three delays” as a
framework for examining maternal mortality in Haiti. Soc Sci Med. 1998;46(8):981–93.
6. Schoeps A, Gabrysch S, Niamba L, Sié A, Becher H. The effect of distance to health-care facilities on childhood mortality in rural Burkina Faso. Am J Epidemiol. 2011;173(5):492–8.
7. Luo W, Wang F. Measures of spatial accessibility to health care in a GIS environment: synthesis and a case study in the Chicago region. Environ Plan. 2003;30(6):865–84.
8. Pan J, Liu H, Wang X, Xie H, Delamater PL. Assessing the spatial acces-sibility of hospital care in Sichuan Province, China. Geospatial Health. 2015;10(2):261–70.
9. Luo W. Using a GIS-based floating catchment method to assess areas with shortage of physicians. Health Place. 2004;10(1):1–11.
10. Luo W, Qi Y. An enhanced two-step floating catchment area (E2SFCA) method for measuring spatial accessibility to primary care physicians. Health Place. 2009;15(4):1100–7.
11. Glinos I, Baeten R: A literature review of cross-border patient mobility in the European Union. In: Observatoire social européen, Europe for patients; 2006. p. 115.
12. Glinos I, Baeten R, Helble M, Maarse H. A typology of cross-border patient mobility. Health Place. 2010;16(6):1145–55.
13. Glinos IA, Doering N, Maarse H. Travelling home for treatment and EU patients’ rights to care abroad: results of a survey among German stu-dents at Maastricht University. Health Policy. 2012;105(1):38–45. 14. Bochaton A. Cross-border mobility and social networks: Laotians seeking
medical treatment along the Thai border. Soc Sci Med. 2015;124:364–73. 15. Bochaton A: La construction de l’espace transfrontalier lao-thaïlandais.
Une analyse à travers le recours aux soins. Espace populations sociétés Space populations societies. 2011;(2011/2):337–351.
16. Dione I: Polarisation des structures de soins de la Haute Casamance: entre construction nationale des systèmes de santé et recours aux soins transfrontalier. Université d’Angers; 2013.
17. Brown HS. Do Mexican immigrants substitute health care in Mexico for health insurance in the United States? The role of distance. Soc Sci Med. 2008;67(12):2036–42.
18. Grossman D, Garcia SG, Kingston J, Schweikert S. Mexican Women Seek-ing Safe Abortion Services in San Diego, California. Health Care Women Int. 2012;33(11):1060–9.
19. Guendelman S. Health care users residing on the Mexican border what factors determine choice of the U.S. or Mexican Health System? Medical Care. 1991;29(5):419–29.
20. Guendelman S, Jasis M. Giving birth across the border: the San Diego-Tijuana connection. Soc Sci Med. 1992;34(4):419–25.
21. Horton S, Cole S. Medical returns: seeking health care in Mexico. Soc Sci Med. 2011;72(11):1846–52.
22. Laugesen MJ, Vargas-Bustamante A. A patient mobility framework that travels: European and United States-Mexican comparisons. Health Policy. 2010;97(2–3):225–31.
23. Su D, Richardson C, Wen M, Pagán JA. Cross-Border Utilization of Health Care: evidence from a Population-Based Study in South Texas. Health Serv Res. 2011;46(3):859–76.
24. Peiter PC: Condiciones de vida, situación de salud y disponibilidad de servicios de salud en la frontera de Brasil: un enfoque geográfico. Cád Saúde Pública; 2007.
25. De Ruffray S, Hamez G. L’accessibilité transfrontalière aux maternités: Enjeux territoriaux d’une coopération sanitaire dans la Grande Région. In: Moullé F, Duhamel S, editors. Frontières et santé: Genèses et maillages des réseaux transfrontaliers. Paris: L’Harmattan; 2010.
26. Perez S, Balli A: L’accessibilité aux soins dans l’espace frontalier des Alpes du Sud. In: Frontières et santé: genèses et maillages des réseaux trans-frontaliers. Paris: L’Harmattan; 2010.
27. Arbaret-Schulz C, Beyer A, Piermay J-L, Reitel B, Selimanovski C, Sohn C, Zander P: La frontière, un objet spatial en mutation. EspacesTemps net. 2004; 29(04).
28. Piermay J-L, Reitel B, Zander P: Introduction. In: Reitel B, editor. Villes et frontières, vol. Collections: Collection Villes (Paris, France). Paris: Paris: Anthropos: Economica; 2002. p. 2–9.
29. Herzog LA. The transfrontier organization of space along the US-Mexico border. Geoforum. 1991;22(3):255–69.
30. Herzog LA, Sohn C. The cross-border metropolis in a global age: a conceptual model and empirical evidence from the US–Mexico and European border regions. Glob Soc. 2014;28(4):441–61.
31. Anderson J, O’Dowd L. Borders, border regions and territoriality: contra-dictory meanings, changing significance. Reg Stud. 1999;33(7):593–604. 32. Paasi A. Borders and border-crossings. In: Johnson NC, Schein RH,
Wind-ers J, editors. Cultural geography. Chichester: Wiley; 2013. p. 478–93. 33. Penchansky R, Thomas JW. The concept of access. Definition and
relation-ship to consumer satisfaction. Med Care. 1981;19:127–40.
34. Wang F. Quantitative methods and applications in GIS. London: Taylor & Francis Group; 2006.
35. Guagliardo MF. Spatial accessibility of primary care: concepts, methods and challenges. Int J Health Geogr. 2004;3:3.
36. Théodat J-M. Haïti-République Dominicaine: une île pour deux, 1804–1916. Paris: Éditions Karthala; 2003.
37. Théodat J-M, Mathon D, Mathelier R, Casséus M. Quisqueya: un papillon d’envol. In: Mathelier R, Mathon D, Casséus M, editors. Entreprise, Territoire et Développement: Compilation 2002–2003. Port-au-Prince: INESA/Le Nouvelliste; 2003.
38. Wooding B, Mosely-Williams R, Flores C. Les immigrants haïtiens et leurs descendants en République Dominicaine. Haïti: Institut catholique pour les relations internationles, ISPOS; 2005.
39. Silié R. Haïti et la République dominicaine, pays en conflit ou en construc-tion d’une nouvelle amitié? Conjoncconstruc-tion La revue franco-haïtienne de l’Institut Français d’Haïti. 2014;2226:98–110.
40. Dilla Alfonso H, Alexis S, Antoine MI, Carmona C, de Jesús Cedano S, Mur-ray GF, Espejo JEN, O’neil DJ, Rapilly M, Sánchez N: La frontera dominico-haitiana: Grupo de Estudios Multidisciplinarios Ciudades y Fronteras; 2010.
41. Redon M. Frontière poreuse, État faible: les relations Haïti/République dominicaine à l’aune de la frontière. Bulletin de l’Association de géog-raphes français. 2010;87:308–23.
42. Petrozziello AJ, Wooding B: Fanm nan Fwontyè, Fanm toupatou: Éclairage sur la violence exercée sur les Immigrantes d’origine haïtienne, celles en transit migratoire et sur les déplacés internes le long de la frontière Dominicano-Haïtienne. Santo Domingo: Colectiva Mujer y Salud, Mujeres del Mundo, Observatoire sur la migration et la Caraïbe; 2011.
43. Jolivet V. Les Haïtiens à Santo Domingo: une masse invisible? Bulletin de l’Association de géographes français. 2010;87:324–35.
44. Wooding B. Women fight for their safety in the Dominican-Haitian border. Migr Dev. 2012;10(18):37–58.
45. Murray GF: Sources of Conflict along and across the Haitian–Dominican border. In: Fwontyè nou—Nuestra Frontera. Santo Domingo Dominican Republic: Pan American Development Foundation; 2010.
46. Montiel Armas I, Canales Cerón AI, Vargas Becerra PN: Migración y salud en zonas fronterizas: Haití y la República Dominicana: CEPAL; 2010. 47. Ministerio del Trabajo, Observatorio del Mercado Laboral Dominicano:
Inmigrantes Haitianos y Mercado Laboral, Estudio Sobre los Trabajadores de la Construcción y de la Producción del Guineo en la República Dominicana. In: República Dominicana: Ministerio del Trabajo; 2011. 48. Alexandre G. Vers une gestion ordonnée de la migration entre la
Répub-lique dominicaine et Haïti. Conjonction La revue franco-haïtienne de l’Institut Français d’Haïti. Les realtions Haïti—République dominicaine. 2014;226:132–56.
49. Oficina Nacional de Estadística: Primera Encuesta Nacional de Inmi-grantes en la República Dominicana (ENI-2012). In: Santo Domingo, República Dominicana: Oficina Nacional de Estadística; 2013. p. 345. 50. Oficina Nacional de Estadistica: Segunda Encuesta Nacional de
Inmi-grantes en la República Dominicana—ENI-2017—Version resumida del informe general. In: Santo Domingo: Oficina Nacional de Estadistica; 2018.
51. Silié R, Segura C, Dore Cabral C. La nueva inmigración haitiana. Santo Domingo: Flacso; 2002.
52. Organización Panamericana de la Salud: Haití. In: Salud OPdl, editor. Salud en las Américas, Edición de 2012: Volumen de países. Washington: Organización Panamericana de la Salud; 2012.
53. Organización Panamericana de la Salud: República Dominicana In. vol. Salud en las Américas. Edición 2012: Volumen de países. Washington: Organización Panamericana de la Salud; 2012.
•fast, convenient online submission
•
thorough peer review by experienced researchers in your field
• rapid publication on acceptance
• support for research data, including large and complex data types
•
gold Open Access which fosters wider collaboration and increased citations maximum visibility for your research: over 100M website views per year
•
At BMC, research is always in progress. Learn more biomedcentral.com/submissions
Ready to submit your research? Choose BMC and benefit from:
54. Lavigne M, Vargas LH: Sistemas de protección social en América Latina y el Caribe: República Dominicana. In: (CEPAL) CEpALyeC, editor.
Docu-mento de Proyecto. . Santiago de Chile: Comisión Económica para América
Latina y el Caribe (CEPAL); 2013. p. 40.
55. Cercone JA. Análisis de situación y estado de los sistemas de salud de países del Caribe, vol. 185. Santiago de Chile: United Nations Publications; 2007.
56. Secretaría de Estado de Salud Pública y Asistencia Social: Modelos de Red de los Servicios Regionales de Salud. In: Social SdEdSPyA, editor. 1a edición edn. Santo Domingo: Secretaría de Estado de Salud Pública y Asistencia Social; 2005. p. 199.
57. Ministère de la santé publique et de la population: Politique Nationale de Santé. In: Edited by population Mdlspedl. Port-au-Prince; 2012.
58. Bitrán R: Reformas recientes en el sector salud en Centroamérica, vol. 177: United Nations Publications; 2006.
59. Ministerio de Salud Pública: Modelo de atención en salud en el sistema nacional de salud de la República Dominicana. In: (DDEI) DdDEI, editor. vol. 3. Santo Domingo: Ministerio de Salud Pública; 2012.
60. Institut Haïtien de l’Enfance, ICF International: Évaluation de Presta-tion des Services de Soins de Santé, Haïti, 2013. In: Rockville Maryland: Ministère de la Santé Publique et de la Population (MSPP); 2014. 61. Cayemittes M, Busangu MF, Bizimana JdD, Barrère B, Sévère B, Cayemittes
V, Charles E: Enquête Mortalité, Morbidité et Utilisation des Services, Haïti, 2012. In: Haiti: MSPP, IHE et ICF International; 2013.
62. Lamaute-Brisson N: Sistemas de protección social en América Latina y el Caribe: Haití. In: (CEPAL) CEpALyeC, editor. Documento de Proyecto. Santiago de Chile: Comisión Económica para América Latina y el Caribe (CEPAL); 2013. p. 40.
63. Secretaría de Estado de Salud Pública y Asistencia Social: Manual de Sectorización/Zonificación de las UNAP. In Salud CEplRdS, editor. Santo Domingo: Secretaría de Estado de Salud Pública y Asistencia Social; 2008. p. 78.
64. Secretaría de Estado de Salud Pública y Asistencia Social: Perfil del sis-tema de salud de la República dominicana. In: Salud SdEdSPyASCEplRdS, editor. Santo Domingo: Secretaría de Estado de Salud Pública y Asistencia Social/Comisión Ejecutiva para la Reforma del Sector Salud/Organización Panamericana de la Salud; 2007. p. 44.
65. Ministère de la santé publique et de la population: Plan directeur de santé 2012–2022. In: population Mdlspedl, editor. Port-au-Prince; 2013. 66. Wooding B. El impacto del terremoto en Haití sobre la inmigración
haiti-ana en república dominichaiti-ana. América Latina Hoy. 2010;56:111–29. 67. Organización Panamericana de la Salud: Cooperación binacional entre
Haití y la República Dominicana. In: Salud OPdl, editor. Organización Panamericana de la Salud; 2011.
68. Dilla Alfonso H. Transborder Urban Complex in Latin America. Estudios Fronterizos. 2015;16(31):4–19.
69. Dilla Alfonso H. Los complejos urbanos transfronterizos en América Latina. Estudios fronterizos. 2015;16(31):15–38.
70. Dilla Alfonso H, de Jesús Cedano S. De problemas y oportunidades: inter-mediación urbana fronteriza en República Dominicana. Revista mexicana de sociología. 2005;67:99–126.
71. Buzenot L: Les zones franches industrielles d’exportation dans la Caraïbe. Les causes économiques de leur émergence. Études Caribéennes 2010(13).
72. INESA, FLACSO: Inventario de los conocimientos e intervenciones sobre la zona transfronteriza Haití-República Dominicana. In: Santo Domingo/ Haití: PNUD/ACDI; 2003.
73. Observatorio Binacional sobre Medio Ambiente M, Educación y Comer-cio,: Diagnóstico comercio bilateral República Dominicana y República de Haitï. In. República Dominicana/Haiti: Observatorio Binacional sobre Medio Ambiente, Migración, Educación y Comercio (OBMEC); 2016. 74. Dilla Alfonso H. República Dominicana: La nueva cartografía
transfron-teriza. Caribbean Studies. 2007;35(1):181–205.
75. Dilla Alfonso H: La migración transfronteriza urbana en la República Dominicana. In: Santo Domingo: Fundación Friedrich Ebert en República Dominicana; 2011.
76. Icart J-C. Cela ne se fait pas! Développements récents dans le dossier des migrations et de l’apatridie en République dominicaine. Conjonction La revue franco-haïtienne de l’Institut Français d’Haïti. 2014;226:160–82. 77. Higgs G. A literature review of the use of GIS-based measures of
access to health care services. Health Serv Outcomes Res Methodol. 2004;5(2):119–39.
78. Apparicio P, Gelb J, Dubé A-S, Kingham S, Gauvin L, Robitaille É. The approaches to measuring the potential spatial access to urban health services revisited: distance types and aggregation-error issues. Int J Health Geogr. 2017;16(1):32.
79. McGrail MR, Humphreys JS. Measuring spatial accessibility to primary care in rural areas: improving the effectiveness of the two-step floating catchment area method. Appl Geogr. 2009;29(4):533–41.
80. Luo W, Wang F. Measures of spatial accessibility to health care in a GIS environment: synthesis and a case study in the Chicago region. Environ Plan B Plan Des. 2003;30:865–84.
81. Wan N, Zou B, Sternberg T. A three-step floating catchment area method for analyzing spatial access to health services. Int J Geogr Inf Sci. 2012;26(6):1073–89.
82. Oppong JR, Hodgson MJ. Spatial accessibility to health care facilities in Suhum District, Ghana. Prof Geogr. 1994;46(2):199–209.
83. Murawski L, Church RL. Improving accessibility to rural health services: the maximal covering network improvement problem. Socio-Econ Plan Sci. 2009;43(2):102–10.
84. Querriau X, Peeters D, Thomas I, Kissiyar M: Localisation optimale d’unités de soins dans un pays en voie de développement: Analyse de sensibilité. CyberGeo. 2004.
85. Bochaton A: “ Paï Thaï, paï fang nan”:” Aller en Thaïlande, aller de l’autre côté”. Construction d’un espace sanitaire transfrontalier: le recours aux soins des Laotiens en Thaïlande. Paris 10; 2009.
86. Tapia Ladino M, Liberona Concha N, Contreras Gatica Y. El surgimiento de un territorio circulatorio en la frontera chileno-peruana: estudio de las prácticas socio-espaciales fronterizas. Revista de Geografía Norte Grande. 2017;66:117–41.