HAL Id: tel-03209840
https://pastel.archives-ouvertes.fr/tel-03209840
Submitted on 27 Apr 2021
HAL is a multi-disciplinary open access archive for the deposit and dissemination of sci-entific research documents, whether they are pub-lished or not. The documents may come from teaching and research institutions in France or abroad, or from public or private research centers.
L’archive ouverte pluridisciplinaire HAL, est destinée au dépôt et à la diffusion de documents scientifiques de niveau recherche, publiés ou non, émanant des établissements d’enseignement et de recherche français ou étrangers, des laboratoires publics ou privés.
Detection of minor compounds in food powder using
near infrared hyperspectral imaging
Antoine Laborde
To cite this version:
Antoine Laborde. Detection of minor compounds in food powder using near infrared hyperspectral imaging. Analytical chemistry. Université Paris-Saclay, 2020. English. �NNT : 2020UPASB017�. �tel-03209840�
Detection of minor compounds in
food powder using near infrared
hyperspectral imaging
Thèse de doctorat de l'université Paris-Saclay
École doctorale n° 581 : agriculture, alimentation, biologie, environnement et santé (ABIES)Spécialité de doctorat: Chimie Analytique Unité de recherche : Université Paris-Saclay, AgroParisTech, INRAE, UMR PNCA, 75005, Paris, France. Référent : AgroParisTech
Thèse présentée et soutenue à Paris-Saclay,
le 03/12/2020, par
Antoine LABORDE
Composition du Jury
Evelyne VIGNEAU
Professeure, ONIRIS Nantes Présidente
Nathalie DUPUY
Professeure, Université Aix Marseille Rapporteur et Examinatrice
Cyril RUCKEBUSCH
Professeur, Université Lille 1 Rapporteur et Examinateur
Sílvia MAS GARCÍA
Chargée de recherche, INRAE – Centre Occitanie-Montpellier Examinatrice
Dalila AZZOUT-MARNICHE
Professeure, AgroParisTech Examinatrice
Christophe CORDELLA
Ingénieur de recherche (HDR), INRAE – Centre IdF-Versailles-Grignon Directeur de thèse
Benoît JAILLAIS
Ingénieur de recherche, INRAE – Centre Pays de la Loire Co-Encadrant et Examinateur
Anna DE JUAN
Associate Professor, University of Barcelona Invitée
Jean-Michel ROGER
Directeur de Recherche, INRAE – Centre Occitanie-Montpellier Invité
Douglas N. RUTLEDGE
Professeur émérite, AgroParisTech Invité
Th
èse d
e d
oct
or
at
NNT : 20 20 UP AS B01 7Remerciements
Je tiens à remercier l’ensemble de l’équipe m’ayant encadré pendant ces trois années de thèse aussi bien pour leur confiance accordée, leur soutien et leurs encouragements. En particulier mon directeur de thèse Christophe Cordella, mon encadrant Benoît Jaillais qui m’a accueilli à Nantes pour des séjours enrichissants et agréables, ainsi que mes co-encadrants Delphine Jouan-Rimbaud Bouveresse et Luc Eveleigh qui ont su être disponibles lorsque j’en avais besoin. Je remercie aussi particulièrement Dominique Bertrand donc j’ai beaucoup apprécié l’aide et les conseils. Je souhaite aussi grandement remercier Jean-Michel Roger pour son accueil et ses précieux conseils dans cette aventure. Je suis aussi très reconnaissant de l’aide et de l’accueil de l’équipe de Montpellier : Ryad Bendoula, Maxime Metz et Sílvia Mas García.
Je n’oublie pas ma visite très agréable au CRA-W de Gembloux où j’ai été très bien accueilli par Juan Antonio Fernández Pierna et Vincent Baeten.
Je remercie également Francesc Puíg-Castellví pour le travail réalisé ensemble, les discussions et l’aide apportée ainsi qu’Olivier Chapleur et Laetitia Cardona pour leurs conseils.
Je souhaite aussi remercier les personnes et entités ayant rendu ce projet possible malgré le déroulement de certains évènements. Je souhaite remercier les collègues qui m’ont soutenu : Katia et Elina ; Douglas Rutledge avec qui cette thèse a été initiée ; et Alexandre Péry ainsi que l’école doctorale qui m’ont soutenu dans la gestion de ce projet.
Enfin je voudrais remercier les membres du jury qui ont accepté d’évaluer mon travail. Je remercie mes deux rapporteurs Nathalie Dupuy et Cyril Ruckebusch, mes examinateurs Evelyne Vigneau, Sílvia Mas García, Dalila Azzout-Marniche ainsi que mes invités Douglas Rutledge et Anna De Juan.
Acronyms
AMSD adaptive matched subspace detector CSEL concentration selectivity
EM expectation maximization
GLR generalized likelihood ratio
GMM Gaussian mixture model
HSI hyperspectral imaging
ICA independent component analysis
LMM linear mixing model
MCR-ALS multivariate curve resolution alternating least-squares
MIR mid-infrared
MLE maximum likelihood estimator MLR multivariate linear regression
MSD matched subspace detector
MVSA minimum volume simplex analysis
NIR near-infrared
NIRS near-infrared spectroscopy
NIR HSI near-infrared hyperspectral imaging NMF non negative matrix factorization OLS ordinary least-squares
PC principal component
PCA principal component analysis
PLA polylactic acid
PLS partial least-squares
PLSDA partial least-squares discriminant analysis RTE radiative transfer equation
RMSE root mean square error
RMSECV root mean square error of cross-validation SNR signal to noise ratio
SNV standard normal variate SRS spatially resolved spectroscopy SVD singular value decomposition VNIR visible near-infrared
Notations
Physics
𝐼 intensity of an electromagnetic wave
𝜆 wavelength of an electromagnetic wave
𝑅 reflectance
𝐾 absorbance coefficient for the Kubelka-Munk theory
𝑆 scattering coefficient for the Kubelka-Munk theory
Chemometrics
General notations
𝑛 number of spectral measurements
𝑚 number of wavelengths in spectral data
𝑘 number of spectral constituents
𝒙 a spectrum vector
𝐗 a matrix containing one spectrum for each row
𝐏 loading matrix of Principal Component Analysis
𝐓 score matrix of Principal Component Analysis
𝒘 model residuals 𝐈 identity matrix 𝒩 Normal distribution 𝑃 probability 𝝁 mean vector 𝚺 covariance matrix
𝝎 Gaussian mixture weights
𝑀 number of Gaussians in the Gaussian Mixture Model
Matched Subspace Detector
𝒔 spectral component
𝒂 spectral contribution
𝐿 number of components in the model of the regular sample
𝐽 number of components in the model of the adulterant sample
𝐌 matrix containing the spectral components
𝑐 simulated concentration of standard sample
𝒙
̃ simulated spectrum
𝐓̃ simulated score matrix
Multivariate Curve Resolution Alternating Least-Squares
𝐂 concentration profile matrix, vector
𝐒 spectral profile matrix, vector
Table of contents
REMERCIEMENTS ... 2
ACRONYMS ... 3
NOTATIONS ... 4
INTRODUCTION ... 8
1. CONTEXT AND OBJECTIVES ... 8
2. STRUCTURE OF THE MANUSCRIPT ... 8
A. Main contributions ... 9
B. List of the published works ... 9
C. List of communications ... 10
3. THE INTEREST OF POWDER IN THE FOOD INDUSTRY ... 11
4. NEAR-INFRARED SPECTROSCOPY ... 11
5. NEAR-INFRARED HYPERSPECTRAL IMAGING... 12
D. Physical contaminations ... 13
E. Defects ... 13
F. Microbiological contaminations ... 14
6. THE PENETRATION AND THE DETECTION DEPTH OF NIR RADIATIONS... 14
A. The penetration depth ... 14
B. The detection depth ... 16
7. THE DETECTION OF SUBPIXEL FOOD PARTICLES ... 18
A. Classification algorithms ... 19
B. Spectral similarities ... 19
C. Quantification methods... 19
D. Unmixing methods... 20
E. Subspace detector ... 26
I. THE DETECTION DEPTH OF A NEAR-INFRARED HYPERSPECTRAL IMAGING SYSTEM ... 29
1. INTRODUCTION ... 29
2. MATERIAL AND METHODS ... 31
A. Samples ... 31
B. Hyperspectral imaging system ... 32
C. Data processing ... 32
D. Thickness target values... 33
E. Reflectance profile extraction ... 33
F. Partial Least-Squares Regression ... 34
3. RESULTS AND DISCUSSIONS... 35
A. Reflectance evolution for each wavelength ... 35
B. Physical interpretation ... 36
C. Determination of the penetration depth ... 38
D. Partial Least-Squares regression results ... 40
4. ADDITIONAL DISCUSSIONS ... 43
A. The detection depth versus the penetration depth ... 43
B. The effective detection depth ... 44
C. The consequences of the detection depth ... 45
D. The parameters influencing the detection depth ... 46
5. CONCLUSION AND PERSPECTIVES ... 48
II. THE DETECTION OF PEANUT FLOUR USING THE MATCHED SUBSPACE DETECTOR ... 50
2. MATERIAL AND METHODS ... 52
A. Samples ... 52
B. Hyperspectral imaging system ... 52
C. Data processing ... 53
D. Spectral simulation using Principal Component Analysis ... 53
E. Detection using the Matched Subspace Detector ... 55
F. Software... 56
3. RESULTS AND DISCUSSIONS... 56
A. Evaluation of data simulation for the detector design ... 56
B. Evaluation of the Matched Subspace Detector Algorithm ... 60
4. CONCLUSIONS ... 64
III. THE DETECTION OF PEANUT FLOUR IN CHOCOLATE POWDER USING MULTIVARIATE CURVE RESOLUTION ... 66
1. INTRODUCTION ... 66
2. MATERIAL AND METHODS ... 67
A. Sample preparation ... 67
B. Hyperspectral imaging system ... 68
C. Data Processing ... 68
D. Hyperspectral cube unfolding ... 68
E. Multivariate Curve Resolution – Alternating Least Squares... 69
F. Detection algorithm... 71
G. Software... 71
3. RESULTS AND DISCUSSIONS... 72
A. Principal Component Analysis ... 72
B. MCR-ALS ... 73
C. MCR-ALS-CSEL ... 76
D. The detection results ... 77
4. ADDITIONAL DISCUSSIONS ... 84
A. The pixel unmixing strategy ... 84
B. The detection sensitivity... 88
C. The particle detection in hyperspectral images... 92
5. CONCLUSION... 96
CONCLUSION AND FUTURE WORK ... 97
1. CONCLUSION... 97
2. FUTURE WORKS ... 98
APPENDICES ... 99
APPENDIX A:THE GAUSSIAN MIXTURE MODEL ... 100
APPENDIX B:THE MAHALANOBIS DISTANCE FOR OUTLIER DETECTION ... 102
REFERENCES ... 103
FIGURE INDEX ... 112
EQUATION INDEX ... 115
TABLE INDEX ... 117
RESUME DE LA THESE PAR CHAPITRE ... 118
INTRODUCTION ... 118
LA PROFONDEUR DE DETECTION D’UN SYSTEME DE MESURE HYPERSPECTRALE PROCHE INFRAROUGE ... 121
Introduction ... 121
Résultats et discussions... 122
Conclusion du premier chapitre ... 122
LA DETECTION DE FARINE DE CACAHUETE PAR DETECTEUR A SOUS-ESPACE ... 123
Introduction ... 123
Matériel et méthodes ... 123
Résultats et discussions... 124
Conclusion du deuxième chapitre ... 124
LA DETECTION DE FARINE DE CACAHUETE DANS LE CHOCOLAT EN POUDRE PAR MULTIVARIATE CURVE RESOLUTION ALTERNATING LEAST-SQUARES ... 124
Introduction ... 124
Matériel et méthodes ... 125
Résultats et discussions... 125
Conclusion du troisième chapitre ... 126
Université Paris-Saclay
Espace Technologique / Immeuble Discovery
Route de l’Orme aux Merisiers RD 128 / 91190 Saint-Aubin, France
Introduction
1. Context and objectives
This thesis was initiated by a collaboration between AgroParisTech and ONIRIS to develop monitoring solutions in the food industry. This thesis focuses on the case of food powder like flours using near-infrared (NIR) hyperspectral imaging (HIS) solutions. This technology that enables to characterize and localize food or chemical compounds in a sample can be used to detect adulteration. Detection of foreign components is a major application for enhancing food safety in the industry. As the chemical interactions between nutrients during food processing may affect their spectral signature, the detection should be done as soon as possible in the process. It means hyperspectral imaging should be applied on raw material such as powders which are intensively used in the food industry. Ce projet de thèse est issu d’une collaboration entre l’AgroParisTech et l’ONIRIS dans le but de développer des solutions de contrôle de procédés de fabrication dans l’industrie agroalimentaire.
However, HSI pixels may be larger than a food particle. In that case, one pixel measures the signal of several particles with different spectral signatures which results in a mixed signal. In addition, food samples are composed of the main nutrients that have similar spectral signatures in the NIR region. Therefore, the detection of foreign particles requires the use of specific chemometrics algorithms. One objective of this work is to propose performant algorithms for the signal analysis of mixed pixels.
NIR radiations can penetrate solid samples at a given distance before being absorbed. Consequently, the NIR spectral signatures of foreign particles can only be detected on a finite depth of raw material. The second objective of this work is to propose a method to assess the detection depth of a measurement system in a food powder.
2. Structure of the manuscript
The first chapter studies a new method to determine the detection depth of a material in a food powder. This method relies on the reflectance profile analysis derived from the Kubelka-Munk theory. An original sample holder is designed and produced using polylactic acid (PLA) which has a typical spectral signature. The design of the sample holder makes the thickness of powder material vary and is measurable using a NIR HSI system. A multivariate method based on the PLS regression is developed to determine the detection depth of the PLA in the powder material. The results are compared with the reflectance profile analysis. This chapter has the same structure as the published article. An additional part is provided to discuss the concept of detection depth.
The second chapter of this manuscript deals with the detection of peanut flour in wheat flour using a NIR HSI system and the MSD. Mixed samples with various
concentration of peanut flours are prepared (from 10 % to 0.02 %) and measured by HSI. The MSD is designed using the measurements of the pure samples. A spectral simulation method is proposed to provide a validation dataset for three MSD designs. The detectors are then applied to the real mixed samples to detect subpixel peanut adulteration in pixels. This chapter has the same structure as the published article.
The third chapter of this manuscript is dedicated to the detection of peanut flour in chocolate powder using the MCR-ALS. The chocolate powder is an industrial mix of cocoa and sugar which is adulterated with peanut flour in various concentration (from 10 % to 0.02 %). The samples are measured using a NIR HSI system. The spectral data of mixed samples are unmixed using MCR-ALS with an augmented matrix strategy and a selectivity constraint. The obtained concentration profiles are then processed by an outlier detection algorithm for detecting pixels adulterated with peanuts. This chapter has the same structure as the published article. An additional part provides a discussion of the unmixing and detection strategies.
A. Main contributions
First chapter
o The design of an original sample holder for the detection depth assessment of powder products.
o The development of a multivariate method for measuring the detection depth on the sample holder.
Second chapter
o The tuning of a MSD algorithm for the detection of peanut in wheat flour. o A method for spectral data simulation used for the MSD design validation.
Third chapter
o The tuning of MCR-ALS with a selectivity constraint for detecting peanut in chocolate powder.
o The combination of an outlier detection algorithm with MCR-ALS.
B. List of the published works
o Laborde, B. Jaillais, R. Bendoula, J. Roger, D. Jouan-Rimbaud Bouveresse, L. Eveleigh, D. Bertrand, A. Boulanger, C.B.Y. Cordella, A partial least squares-based approach to assess the light penetration depth in wheat flour by near infrared
hyperspectral imaging, J. Near Infrared Spectrosc. (2019).
https://doi.org/10.1177/0967033519891594.
o A. Laborde, B. Jaillais, J.M. Roger, M. Metz, D. Jouan-Rimbaud Bouveresse, L. Eveleigh, C.B.Y. Cordella, Subpixel detection of peanut in wheat flour using a matched subspace detector algorithm and near-infrared hyperspectral imaging, Talanta. 216 (2020). https://doi.org/10.1016/j.talanta.2020.120993.
o A. Laborde, F. Puig-Castellví, D. Jouan-Rimbaud Bouveresse, L. Eveleigh, C.B.Y. Cordella, B. Jaillais, Detection of chocolate powder adulteration with peanut using near-infrared hyperspectral imaging and Multivariate Curve Resolution, Food Control. 119 (2021). https://doi.org/10.1016/j.foodcont.2020.107454.
C. List of communications
o A.Laborde, B. Jaillais, A. Boulanger, D. Jouan-Rimbaud Bouveresse, L. Eveleigh, C.B.Y. Cordella, 7th June 2018, Detection of adulteration in powders in agro-industry, Conference on Hyperspectral Imaging in Industry (Graz, Austria). o A. Laborde, R. Bendoula, D. Héran, A. Boulanger, J.M. Roger, B. Jaillais, C.B.Y.
Cordella, 26th September 2018, Improving the scan depth of near-infrared hyperspectral imaging using spatially resolved spectroscopy, 9th Workshop on Hyperspectral Image and Signal Processing: Evolution in Remote Sensing (Amsterdam, Netherlands).
o A.Laborde, B. Jaillais, D. Jouan-Rimbaud Bouveresse, A. Boulanger, C.B.Y. Cordella, 30th January 2019, Subpixel detection of peanut in wheat flour using near infrared hyperspectral imaging, Chimiométrie 2019 (Montpellier, France).
o A. Laborde, A. Boulanger, E. Siurdyban, A. Biloé, B. Jaillais, D. Jouan-Rimbaud Bouveresse, C.B.Y. Cordella, 14th March 2019 , Subpixel detection of peanut in wheat flour using near infrared hyperspectral imaging, 4th Conference on Optical Characterization of Materials (Karlsruhe, Germany). Best paper award.
3. The interest of powder in the food industry
Product stability is a major issue in food industry. Low water content products are usually stable, but for convenience, are often supplied as powder [4]. This product form induces multiple challenges for the food industry like maintaining the functionality of ingredients or preventing segregation of food ingredient mixes and particle stickiness [4]. Since food powders are finally consumed by humans, there is a high importance for preventing contamination with undesirable bio-life forms and chemical components. Contamination is difficult to prevent because of the dust formation which leads to particle settling and sticking onto equipment. The contamination may also happen in different stages of the product making and/or between several recipes, and could become a sanitary problem when considering food allergens.
The food allergy is defined as “an adverse health effect arising from a specific immune response that occurs reproducibly on exposure to a given food. [5]”. It is a worrisome public health problem as it is responsible for 200 deaths per year in the United States [6]. Adult food allergy represents a population of 3.7 % in United States and 3.2 % in France [7]. In addition, the prevalence may be on the rise worldwide [8]. Some common foods with an allergen power are frequently used in the industry like wheat, egg, peanut, or milk and may have hazardous effects on the consumer [6]. For these reasons, the contamination of products by food allergens is highly probable and the industry tries to avoid it.
Pulverulent agri-food products are subject to numerous analyses, for example to control mixing and homogeneity [4]. In such cases, the presence of minor compounds often poses a problem. Firstly because they can be difficult to detect. This is the case of food contamination or food ingredients consciously added in low quantity in the mixture. Secondly, because the repartition of such ingredients has to be homogeneous. For this purpose, precise information about the chemical nature of particles and their position in the sample must be known to quantify the homogeneity. During the last decades, the near-infrared spectroscopy (NIRS) has been widely used to assess these features. Near infrared hyperspectral imaging (NIR HSI) has been recently applied and considered as a promising tool to analyze food samples. This technology enables to measure the spectrum of tiny localized areas on the sample and characterize it with more precision.
4. Near-infrared spectroscopy
The NIR spectroscopy (NIRS) studies the interaction of light radiations with the matter in the range between 780 nm and 2 500 nm [9]. When absorbed, these radiations make the molecules vibrate and produce a NIR spectrum. The type of vibration determines the wavelength at which a spectrum absorbs energy. The amplitude of absorption is described by the Beer Lambert’s law and depends on the absorptivity of the molecule, its concentration in the sample and the radiation’s pathlength. Figure 1 represents the
spectrum (A) as a consequence of the periodic stretching (C) of the methyl group. An incident light beam of intensity I0 is directed towards two samples of varying concentration in methyl group (B). The intensity I2 that goes out from the most concentrated sample is weaker than the other I1 because of the molecule absorption.
Figure 1: (A) Two absorbance spectra with an two absorption levels; (B) the sample concentration affecting the absorbance spectrum (C) and the methyl symmetrical stretching of vs CH3.
Chemical bonds such as C = O, C – H, and N – H are the most active from the infrared point of view. They are present in organic compounds and, consequently, in food. Many advantages explain why this technology has been widely used in several fields like pharmaceutical field, petrochemistry, medicine, earth observation or environment. In particular, the use of NIR spectroscopy requires less sample preparation than other spectroscopic techniques.
5. Near-infrared hyperspectral imaging
NIR HSI consists of combining NIR spectroscopy and conventional imaging. This technology can be seen as an extension of RGB imaging by providing hundreds of spectral channels [1]. For each measured pixel, a complete NIR spectrum is acquired.
Especially, NIR HSI provides a spatialized and resolved NIR measurement of entire samples. The pixels of an HSI system have a field of view of 0.2 0.2 mm depending on the type of objective [2]. It considerably increases the chance to isolate a single chemical in one NIR measurement compared to conventional spectroscopy.
NIR HSI for food quality and safety inspection was proposed at the end of the 90s thanks to the advances in computer technologies [3]. Multiple measurement methods were used such as reflectance, transmittance or fluorescence and various wavelength ranges: Visible Near-Infrared (Vis-NIR), 400 – 1000 nm; NIR, 900 – 1700 nm; and Short Wave Infrared (SWIR), 1000 nm – 2500 nm [1]. The applications of NIR HSI in food safety are presented in three categories inspired by the classification provided by Feng and Sun [4].
D. Physical contaminations
Physical contaminations in food correspond to the presence of foreign materials in a product. They should be avoided to prevent hazardous effects for the consumers.
Hyperspectral imaging was intensively used to detect foreign materials in food matrices in the 2010s. In 2011, Bhuvaneswari et al. demonstrated the use of NIR HSI for detecting insect fragments in semolina [9]. Melamine and cyanuric acid contamination in soybean were investigated using NIR HSI by Fernández Pierna et al. in 2014 following the scandal of contaminated milk in China. Many other studies tackled the detection of melamine in milk powder using various chemometrics methods [10-13]. In 2015, Mishra et al. showed the detection of peanut particles in wheat flour using Principal Component Analysis (PCA) and Independent Component Analysis (ICA) [14-15] Later in 2018, Zhao et al. studied the detection of peanut and walnut powders in wheat flour using a Partial Least Squares (PLS) regression in NIR hyperspectral images [16]. These studies show the interest in detecting food allergen like nuts in raw materials and illustrated the capacity of NIR HSI for its detection. More recently, detecting foreign materials as bone fragments in chicken and microplastics in fish was demonstrated using NIR HSI [17-18].
E. Defects
Besides detecting foreign materials, NIR HSI was used to characterize food samples to detect their defects characterized by chemical changes.
Many applications of defects detection on fruits were demonstrated in the 2010s using Vis-NIR HSI. As an example, Gowen et al. showed the identification of mushrooms subjected to freeze damage using PCA and Linear Discriminant Analysis [19]. Apples were subject to numerous analyses using Vis-NIR HSI for detecting bruises, black pox or bitter pits [4]. More recently, Li et al. used Vis-NIR HSI for detecting skin defects on peaches showing this measurement method is still investigated for studying fruit defects [20]. Singh et al. used NIR HSI for studying insect-damaged wheat kernels [21].
This kind of applications consists of detection chemical modifications in a localized area of a sample. As such, it can be compared to the detection of contaminants in powder samples.
F. Microbiological contaminations
Hyperspectral imaging was used for bacterial determination in various studies tackling the freshness of fish and meat. Grau et al. studied the meat freshness on chicken breasts using SWIR HSI [22]. Fish freshness was also investigated and showed various model performances according to the measured portion of the sample [4].
Contamination of crops by fungi is another type of microbiological contamination that was studied using hyperspectral imaging. Jin et al. showed the potential of HSI for detecting toxigenic strains of fungi [23]. Later, Del Fiore et al. and Williams et al. both showed the potential of using HSI for detecting fungal contamination in maize kernels [24-25].
The detection of fecal contamination on food surfaces was one of the first applications in food safety at the beginning of the 2000s. Park and Lawrence developed a Vis-NIR HSI system for detecting feces and ingesta on poultry carcasses using a band ratio method [5]. This work was followed by other studies showing the possibility of implementing such a solution for the food industry [6]. Fecal contamination was also investigated using hyperspectral fluorescence imaging on leafy greens and apples [7] [8].
6. The penetration and the detection depth of NIR radiations
A. The penetration depth
The main theories of light scattering and absorption were established in the past century. The Radiative Transfer Equation (RTE) is the most general equation that describes the variation in intensity of an incident radiation when passing through an absorbing and scattering element [26]. Chandrasekhar proposed a solution in the case of two plane-parallel layers [27]. In practice, such calculations are not easily transposable to practical cases. Instead, other more straightforward solutions were proposed and known as the methods with one (Beer-Lambert) or two (Kubelka-Munk) fluxes.
The Kubelka-Munk theory is based on a model developed by Schuster in 1905 [28]. The goal was to simplify the RTE by proposing a two-fluxes model considered as isotropic (which means we neglect the fluxes’ angular distribution as it occurs in diffuse lightning). In 1931, Kubelka and Munk proposed a similar approach to study the optical properties of paint layers [29]. Their theory defines the diffuse reflectance of material due to the interaction between inward and backward intensity fluxes. On the one hand,
because of the scattering effect, the diffuse reflectance signal comes from multiple infinitesimal layer of particles. On the other hand, the light intensity decreases with the layer’s depth because of the absorbance effect. Consequently, the diffuse reflectance signal increases up to a given depth of material for which it becomes stable. Kubelka and Munk called this reflectance value R∞ where the infinity symbol stands for the fact the material is thick enough. They propose the following formulation that involves the scattering and the absorption coefficients of the material S and K:
(1 − R∞)2 2R∞
= K S
Equation 1: The Kubelka-Munk’s formulation for the reflectance with an infinite optical depth.
The main consequence of this concept is that the spectral information of a diffuse reflectance measurement is obtained on a limited thickness of the material. The concepts of penetration depth and effective sample size were introduced to take this phenomenon into account.
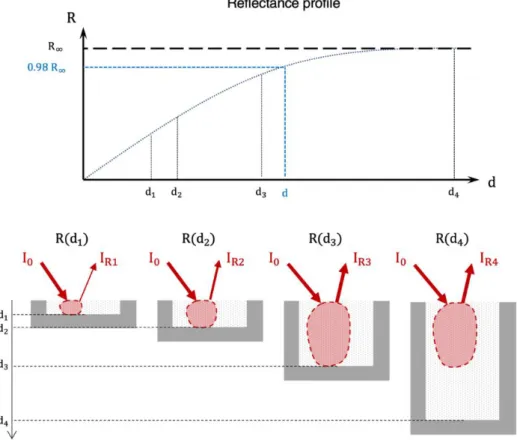
Berntsson et al. studied the effective sample size in diffuse reflectance and transmittance NIR spectroscopy by comparing two methods [30]. The first method uses calculations from the RTE and the 3-fluxes approximation detailed by Kuhn et al. [31]. The reflectance values R for increasing value of optical depth are calculated and compared to the theoretical R∞. The optical depth such that 𝑅 reaches a certain percentage of R∞ is defined as the penetration depth of the sample. The second method is empirical and consists of measuring the sample several times by increasing its thickness (Figure 2). It results in a reflectance profile obtained for on a range of sample thicknesses. According to the RTE, the reflected signal increases until a certain limit noted R∞. This reflectance profile is fitted using a negative exponential function as illustrated in Figure 2. This fit can be used to calculate the depth corresponding to a percentage of R∞.
In both methods, the authors refer to the effective mass sample. This notion is equivalent to the effective volume sample or the effective depth sample. They all refer to the actual quantity of sample that is responsible for the reflectance signal.
Figure 2: The empirical method for the determination of the effective sample depth.
Similar methods were used to determine the light penetration of radiations in different samples. Stolik et al. provided the light penetration depth of four Vis-NIR wavelengths in thirty types of “ex vivo” human tissues [32]. Ciani et al. studied the penetration of visible light in 19 different soils [33]. Lammertyn et al. focused on light penetration in apple slices [34].
B. The detection depth
The same context as Berntsson et al. can be considered (Figure 2) to define the concept of detection depth. A powder sample is lying on a flat and solid surface represented by the sample holder (in grey). In the study of Berntsson et al., the flat surface is a black polyamide plate that absorbs all the radiations indifferently [30]. Because of this, there is no specific absorption pattern that can be identified in the reflectance signal.
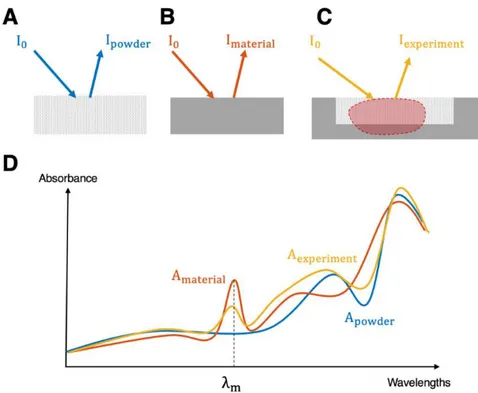
Let us consider a new situation where a material with a specific absorption pattern replaces the polyamide black plate. The detection depth corresponds to the maximal thickness of powder that enables the absorption signal of the bottom material to be identified. Its detection can be achieved when its spectrum exhibits a strong absorbance at a given wavelength. If the powder sample does not have an absorbance pattern for the surrounding wavelengths, an absorption peak in the diffuse reflectance spectrum can be attributed to the bottom material. This is illustrated in Figure 3 which shows the influence of the bottom material identified for a specific wavelength λm.
Figure 3: The comparison of three absorbance spectra showing the influence of the bottom material for in-depth reflectance measurement.
The theories regarding the diffuse reflectance are useful in describing simple situations where the scattering material is homogeneous. However, they are not efficient in modeling complex cases like the medium discontinuity between the powder and the bottom material because no simplification assumptions can be made. Instead, the literature shows that empirical approaches appear to be more realistic to achieve.
This approach was investigated by Huang et al. with regard to melamine detection in milk powder [35]. The authors prepared a few samples with a first layer of increasing milk powder thicknesses (from 1 mm to 5 mm) above a melamine powder layer. They applied a pre-trained classification model (Partial Least Square Discriminant Analysis) on the spectra measured by reflectance with a NIR HSI system. This model aimed to assess whether each pixel spectrum was pure milk or milk and melamine. The authors described that the performance of the model decreases in detecting milk-melamine pixels when the thickness of the milk layer increases. Thanks to this analysis, the authors were able to justify that a layer of 2 mm of milk powder was recommended to ensure the melamine beneath could be detected. This work provides a clear illustration of the detection depth and shows that the detection using NIR HSI should be made with a thin layer of material; otherwise, the melamine may be missed. However, there is still no general method to estimate the material depth at which the detection application is compromised. Moreover, this detection depth was not compared or discussed with the concept of penetration depth.
Despite the previously cited works on the field of penetration depth in NIR spectroscopy, there is still a lack of empirical study in the context of contamination
detection. To our knowledge, there is a need for a method measuring the detection depth of a given couple of materials in the context of detection using NIR HSI.
7. The detection of subpixel food particles
Raw materials in the food industry are often provided in powders because they guarantee a better stability [36]. Except for fish and meat, contamination detection in food using NIR HSI was often applied on powder. The particle size of food products may be smaller than 200 µm. For example, the Codex Standard defines that the particle size of wheat flour should be such that more than 98% of it should pass through a 212 µm sieve [37]. As a result, when measuring a mixture of different flours, the spectrum of a pixel 𝒙 may not be representative of a pure chemical compound. The situation is comparable to that of the measurement of a heterogeneous sample using conventional spectroscopy. At this stage, the acquisition of a hyperspectral image needs to be coupled to the signal unmixing process. It means that the spectrum is modeled as containing two or more different pure chemical signatures in given proportions. These spectral signatures and proportions are generally unknown, and some chemometric tools must be used to solve this problem.
The unmixing problem is an essential subject in remote sensing. When the goal is to detect a target in a hyperspectral image, it is known as the subpixel detection problem. Various algorithms were designed to take this problem into account and tested on multiple hyperspectral datasets [38-39]. Most of these algorithms were developed using annotated datasets. They consist of a hyperspectral image containing various types of materials like trees, asphalt, corn, wheat, and so forth. An annotated image is provided to give the ground truth of each pixel of the image. For example, the dataset University of Pavia1 is an image of a scene acquired by a hyperspectral sensor during a flight over Pavia, northern Italy. The ground-truth image gives a class to every pixel of the hyperspectral data. There also exist hyperspectral datasets for hyperspectral unmixing [40]. It means that unmixing algorithms can be evaluated on real data, which reveal their actual performance. This is the standard procedure to produce detection algorithms.
For food powder products, it is not possible to obtain similar ground-truth information. It would require knowing the spatial distribution of millions of particles of 100 µm of diameter and their chemical nature. In addition, annotated hyperspectral images for remote sensing analysis focus on the surface signal and do not consider multiple layers, which is essential in the case of food powders. Therefore, the result of the application of an unmixing algorithm is difficult to compare with the real situation.
The literature shows several applications of contamination detection in powders
using hyperspectral imaging. According to the situation, the authors chose different modeling strategies.
A. Classification algorithms
One strategy consists of using classification algorithms to label each pixel of the hyperspectral image. This technique requires to have a clear spectral definition of both the adulterant and the material. Vermeulen et al. [41] studied the adulteration of cereals by ergot bodies on a conveyer belt using a NIR HSI. The authors used Support vector Machine (SVM) and Partial Least Square Discriminant Analysis (PLSDA) to discriminate the spectra. As ergot bodies and cereals are larger than one pixel of the camera, each pixel likely contains either ergot or cereals but not both at the same time. Hence, there is no spectral mixing to consider in the pixel. In that case, Vermeulen et al. showed that the classification method is efficient for the detection.
B. Spectral similarities
Another method consists of using spectral similarity analysis to compare spectra from the hyperspectral image with a reference. Fu et al. used this method to detect melamine adulteration in milk powders down to a concentration of 0.02 % [10]. In this case, the particles of melamine and milk powders are smaller than the pixel meaning the spectral signal may be mixed in the pixels. For this reason, the authors used a threshold on the spectral similarity scores to identify pixels containing melamine. Huang et al. studied the same melamine and milk powder case [12]. They used the band ratio method that consists of analyzing the reflectance ratio of two wavelengths. As previously, the authors proposed a detection algorithm based on a threshold of the band ratio.
C. Quantification methods
A third method consists of the calibration of an algorithm that quantifies the adulterant proportion in each pixel. Lim et al. used a PLS regression to detect and quantify the melamine in milk powders [13]. As shown in the previous works, the melamine could be detected at 0.02 % global adulteration. The PLS regression coefficients show the same important wavelengths as the one selected by the band ratio method in [12]. Zhao et al. studied the adulteration of wheat flour by walnut and peanut flour using PLS model calibration [16]. The authors concluded that the model could detect adulteration over 1 % of global concentration. They noticed that the localization of peanut and walnut particles was impossible with this methodology because of two reasons: the particle size which is smaller than the pixel, and the similar trends of spectral curves among pure samples.
D. Unmixing methods
The Linear Mixing Model
When subpixel particles are measured in one pixel, their spectral signatures all contribute to the observed mixed spectrum. The most widely used model is the linear mixing model (LMM) [42]. It assumes the resulting spectrum from a pixel is generated by the linear combination of the spectra of the constituents, here the powder particles.
Figure 4: (A) A pixel is represented with several particles in its field of view. (B) The spectra of the pure ingredients and the mixture are represented.
The mathematical model of the LMM is given by [42]: 𝒙 = ∑ 𝑎𝑖𝒔𝑖 + 𝒘
𝑘
𝑖=1
= 𝐒𝒂 + 𝒘
Equation 2: The Linear Mixing Model.
𝒙 is the pixel spectrum; 𝑘 is the number of constituents in the pixel; the (𝒔𝒊)1≤ 𝑖 ≤ 𝑘 are the 𝑘 components representing the spectra of pure constituents of the pixel; (𝒂𝒊)1≤ 𝑖 ≤ 𝑘 are the contribution coefficients associated to the spectra; 𝒘 is an additive noise vector.
In the case of adulteration detection, spectral unmixing consist of finding the appropriate spectral profiles. The contribution coefficients can be used to detect adulteration for each pixel. Several algorithms can decompose a matrix of spectral measurements into two matrices of pure spectral components and coefficients. For example, PCA assumes the spectral components are orthogonal to each other. On the other hand, ICA assumes they are independent of each other. Mishra et al. studied the detection of peanut particles in wheat flour using both methods [14] [15]. They obtained two different sets of components and performed peanut detection using a
threshold on the scores. Even if the peanut particles were larger than the pixel, the unmixing method helped discriminate the neighboring pixels containing both peanut and wheat contribution. The authors noticed that the presence of fatty acids in peanut help to discriminate the particle in wheat flour.
The Multivariate Curve Resolution model
For melamine detection in milk powders, the particle sizes are smaller than the standard pixel sizes in NIR HSI (0.2 0.2 mm) [2]. Huang et al. uses an unmixing approach to determine the concentration map of melamine and milk in mixed samples [11]. They compare the PCA, the Classical Least Squares (CLS) and the Multivariate Curve Resolution Alternative Least-Squares (MCR-ALS) approaches. The authors showed that the MCR-ALS approach provides the best quantitative results. This method is based on the following bilinear model:
𝐗 = 𝐂𝐒𝐓 + 𝐄
Equation 3 : The bilinear model for MCR.
This model considers a matrix 𝐗 of size 𝑛 × 𝑚 that contains 𝑛 spectra 𝒙 stacked by rows. It decomposes 𝐗 into a combination of 𝑘 spectral components. Their spectral profiles are described in 𝐒 of size 𝑘 × 𝑚. The combination of the spectral components for each pixel is described in the concentration matrix 𝐂 of size 𝑛 × 𝑘. 𝐄 describes the model residuals for each pixel in row.
The Alternating Least-Squares algorithm
Many algorithms were used in the literature to solve the MCR model [43]. The iterative methods are the most widely used solutions because they enable to introduce mathematical constraints during the optimization process [44]. The association of MCR with the Alternative Least-Squares (ALS) algorithm developed in 1995 is the most popular approach [45]. The cost function of the MCR model is given by:
‖𝐗 − 𝐂𝐒𝐓‖ 2
2 = ∑(𝑥
𝑖,𝑗− 𝒄𝑖𝒔𝑗)2 𝑖,𝑗
Equation 4: Cost function of the MCR model.
where 𝒄𝑖 and 𝒔𝑗 are the parameters to optimize. This is not a convex cost function because of the interaction between 𝒄𝑖 and 𝒔𝑗. The ALS algorithm consists of alternatively fixing one parameter to have a simpler cost function. The solution can be calculated using the OLS similarly to the linear regression case. Hence the solution is given by:
𝐂̂ = (𝐒𝐓𝐒)−𝟏𝐒𝐓𝐗 𝐒̂ = (𝐂𝐓𝐂)−𝟏𝐂𝐓𝐗
Equation 5: Estimation of the concentration and spectral profiles using the ALS algorithm.
As the ALS is an iterative process, the algorithm starts with an initial guess either for 𝐂 or the 𝐒 matrix. Then, for each step of the process, 𝐂̂ and 𝐒̂ are calculated using the OLS (Equation 5) and enforcing the additional constraints. The hat notation indicates that the matrices are estimated. The algorithm continuously performs this two-steps estimation until a given stop criterion is reached. The criterion should evaluate how well the data are reconstructed using the 𝐂 and 𝐒 matrices. The lack of fit (LOF) is such a criterion:
LOF = √∑ 𝑒𝑖,𝑗 2 𝑖,𝑗 ∑ 𝑥𝑖,𝑗2
𝑖,𝑗
Equation 6: The lack of fit for the MCR model.
In practice, the required LOF may never be reached by the algorithm. For instance, it may be the case when the constraints are too important or when the noise level is high. For this reason, a maximum number of iterations is also taken into account as a stop criterion as shown in Figure 5.
Figure 5: The schema of the MCR-ALS algorithm. The variable 𝑖 denotes the number of iterations of the algorithm and 𝑖𝑚𝑎𝑥 is the maximum number of iterations set by the user.
The ambiguity of the Multivariate Curve Resolution model
The MCR model (Equation 3) is ambiguous. It means that many solutions (𝐂 and 𝐒 matrices) fit the model equally well. Although it is mathematically valid to consider that various solutions provide a model of the 𝐗 matrix with the same precision, it is a problem for interpretation. For practical applications, the pure components should be unique and represent the pure constituents of the 𝐗 matrix. The MCR-ALS literature identifies three kinds of ambiguities [43]:
o The permutation ambiguity: the order of the MCR components is not guaranteed in the 𝐂 and 𝐒 matrices. Let us assume a MCR model with 𝑘 = 3; 𝐂 of size 𝑛 × 3, 𝐒𝐓 of size 3 × 𝑚. This model is mathematically identical if 𝒄
𝟏 and 𝒄𝟐, as well as 𝒔𝟏 and 𝒔𝟐, are switched.
o The intensity ambiguity: the spectral intensity in the reconstruction of 𝐗 is indifferently attributed to the concentration profile 𝐂 or the spectral profile 𝐒𝐓. In other words, the two following models are mathematically equivalent:
𝐗 = ∑𝑘𝑖=1𝒄𝑖𝒔𝑖𝑇 and 𝐗 = ∑ (𝒄𝑖𝑎𝑖)(𝒔𝑖𝑇 1 𝑎𝑖) 𝑘
Because of this ambiguity, the spectral profiles obtained using MCR may have different scales which is a problem for interpretation.
o The rotational ambiguity: spectral profiles with different shapes can reconstruct the 𝐗 matrix with the same precision. This ambiguity is probably the most problematic since it leads to a change in the shape of the spectral profiles. Hence, the pure spectral signature may not be recognized during result interpretation (Figure 6). Mathematically, the rotational ambiguity is expressed as follows: any rotation matrix 𝐑 can be introduced in the model without changing the reconstruction of 𝐗.
𝐗 = 𝐂𝐒𝐓 and 𝐗 = (𝐂𝐑)(𝐑−1𝐒𝐓) where 𝐑 is a rotation matrix which satisfies: 𝐑𝐑𝐓 = 1.
Figure 6: Effect of the rotational ambiguity on the spectral profiles. (A) The average of pure peanut and wheat spectra; (B) the same spectra after a rotation transformation of 𝜋/8 (C) and -𝜋/6.
The ambiguities of the MCR model show that minimizing the reconstruction error of 𝐗 is not sufficient to find the purest spectral signatures. Instead, additional criteria should be applied to reduce the set of possible solutions, i.e. the ambiguity of the model.
The constraints of the Multivariate Curve Resolution model
The non-negativity constraint imposes the concentration and/or spectral profiles only contain positive values. This constraint is relevant with NIR spectra because intensity, reflectance or, absorbance values should always be positive. The closure constraint imposes the sum of all contributions is equal to a constant (often 1), which implies interdependencies between the species contribution. This constraint can be seen as a type of normalization which affects the intensity ambiguity [46]. The knowledge of pure spectra or concentration profiles can be introduced as a constraint in the ALS procedure. It should be used when a profile is known.
Although many constraint methods were implemented in the MCR-ALS, it is still tricky to reduce the rotational ambiguity because it often requires a prior knowledge of the spectral profiles, which is not always possible. The consequence of a rotational ambiguity could be that the spectral signals are not well unmixed. It may lead to misleading conclusion, in particular for detection purposes.
Many constraints have been developed and could be useful to reduce the rotational ambiguity. The correspondence of species can be applied in the case of a multiset analysis. In this situation, a column-wise augmented matrix is used to indicate which experiment contains or does not contain a specific component.
The matrix augmentation is not a constraint as such, but it enables to reduce the rotational ambiguity of the MCR solutions [47]. It enables to introduce several matrices that share one dimension. The augmented matrix strategy is a possible solution by stacking the unfolded matrices on top of each other:
( 𝑿𝟏 𝑿𝟐 𝑿𝟑 ) = ( 𝑪𝟏 𝑪𝟐 𝑪𝟑 ) 𝑺𝑻+ ( 𝑬𝟏 𝑬𝟐 𝑬𝟑 ) = 𝑪𝒂𝒖𝒈𝑺𝑻+ 𝑬𝒂𝒖𝒈
Equation 7 : The column-wise augmented matrix MCR model.
The selectivity constraint consists of providing concentration information to the ALS [48]. It is done by forcing the concentration matrix 𝐂 to fulfill the constraints provided by the prior knowledge. For example, the concentration coefficient of one spectral component can be set to 0 for some spectra. The correlation constraint imposes than the concentration profiles in 𝐂 have a sufficiently high correlation with reference data. It is a smoother way to impose that the concentration coefficients follow the prior knowledge.
Cordeiro Dantas et al. used MCR-ALS with a correlation concentration to detect adulterants in petroleum diesel using Raman spectroscopy [49]. They showed the constraint and the data augmentation strategy improve the quantification and the detection. Boiret et al. used a method to set local rank constraints for image resolution analysis with MCR-ALS [50]. The application of their method was the detection of a low dose compound in pharmaceutical compound using Raman microscopy. Although these two works show the potential of MCR-ALS for detection in spectroscopy, there is still no study aiming to detect food adulterant using NIR HSI. One reason can be that it is difficult to unmix signal composed of similar spectral profiles as it for food products in NIR spectroscopy.
The current methods for pixel unmixing in NIR HSI could be limited because of the subpixel problem and the ambiguity of spectral signatures in food products. Mishra et al. showed that the detection of peanut is feasible thanks to its fatty acids signature which is not present in wheat flour [14]. Quantitative models may be also limited in the case where subpixel detection is required as shown by Zhao et al. [16]. The MCR-ALS approach has the flexibility to provide constraints and solve the ambiguity problem. To our knowledge, the application of MCR-ALS for detection in food products using NIR
HSI has been quite limited. The application of constraints to reduce the model ambiguity seems to be the most promising technique.
E. Subspace detector
The last approach for the detection consists of modeling the spectral variability of samples to design a detector. The geometrical approach proposes a way to model the spectral variability. One spectrum is considered as a vector in a 𝑚-dimensional space, 𝑚 being the number of wavelengths in the spectrum. The principle of the geometrical approach is to restrict the spectrum’s variations in a lower dimensional space [42]. A spectrum 𝒙 is described by:
𝒙 = ∑ 𝑎𝑖𝒔𝑖 𝐿
𝑖=1
= 𝐒𝒂
Equation 8: The model for spectral variability.
In Equation 8, 𝐿 < 𝑚, and the vectors 𝒔𝒊 define the variability subspace. These vectors are spectral signatures that can have multiple origins. It may be the spectral signature of a pure sample, or it may be obtained from a statistical method like PCA. The spectral signatures are the axis of the subspace, whereas the coefficients 𝒂 are the coordinates of the spectrum.
The variability subspace described in Equation 8 can be obtained using PCA. The loading vectors are the weights of the PCs in the original space. Hence, they describe how the original variables are affected by the different sources of variability, i.e. the PCs. The scores describe the extend of the variability of the individuals for each component.
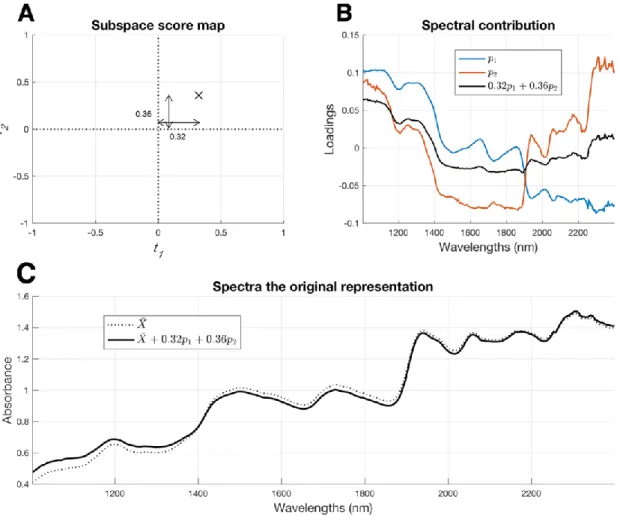
Figure 7 shows how spectral data are represented in the PC space. Figure 7A shows the feature space where one spectrum is represented by a black cross (or a vector). Its coordinates correspond to the contribution of each PC. Figure 7B shows the spectral contribution of the loadings and the reconstruction of the vector 𝒙 by combining the first two components. Figure 7C shows the resulting spectrum for the spectrum in (A) after adding the average spectrum represented in dash line2.
Figure 7: Representation of the variability using PCA. (A) the subspace PCA score map; (B) the two first loadings their combination; (C) the spectral rebuilding in the original space after adding the average spectrum.
The literature of NIR HSI for earth observation described multiple algorithms based on this modeling [51]. The Matched Subspace Detector (MSD) assumes that each pixel of a hyperspectral image falls into one of the two situations:
o Only particles from the standard sample are measured;
o Particles from both the standard and the adulterant samples are measured. The situation where only particles from the adulterant sample are measured is excluded because this case can be treated by the second situation without difficulty.
In the first situation, the pixel spectrum can be described by Equation 8 considering only the spectral components that describe the food sample. In the second situation, the spectral components describing the adulterant spectral signature are added to the model as a linear contribution as stated by the LMM. Both hypotheses leads to the design of two matrices that are used to build the MSD. Each matrix describes a variability subspace were the sample to detect is described.
This detector was successfully used in the earth observation applications for target detection. In this case, the pixels’ field of view is larger than targets of interest and the MSD was successfully applied to detect them. Du et al. used MSD to detect targets on
hyperspectral images [52]. Manolakis et al. provided an extensive description of subpixel target detector showing the MSD is particularly suitable for subpixel targets [51].
To our knowledge, such methods are not used for NIR HSI applications on food product. However, such a detector could be of great interest because it explicitly take into account the variability of the samples to detect. There is a need to develop this type of detector on food detection application.
I. The detection depth of a near-infrared hyperspectral
imaging system
This part has been adapted from the publication:
A. Laborde, B. Jaillais, R. Bendoula, J.M. Roger, D. Jouan-Rimbaud Bouveresse, L. Eveleigh, D. Bertrand, A. Boulanger, C.B.Y. Cordella, A partial least squares-based approach to assess the light penetration depth in wheat flour by near infrared hyperspectral imaging, J. Near Infrared Spectrosc. (2019). https://doi.org/10.1177/0967033519891594.
1. Introduction
There is a need for the study of powdered samples as they are often used in food industry processes and adulteration issues may occur in powdered raw materials. Even though HSI is able to resolve spectroscopic measurement on the surface of the sample, the volume that is screened is restricted. In fact, the penetration of light radiation is known to be limited because of scattering and absorption phenomena so that only a part of the product can be analyzed. This limitation is critical for quality-control applications and particularly for detection problems [54]. Indeed, when a sample is screened for adulteration checking, the whole sample should be analyzed to make sure the product is not contaminated. In this context, it is very important to know the actual volume of the screened sample. This knowledge enables technicians to know the best measurement conditions to ensure the detection. This is also an issue for powder homogeneity assessment using near-infrared spectroscopy (NIRS) [55] as the scale of scrutiny may be limited.
Powdered samples are mainly measured in reflectance mode. For diffuse reflectance, the spectroscopic sensor measures photons that are back-scattered in the sample or reflected at its surface. As the path length increases in the sample, the chance to be absorbed increases. As a consequence, there are much fewer photons that come back from the deepest layers of the sample than from the surface. For a certain depth, the amount of signal received by the sensor is similar to the noise measurement and it is not possible to retrieve any spectral information from this depth. Additionally, the amount of spectral information needed for detection may vary according to the chemical species. For example, melamine and milk powder [56] have two very distinct spectral signatures but it is less true for wheat flour and peanut particles [14]. As a consequence, the required signal-to-noise ratio for melamine detection in milk is likely to be smaller than those for peanut detection in wheat flour. Thus, the perceived detection depth may be different for the two cases whereas neither the sensor nor the physical phenomenon have changed.
The problem of light penetration depth for detection involves three considerations: first, the physical light penetration phenomenon in powders; second, the sensor dynamic range and finally the spectral signatures that have to be unmixed.
As hyperspectral imaging is more frequently used for detection problems, there are two important needs with respect to this light penetration issue. First, the need for an empirical method to be able to determine the maximal depth for detection regarding a given application. Then, a better understanding of the phenomenon that encompasses the physical phenomenon of light penetration, the sensor dynamic and the unmixing application case.
The Kubelka-Munk theory [29][57-58] provides some understanding about the penetration depth of near infrared radiations. Using a model with two fluxes of photons, it shows the diffuse reflectance for an infinitely deep sample (R∞) depends on the ratio between the scattering and absorption constants [54]. Although this theory assumes the sample is isotropic, the derived formula for diffuse reflectance is a central point for the study of penetration depth in powdered samples. According to this theory, the diffuse reflectance signal comes from different layers of the sample. When the thickness of the sample increases, the measured reflectance R increases to a given limit R∞. Deeper layers of the sample do not contribute to the reflectance. This concept is relevant for the determination of penetration depth. In past decades, many authors have studied the penetration depth subject according to different points of view.
Olinger et al. proposed an approach to determine the number of interrogated particles by comparing the baseline-corrected value of the pseudo-absorbance log10(1/R) to the absorbance per particle [59]. The authors deduced that for an absorbing matrix like carbazole, the penetration depth is less than 1 mm. Berntsson et al. have provided further understanding about the effect of sample thickness on diffuse reflectance measurements [30]. According to them, penetration depth in a sample is related to the depths from which the diffuse reflectance signal originates. Following this concept, they introduced the effective sample size which defines the sample mass which is sufficient to reach 98% of the diffuse reflectance of a corresponding optically thick sample (R∞). These results show that, for a powdered sample, the diffuse reflectance signal comes from different depths down to a certain level. This level is defined as the penetration depth or the effective sample size. Berntsson et al. proposed two methods for determining this depth and provided results for radiations between 400 nm and 2500 nm. For microcrystalline cellulose powder, the penetration depth shows a global decreasing behavior between 1000 nm and 2500 nm with penetration depth varying between 2.0 mm and 0.33 mm.
Stolik et al. measured human tissues in transmittance mode in order to determine their penetration depth [32]. The authors used the one-dimensional diffusion model where the penetration depth plays the role of the distance constant in the exponential decreasing law of intensity. By measuring the transmitted flux through the tissue for different thicknesses, the authors determine the penetration depth at different wavelengths. According to this definition, the penetration depth is the thickness of material that attenuates 63% of the incoming flux. Reported results show
penetration depth values vary between 0.1 and 3.0 mm for different kinds of human tissues at different visible light wavelengths.
Lammertym et al. used reflectance diffuse measurements on apple slices in order to determine the penetration depth of near infrared radiations [34]. By successively slimming the apple slice, the authors obtained the reflectance measurement for different thicknesses and fitted a decreasing exponential curve for each wavelength of the range. Results were similar to Berntsson et al. and the authors found a penetration depth between 2 mm and 4 mm in apples.
More recently, Padalkar and Pleshko have worked on the light penetration depth into cartilage to ensure the signal is not corrupted by underlying subchondral bone [60]. An empirical method was employed using a disk of polystyrene placed behind cartilages of different thicknesses. As this thickness increased, authors showed the signal of polystyrene decreased until it became invisible at visual inspection of spectra. From their protocol, the penetration depth is defined as the sample thickness for which the signal of the polystyrene target does not contribute to the diffuse reflectance measurement.
Huang et al. used a similar protocol by placing melamine under different thicknesses of milk powder [35]. The authors showed that a PLSDA failed to detected melamine contribution for a thickness of milk powder larger than 2 mm.
The literature shows that light penetration depth in spectroscopy can be studied through different underlying definition of the phenomenon. Some authors rely on theoretical models such as Kubelka-Munk or the diffusion model, whereas others use an empirical method that is specific to the application such as melamine and milk powder [35] or light penetration into cartilage [60]. As the literature shows, and to our best knowledge, no study offers a multivariate chemometric approach, sensor considerations and theoretical interpretation of the phenomenon.
This work studied the penetration depth of near infrared radiation into wheat flour using a sample holder of PLA. Hyperspectral imaging was used to acquire a great number of spectra with spatial information. PLS regression was used in order to quantify the amount of spectral signature coming from PLA along the sample holder. Finally, an interpretation of the phenomenon is proposed using the Kubelka-Munk theory and sensor considerations.
2. Material and methods
A. Samples
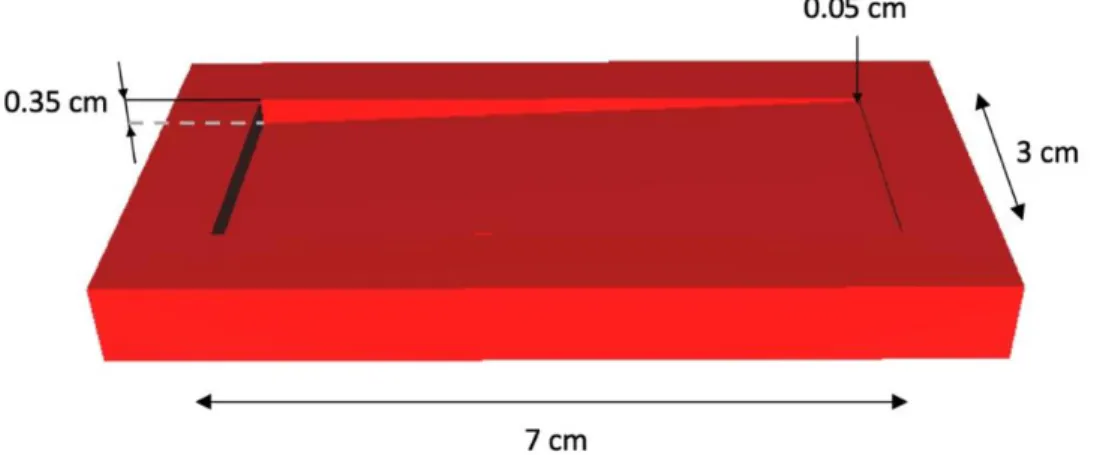
A sample holder has been designed and manufactured for this experiment using a 3-dimensional printer (Figure 8). The central cavity was designed on a gradient to contain powdered samples of varying thickness. The powder is skimmed on the top of the sample holder so that the thickness is graduated from 3.5 mm to 0.5 mm. The sample holder is made of PLA which has a specific absorbance peak in the near infrared spectral
range (1168 nm). White wheat flour (Francine, batch number 138, France) was used for the investigation of light penetration depth. Two replicates from the same pack were used for the measurement. Since packing density may have an effect on light behavior in the sample, the powder was not forced into the sample holder. Instead, wheat flour was sprinkled over the sample holder and skimmed in order to ensure the repeatability of the sample packing.
Figure 8: Schema of the sample holder.
B. Hyperspectral imaging system
A line-scan pushbroom HySpex SWIR-320m-e camera (Norsk Elektro, Skedsmokorse, Norway) was used to acquire hyperspectral images. The spectral range was 1000 – 2500 nm and 256 spectral bands were acquired, leading to a spectral resolution of 6 nm. The camera acquired 320 pixels per line. Two halogen lamps were used to illuminate the sample. A standard white diffuse reflectance standard (Spectralon®, SRS-99-010, Labsphere) was used to acquire the white reference image. The black reference image was acquired by closing the shutter of the camera.
C. Data processing
Images were cropped to focus on the central cavity of the sample holder leading to 100 × 246-pixels images. The white reference image was averaged to obtain one spectrum for every pixel of sensor’s line (I0). The black measurement (IB) and the white reference were used to calculate the reflectance signal from the raw measurement (I) using:
R = I − IB I0− IB
As they exhibit a low signal-to-noise ratio, the first wavelengths (smaller than 1100 nm) of the spectra were removed. A Savitzky-Golay filter was applied (2nd order polynomial, 7-points window and no derivative) to smooth the spectra. Finally, a log transformation (−log10) was applied to obtain absorbance spectra only for PLS application.
D. Thickness target values
The sample holder designed for the study is made such that the thickness of wheat flour varies. In the following, wheat flour thickness is referred as the 𝒚 target value. This thickness depends on the sample holder geometry. As a consequence, the 𝒚 target vector is constructed using the geometry of the central pit of the sample holder. Since it is designed as a slope between 0.05 cm and 0.35 cm, a linear interpolation vector was created and assigned to each of the 100-pixel lines across the sample holder. This procedure leads to a 2-dimensional mask that can be applied on the hyperspectral image (Figure 9). For spectral analysis, hyperspectral cubes are unfolded to obtain matrices of 24 600 lines and 256 columns. The 2-dimensional mask for 𝒚 values is unfolded in the same way so that each spectrum of the matrix is associated with the appropriate 𝒚 target.
Figure 9: The construction of the two-dimensional mask for thickness target values.
E. Reflectance profile extraction
The reflectance profiles across the sample holder were extracted for each wavelength following the procedure described in Figure 10. All the pixels on the same vertical line
were averaged in order to obtain one spectrum for each 𝒚 thickness value (step 1 to 2). As a result, a 2-dimensional matrix was obtained as well as the corresponding vector of 𝒚 target values. After selecting a wavelength band, all the corresponding reflectance values were extracted and plotted against the 𝒚 thickness values giving the reflectance profile (steps 3 to 4).
Figure 10: The procedure for the reflectance profile analysis.
F. Partial Least-Squares Regression
The PLS regression is an algorithm used for predicting a target value 𝒚 using predictors 𝐗 with a linear relationship: 𝒚 = 𝐗𝜷 + 𝐄. PLS is a good alternative to classical Multiple Linear Regression (MLR) or Principal Component Regression (PCR) when predictors are NIR spectral data. For this kind of data, there are a great number of variables (several hundreds) that are mostly correlated to each other. As a consequence, the construction of orthogonal latent variables is required for applying multiple linear regression. PCA is one method used for constructing such variables that are orthogonal and ranked according to the amount of variance they represent in 𝐗. PCR is achieved by performing MLR on these new variables. However, PCR does not take into account the relationship with target values 𝒚 in the construction of the orthogonal latent variables. PLS solves this problem by constructing latent variables based on the covariance between 𝐗 and 𝒚 [20 - 21]. PLS has been widely used in chemometrics as it is particularly suitable for near infrared spectral data [61]. In this study, PLS is used in order to quantify the amount of PLA signal in the diffuse reflectance measurements. It is assumed that the signal of PLA is linked to the wheat flour thickness in the sample holder. As a consequence, the 𝐲 thickness vector is used as target for the PLS calibration. The training was performed using cross-validation on the first sample replicate. 70% of the spectra from the cube were used for calibration and 30% for validation. This procedure
was repeated 10 times to select the number of latent variables associated to the averaged minimum root mean square error of cross-validation (RMSECV).
3. Results and discussions
A. Reflectance evolution for each wavelength
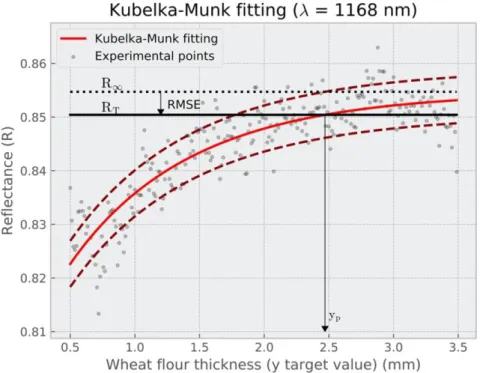
Figure 11 shows the reflectance spectral signatures of PLA and wheat flour. The spectrum of PLA exhibits high and resolute absorption peaks all along the near infrared range. The absorption peak at 1168 nm represents a high difference in reflectance between PLA and wheat flour. Figure 12 shows the reflectance profile at 1168 nm corresponding to this absorption peak. The experimental points exhibit a curve showing two behaviors. The first part of the curve corresponds to low thickness values and shows an increasing reflectance profile. The second part shows a stabilization of the reflectance level for high thickness values.
Figure 11: The pure reflectance spectra of wheat flour and PLA.
When the wheat flour thickness is low, the PLA plays an important role in the resulting diffuse reflectance signal. As it absorbs radiation around 1168 nm, the reflectance profile at this wavelength starts with low reflectance values. When the thickness increases, the role of wheat flour becomes more important than PLA in the resulting reflectance spectrum. Since wheat flour absorbs much less than PLA at 1168 nm, the reflectance level increases. This behavior can be interpreted using the theory of Kubelka-Munk presented in the next section.