Quality control of complex polymer materials using
hyperspectral imaging associated with multivariate
statistical analysis
Thèse
Massoud Ghasemzadeh-Barvarz
Doctorat en génie chimique
Philosophiae Doctor (Ph.D.)
Québec, Canada
iii
Résumé
Dans la première étape de ce travail, des composites formulés à partir d'anhydride maléique greffé polyéthylène (MAPE) et de différentes charges de fibres de chanvre (entre 0 et 60%) ont été produits et analysés par imagerie NIR. Trois méthodes chimiométriques ont été utilisées puis comparées pour la prédiction des propriétés mécaniques, cartographier la distribution des constituants et détecter les défauts physiques des matériaux: la calibration multivariée traditionnelle basée sur la régression PLS, la résolution multivariée de courbes (MCR) et l’analyse d’images et la régression sur les images multivariées (MIA/MIR).
Dans la deuxième partie de ce projet, une série de films multicouches complexes (échantillons industriels) ont été étudiés par imagerie NIR combinée à l’analyse d’images multivariée. Le potentiel et l'efficacité de la méthode proposée pour détecter les défauts causés par la (les) couche(s) manquant(es) ont été étudiés pour des films non imprimés et imprimés.
Dans la dernière partie, les composites hybrides polypropylène (PP) / fibre de verre / fibre de lin ont été étudiés. L'effet de la teneur en fibres (0 à 40% en volume) et de la composition sur les propriétés mécaniques ont été investigués, ainsi que l’effet de l’exposition à l’eau et la dégradation thermique et aux rayons UV (vieillissement accéléré des matériaux). Les images de microscopie électronique à balayage (MEB) des composites non vieillis ont été analysées en combinant des méthodes d’analyse de texture et des méthodes multivariées. Enfin, l'imagerie NIR a été mise en œuvre sur des composites non vieillis et vieillis afin de prédire leurs propriétés finales ainsi que pour modéliser les variations de composition chimique et celles dues au vieillissement accéléré.
En résumé, les résultats montrent que la combinaison de l'imagerie hyperspectrale et des méthodes statistiques multivariées est un outil puissant pour le contrôle de la qualité des composites polymères complexes. De plus, la méthode proposée est rapide et non destructive, elle peut être mise en œuvre en ligne, pour le contrôle de la qualité des matériaux composites. D'autre part, il a été démontré que l'analyse de la texture des images peut être appliquée à la quantification de la dispersion et du degré d’homogénéité de la distribution des charges dans des matériaux composites.
v
Abstract
In the first step of this work, maleic anhydride grafted polyethylene (MAPE)/hemp fiber composites with different filler concentration between 0 to 60% were analyzed by NIR imaging. Three chemometrics methods including Partial Least Squares (PLS), Multivariate Curve Resolution (MCR) and Multivariate Image Analysis/Multivariate Image Regression (MIA/MIR) were implemented and compared for predicting mechanical properties as well as mapping chemical compositions and material physical variations.
In the second part of this project, a series of complex multilayer films (industrial samples) were investigated using NIR hyperspectral imaging and Multivariate Image Analysis (MIA). The potential and effectiveness of the proposed method for detecting defects caused by missing layer(s) were studied for unprinted and printed films.
In the final part, polypropylene (PP)/glass/flax hybrid composites were studied. The effect of composition (fiber content between 0 and 40 vol%), as well as water, thermal and UV aging on mechanical properties was investigated. Then, Scanning Electron Microscopy (SEM) images of unaged hybrid composites were analyzed using texture analysis and multivariate methods. Finally, NIR imaging was implemented on unaged and aged composites to predict their final properties as well as to capture chemical composition and aging variations.
In summary, the results show that combining hyperspectral imaging and multivariate statistical methods is a powerful tool for quality control of complex polymer composites. Since the proposed method is rapid and nondestructive, one can implement it for on-line quality control of finished plastic products. On the other hand, texture analysis and multivariate methods can be applied for quantifying the mixing aspects of composites.
vii
Table of contents
Résumé ... iii
Abstract ... v
Table of contents ... vii
List of tables ... xiii
List of figures ... xv
Nomenclature ... xxi
Acknowledgments ... xxiii
Foreword ... xxv
Chapter 1. Introduction ... 1
1.1 Quality control of polymers ... 1
1.1.1 Background ... 1
1.1.2 The limitations of off-line (laboratory) measurements ... 3
1.2 Real-time quality control techniques ... 5
1.2.1 In-line measurement for plastics processing ... 5
1.2.2 On-line measurement for plastics processing ... 6
1.2.2.1 On-line rheometric techniques ... 9
1.2.2.2 On-line imaging techniques ... 9
1.2.2.3 On-line scattering techniques ... 11
1.2.2.4 On-line spectroscopic techniques ... 13
1.3 Objective of this work ... 26
Chapter 2. Hyperspectral image analysis ... 29
2.1 Pre-processing ... 33
2.1.1 Mean-centering ... 33
2.1.2 Variance scaling ... 33
2.1.3 Linear correction ... 34
2.1.4 Multiplicative scatter correction (MSC) ... 35
2.2 Multivariate statistical methods ... 37
2.2.1 Principal component analysis (PCA) ... 37
2.2.1.1 Mathematics and interpretation of PCA ... 37
2.2.1.2 Outliers in PCA model ... 41
viii
2.2.2 Projection to latent structures (PLS) ... 43
2.2.3 Multivariate curve resolution (MCR) ... 47
2.3 Spectral and spatial image analysis ... 49
2.3.1 Spectral analysis: Multivariate image analysis (MIA) ... 49
2.3.2 Spatial (texture) analysis ... 53
2.3.2.1 Gray level co-occurrence matrix (GLCM) ... 54
2.3.2.2 Discrete wavelet transform (DWT) ... 57
Chapter 3. Materials and methods ... 61
3.1 Image acquisition system... 63
Chapter 4. Multivariate image regression for quality control of natural fiber composites ………... ... 67
4.1 Introduction ... 69
4.2 Material and methods ... 72
4.2.1 Sample preparation and testing... 72
4.2.2 Hyperspectral image acquisition ... 73
4.2.3 Methods for hyperspectral image analysis ... 74
4.2.3.1 Multivariate calibration (PLS) ... 75
4.2.3.2 Multivariate image analysis/regression (MIA/MIR) ... 76
4.2.3.3 Multivariate curve resolution (MCR) ... 77
4.3 Results and discussion ... 79
4.3.1 Prediction of product properties ... 79
4.3.2 Surface distribution of the components (mapping) ... 86
4.4 Conclusions ... 90
Chapter 5. Multivariate image analysis for inspection of multilayer films ... 93
5.1 Introduction ... 95
5.2 Material and methods ... 97
5.2.1 Description of film samples ... 97
5.2.2 Hyperspectral image acquisition ... 98
5.2.3 Multivariate image analysis (MIA) ... 99
5.3 Results and discussion ... 102
5.3.1 Analysis of unprinted multilayer films (Set 1) ... 102
5.3.2 Analysis of printed multilayer films (Set 2) ... 107
ix Chapter 6. Mechanical, water absorption, and aging properties of
polypropylene/flax/glass fiber hybrid composites ... 119
6.1 Introduction ... 121
6.2 Experimental ... 124
6.2.1 Materials ... 124
6.2.2 Sample preparation ... 125
6.2.3 Characterizations ... 126
6.2.3.1 Scanning electron microscopy (SEM) ... 126
6.2.3.2 Density measurement ... 126
6.2.3.3 Water uptake and water resistance test ... 126
6.2.3.4 Thermal aging ... 127
6.2.3.5 UV aging ... 127
6.2.3.6 Mechanical testing ... 127
6.2.3.7 Multivariate analysis ... 128
6.3 Results and discussion... 130
6.3.1 SEM... 130
6.3.2 Mechanical properties ... 132
6.3.3 Water uptake and water aging ... 134
6.3.3.1 Kinetics of water absorption ... 136
6.3.3.2 Water aging ... 138
6.3.4 Thermal aging ... 140
6.3.5 UV aging ... 141
6.3.6 Multivariate analysis ... 146
6.4 Conclusions ... 150
Chapter 7. Thesis conclusion and recommendations for future work ... 153
7.1 General conclusion ... 153
7.2 Recommendations for future work ... 157
References ... 161
Appendix 1. Multivariate image analysis for inspection of multilayer films: Additional results ... 179
A1.1 Introduction ... 179
A1.2 Results and discussion ... 179
x
A1.2.2 Analysis of printed multilayer films by PLS-DA ... 181
A1.2.2.1 Wavelength selection by VIP ... 184
A1.2.3 FTIR Hyperspectral imaging (2860-5500 nm) of printed multilayer films ... 188
A1.3 Conclusion ... 189
Appendix 2. Mixing characterization of polymer composites using image texture analysis and multivariate statistical methods ... 191
A2.1 Introduction ... 193
A2.2 Experimental ... 196
A2.2.1 Materials ... 196
A2.2.2 Sample preparation ... 197
A2.2.3 Characterizations ... 198
A2.2.3.1 Scanning electron microscopy (SEM) ... 198
A2.2.3.2 Mechanical testing ... 198
A2.2.4 Image texture analysis ... 199
A2.2.4.1 Grey level co-occurrence matrix (GLCM) ... 199
A2.2.4.2 Discrete wavelet transform (DWT) ... 200
A2.2.5 Multivariate analysis ... 202
A2.2.5.1 Principal component analysis (PCA) ... 202
A2.2.5.2 Partial least square regression (PLSR) ... 203
A2.3 Results and discussion ... 204
A2.3.1 Scanning electron microscopy ... 204
A2.3.2 Dispersion analysis ... 206
A2.3.3 Distribution analysis ... 209
A2.4 Conclusions ... 216
Appendix 3. NIR hyperspectral imaging and multivariate statistical methods for quality control of PP/glass/flax fiber hybrid composites ... 223
A3.1 Introduction ... 223
A3.2 Experimental ... 223
A3.2.1 Materials and sample preparation ... 223
A3.2.2 Characterizations ... 225
A3.2.3 Hyperspectral imaging and image analysis methods ... 226
A3.3 Results and discussion ... 227
xi A3.3.2 Mapping material distribution on the surface of composites ... 231 A3.3.3 Detection of thermal, water and UV aging ... 238 A3.4 Conclusions ... 243
xiii
List of tables
Table 1.1- An overview of the proposed techniques for on-line quality control of plastic
products. ... 8
Table 2.1- Common GLCM texture features [142]. ... 56
Table 3.1- Materials and processing conditions used for the production of MAPE/hemp and PP/glass/flax composites. ... 62
Table 4.1- Predictive ability of the multivariate calibration PLS model (Method 1) and the MIR model (Method 2) on the training and validation sets a. ... 80
Table 5.1- Multilayer film samples. ... 97
Table 6.1- Coding and composition of the PP hybrid composites. ... 125
Table 6.2- Mechanical properties of unaged PP hybrid composites. ... 132
Table 6.3- Water absorption parameters at 85oC for the PP hybrid composites. ... 137
Table 6.4- Predictive ability of the PLSR model applied to correlate material composition to final composite properties. ... 148
Table 7.1- Summary of thesis contributions ... 157
Table A2.1- Coding and composition of the PP hybrid composites. ... 197
Table A2.2- Mechanical properties of PP/Glass/Flax composites. ... 199
Table A2. 3- Predictive ability of PLS model to predict the mechanical properties using textural features. ... 215
Table A3.1- Materials and processing conditions used for the production of PP/glass /flax composites. ... 224
Table A3.2- Coding and composition of the PP hybrid composites. ... 225
Table A3.3- Mechanical and aging tests applied on PP/glass /flax composites. ... 225
Table A3.4- Predictive ability of PLS model (Method 1) and the MIA/MIR model (Method 2) on the training and validation sets. ... 228
Table A3.5- Standard deviation of t3new as an estimation of degree of distribution. ... 237
xv
List of figures
Figure 1.1- Schematic representation of the set-up used for online visualization of PP melt
during extrusion [37]. ... 10 Figure 1.2- Schematic of web inspection for on-line imaging of plastic sheets and films
presented by Optical Control System GmbH [39]. ... 11 Figure 1.3- Determination of local PS content within a LDPE/PS film (3% PS) by VIS
spectral analysis. (Left) Score image of a sample showing defects. (Right) Illustration of estimated composition showing PS in red, LDPE in white, and intermediates in shades of yellow [69]. ... 15 Figure 1.4- a) Laboratory-scale system used by Leitner et al. [72] for on-line classification
of waste plastics. b) Digital RGB image of samples, c) NIR spectra of five plastics, d) the classification result, and e) the color mapping. ... 18 Figure 1.5- DSC measurement and predicted crystallinity distribution of HDPE (cooling
rate = 4oC/min) [70]. ... 19 Figure 1.6- The hyperspectral imaging system used by Serranti et al. [73] for discriminating
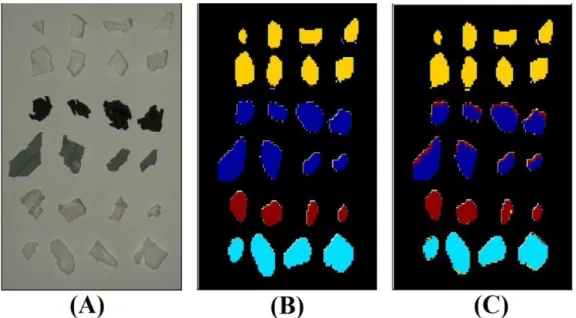
PP and PE from building and construction waste. ... 21 Figure 1.7- (A) Digital image of waste materials from PVC window frame, (B) prediction
image obtained applying PLS-DA using all wavelengths, and (C) prediction image obtained applying PLS-DA using 11 wavelengths. The colors show in yellow: PVC, blue: dark rubber, red: white rubber, and cyan: PE [74]. ... 22 Figure 1.8- (A) Image of PLA sample whose crystallinity was developed by the hot plate,
and (B) NIR image for predicted crystallinity of the PLA sample. The top parts of (A) and (B) are the hot side [77]. ... 23 Figure 1.9- (A) Acquisition schemes of two PLA and PET samples, (B) corresponding
RGB images, (C) predicted classes by PLS-DA (red: background, green: PET, and blue: PLA), (D) MCR estimated concentration (red: component 1, green: component 2, and blue: component 3) [75]. ... 25 Figure 2.1- Schematic representation of multispectral and hyperspectral images [90]. x and
y correspond to the spatial dimensions, while λ represents the spectral dimension. ... 29 Figure 2.2- A procedure for quality control of a given process/product using hyperspectral
images (adapted from [91]). ... 30 Figure 2.3- Application of multivariate statistical methods for feature reduction/analysis
(adapted from [91]). ... 32 Figure 2.4- One-point calibration: (A) raw image X, (B) white reference image R, (C) black
image D, and (D) the corrected image Xcorr. ... 35
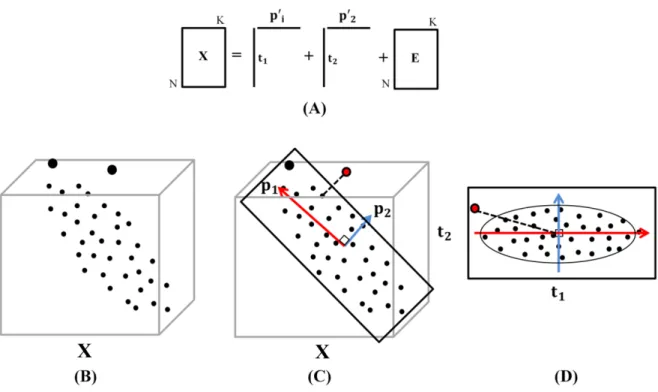
Figure 2.5- Geometrical interpretation of PCA. A) A matrix X is modeled by principal
component analysis. B) A 3-D space dataset X in which C) the first and second maximum variations are captured by the first two loadings (p1 and p2). An outlier (red filled circle)
xvi
error (SPE) is depicted in this figure. D) The 2-D plane obtained by projection of X onto the first and second loading factors leading to a t1-t2 scatter plot. An outlier (red filled
circle) which is identified by calculating its Mahalanobis distance from the center of score plots (Hotelling’s T2) is shown in this figure as well. ... 39 Figure 2.6- Goodness of fit and goodness of prediction versus model complexity. The
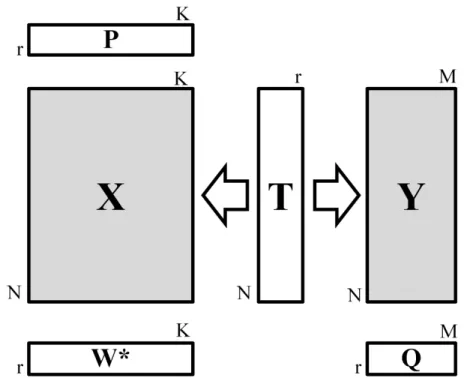
vertical axis represents the amount of explained or predicted variance, and the horizontal axis corresponds to the model complexity (number of latent variables). At a specific model complexity, optimum balance between fit and predictive ability of the model is achieved (adapted from [94]). ... 42 Figure 2.7- Schematic representation of the relationships between the matrices in a PLS
model. ... 45 Figure 2.8- Multivariate image representations as a 3-D (X) and 2-D or unfolded (X)
dataset. ... 50 Figure 2.9- The first three score images are combined in the red, green and blue channels to
present a false-color composite image of the same scene. ... 53 Figure 2.10- GLCM algorithm applied on (A) a 4×5 gray-scale image with four gray-level
values. The four arrows represent possible angles for calculating GLCM. (B) Numerical values of the gray-scale image, (C) GLCM for d=1 and θ=0⁰. ... 55 Figure 2.11- Scheme of DWT on 2-D image. In this image 2↓1 and 1↓2 denote
down-sampling in horizontal and vertical directions, while L and H are low-pass and high-pass filters, respectively (adapted from [141]). ... 59 Figure 2.12- An example of 2-D DWT. The approximation and detail sub-images are
obtained after the first level of wavelet decomposition (the original image from [152]). ... 60 Figure 3.1- Schematic representation of the line-scan imaging system. ... 63
Figure 3.2- Schematic representation of A) the hyperspectral cameras [153], and B) a
spatial/spectral image. ... 64 Figure 3.3- The experimental setup used for NIR imaging of multilayer films in
transmission mode. ... 66 Figure 4.1- Schematic representation of the line-scan NIR imaging system providing a
spectral/spatial image at each capture. ... 74 Figure 4.2- Schematic representation of the regression methods for prediction of material
properties. Method 1: traditional multivariate calibration using PLS. Method 2: MIR approach based on the dominant directions of the latent variable score space obtained by PCA (MIA). Note that two PCA components are shown for illustration purposes. ... 76 Figure 4.3- Latent variable space identified by MIA (t1−t2 score plot) on the set of training
images. Two dominant directions of variations are identified: PC1new related with hemp content (shown on the plot) and PC2new associated with physical variations from several sources. ... 81
xvii Figure 4.4- Rotated t1new−t2new latent variable space obtained by projecting the original
t1−t2 scores onto the dominant directions PC1new and PC2new. The hemp content of the
materials is indicated above each cluster. ... 83 Figure 4.5- MIR prediction results (method 2) for the validation set: average and standard
deviation of measured and predicted tensile property values for MAPE/hemp composites: (A) tensile strength, (B) tensile modulus, and (C) elongation at break (in logarithmic scale). ... 84 Figure 4.6- Maps of the rotated scores obtained by the MIR approach: (A) T1new images
showing the relative MAPE/hemp concentration distribution (chemical composition), and (B) T2new images capturing physical variations. ... 86
Figure 4.7- Loading plots for interpreting the information captured by the MIA/MIR
models: (A) new loadings Pnew; (B) NIR spectra of pure hemp and MAPE; (C) pure
components identified by MCR, MAPE (S1-blue) and hemp (S2-red). ... 89 Figure 4.8- MCR chemical mapping results: (A) distribution map of MAPE, and (B)
distribution map of hemp fiber. ... 90 Figure 5.1- Schematic representation of the line-scan NIR imaging system providing a
spectral/spatial image at each acquisition period. ... 99 Figure 5.2- MIA applied to unprinted films (Set 1). (A) t1-t2 scatter plot, (B) loading plot
of the first two components, (C) Hotelling T2-SPE plot. ... 105 Figure 5.3- MIA applied to unprinted films (Set 1). (A) T1 score image, (B) T2 score
image, (C) SPE image, and (D) Hotelling T2-SPE false-color image. ... 107 Figure 5.4- Printed barrier and non-barrier films. ... 108
Figure 5.5- MIA applied on the printed barrier and non-barrier films (Set 2). (A) T1 score
image, (B) T2 score image, (C) T3 score image, (D) t1-t2 score plot, (E) t1-t3 score plot, (F)
t2-t3 score plot. Two dominant directions of variations are identified in this plot: p2new
related with the presence/absence of a barrier layer and p3new associated with printing
feature, (G) loadings of the 1st component, (H) loadings of the 2nd component, and (I) loadings of the 3rd component. ... 110 Figure 5.6- (A) t2new-t3new latent variable space obtained by projecting the original t2-t3
scores onto the new directions p2new and p3new, (B) p2new and (C) p3new. ... 111
Figure 5.7- Images of the new rotated scores. (A) T2new images showing the
presence/absence of the barrier layer, and (B) T3new images capturing printing variations.
... 112 Figure 5.8- (A) t2new-t3new of barrier and non-barrier films for training and validation sets,
(B) T2new images showing the presence/absence of the barrier layer for validation set, and
(C) T3new images capturing printing variations for validation set... 114
Figure 5.9- Score masking procedure identifying the various printed ink colors captured by
t3new for both films. The pixels selected by each mask are overlaid on the T1 images of each
xviii
Figure 6.1- Typical SEM micrographs of unaged composites: (a) F40, (b) G10F10, (c)
G30F10, (d) G40, and (e) flax fiber bundle cross-section. ... 131 Figure 6.2- SEM micrographs of fractured surface of unaged F40 after tensile testing. a)
The white arrow points to the imprint of a flax fiber bundle which was completely debonded from the PP matrix. b) Rupture of a flax fiber bundle after tensile testing. ... 134 Figure 6.3- Water uptake curves at 85oC for PP hybrid composites. ... 136
Figure 6.4- Tensile properties of PP hybrid composites before and after water aging. a)
Tensile modulus, b) tensile strength, c) strain at yield, and d) elongation at break. ... 138 Figure 6.5- SEM micrographs of: a) F40 and b) G40 after water aging. ... 139
Figure 6.6- Tensile properties of PP hybrid composites before and after thermal aging. a)
Tensile modulus, b) tensile strength, c) strain at yield, and d) elongation at break. ... 141 Figure 6.7- Tensile and hardness properties of PP hybrid composites before and after UV
aging. a) Tensile modulus, b) tensile strength, c) strain at yield, d) elongation at break, and e) hardness. ... 142 Figure 6.8- SEM micrographs of cross-section for samples: a) F40, b) G20F20, and c) G40
after UV aging. ... 143 Figure 6.9- SEM micrographs images from UV aged surface of: a) PP, b) G40, and c) F40.
... 145 Figure 6.10- Visual appearance of F40 before and after UV aging. ... 145
Figure 6.11- VIP values for each composition in the PLS model applied to predict the final
properties of the composites before and after aging procedures (U: UV aging, T: thermal aging, W: Water aging). ... 149 Figure 6.12- Loading biplot of the first two components of the PLS model applied to
predict the final properties of the composites before and after aging procedures (U: UV aging, T: thermal aging, W: Water aging). ... 150 Figure A1.1- Simulated unprinted film inspection. Artificial defects are introduced in the final product (PP/PR/T/B) by removing one or a few layers in some areas across the film surface: (A) SPE image, (B) T1 score image, (C) T2 score image, (D) t1-t2 score plot, and
(E) Hotelling T2-SPE plot. ... 180 Figure A1.2- PLS-DA on NIR images of the printed barrier and non-barrier films. (A) first score image, (B) second score image, (C) third score image, (D) t1- t2 scattering plot, (E) t1-
t3 scattering plot, (F) t2- t3 scattering plot, (G) weightings vs. wavelengths. ... 182
Figure A1.3-Rotated scores plots obtained by PLS-DA. A) New score plot (t1new-t2new), and
B) rotated weightings (w*1new and w*2new) to interpret the information captured by the
PLS-DA model. ... 183 Figure A1.4- A) T1new image showing film composition (barrier and non-barrier films), and
xix Figure A1.5- A) VIP versus wavelengths and B) most important wavelengths (VIP>1) in the PLS-DA model (red bar below spectra). ... 185 Figure A1.6- Wavelength selection by VIP cutoff value of 0.3 to 1.2. A) Correlation coefficient versus VIP cut off values, and B) RMSE versus VIP cut off values. ... 186 Figure A1.7- Selected wavelengths (red bar below spectra) with optimum VIP cut-off value of 0.6. ... 186 Figure A1.8- Scores plots of new PLS-DA using wavelengths with VIP>0.6 (1068-1071 nm and 1696-1742 nm). A) t1-t2, B) t1-t3, and C) t2-t3. ... 187
Figure A1.9- IR spectra of unprinted regions of the barrier and non-barrier films. ... 188 Figure A1.10- MIA of FT-IR images of the printed barrier and non-barrier films. A) t1-t2
score scatter plot, B) t1-t3 score scatter plot, C) t2-t3 score scatter plot, D) first loading vs.
wavenumber, E) second loading vs. wavenumber, F) third loading vs. wavenumber. ... 189 Figure A2.1- Low-pass and high-pass discrete wavelet filters on an image at resolution scale s. The filtered image is reconstructed using details. ... 201 Figure A2.2- Typical SEM micrographs of hybrid composites: (A) F40, (B) G10F10, (C) G10F30, (D) G20F20, (E) G30F10, (F) G40, (G) PP, and (H) Mix. ... 205 Figure A2.3- Enhancing the quality of images using top-hat filter: (A) F40, (B) G40, and (C) PP. ... 206 Figure A2.4- Average of GLCM correlation feature versus d for the composites in (A) horizontal and (B) vertical direction. ... 207 Figure A2.5- Three artificial images showing three different composites with (A) good dispersion and bad distribution, (B) bad dispersion and good distribution, and (C) good dispersion and distribution. ... 208 Figure A2.6- GLCM correlation features for the three artificial images. ... 209 Figure A2.7- PCA on textural feature matrix of reconstructed images for the training set. (A) Score scatter plot, and (B) loading plot. ... 210 Figure A2.8- Score scatter plot for the test (validation) set. ... 211 Figure A2.9- Standard deviation of t2 as the degree of distribution for each composite. ... 212
Figure A2.10-(A) t1-t2 scatter plot of artificial images. For composite A, the numbers in
score scatter plot correspond to its sub-images (B) Composite A divided into 9 sub-images, and (C) standard deviation of t1 as the degree of distribution. ... 213
Figure A2.11-PLS prediction results for the test set. The average and standard deviation of measured and predicted values of mechanical properties: (A) tensile modulus, (B) tensile strength, (C) strain at yield, (D) elongation at break, and (E) Charpy impact. ... 215 Figure A3.1- Schematic representation of the regression methods for predicting tensile properties of unaged PP/flax/glass hybrid. Method 1: traditional multivariate calibration using PLS. Method 2: MIR approach based on the dominant directions of the latent variable score space obtained by PCA (MIA). ... 227
xx
Figure A3.2- PLS prediction results (method 1) for the validation set: average and standard deviation of measured and predicted tensile property values for PP/flax/glass composites: (A) stress at yield, (B) strain at yield, (C) tensile modulus, and (D) elongation at break. . 229 Figure A3.3- Latent variable space identified by MIA of unaged training set: A) t1−t2, B)
t1−t3, C) t2−t3, D) the first loading PC1, E) the second loading PC2 and F) the third loading
PC3. The dominant directions of variations in t1−t2 and t1−t3 are identified by PC1new and
PC3new related with filler content (shown on the plot) and PC2new associated with
systematic variations from several sources. ... 230 Figure A3.4- Rotated scores and loadings by projecting the original MIA scores and loadings onto the dominant directions PC1new, PC2new and PC3new: (A) t1new−t2new, (B)
p1nw, p2new (C) t3new−t2new (D) p3nw, p2new. ... 232
Figure A3.5- Maps of the rotated scores obtained by the MIA/MIR approach for training set: (A) T1new images showing the glass fiber concentration distribution, (B) T3new images
showing the flax fiber concentration distribution and (C) T2new images capturing systematic
variations (reflected light intensity variations). ... 233 Figure A3.6- Maps of the rotated scores obtained by the MIA/MIR approach for validation set: (A) T3new images showing the flax fiber concentration distribution, and (B) T1new
images showing the glass fiber concentration distribution. ... 234 Figure A3.7- Maps of the fillers concentration obtained by the PLS approach for the validation set: (A) Y1 images showing the flax fiber concentration distribution, and (B) Y2 images showing the glass fiber concentration distribution. ... 235 Figure A3.8- (A) Non-homogeneous flax filled composite and its (B) projected NIR image in t3new-t2new score scatter plot, (C) T2new image, and (D) Y1 image (refolded PLS predicted
value for flax content). ... 236 Figure A3.9- PCA results of NIR images before and after thermal aging. (A) t1-t2, (B) t1-t3,
(C) t1-t4, and (D) the first four loadings plots. ... 239
Figure A3.10- PCA results of NIR images before and after thermal aging. (A) t3-t4 score
scatter plots with the dominant directions PC3New and PC4New. Rotated scores and loadings
by projecting the original PCA scores and loadings onto the dominant directions PC3New
and PC4New: (B) t3New-t4New, (C) p3new, and (D) p4new. ... 240
Figure A3.11- PCA results of NIR images before and after water aging: (A) t1-t2, (B) t1-t3,
(C) t1-t4, and (D) the first four loadings plots. ... 241
Figure A3.12- PCA analysis of the hybrid composites before and after water aging. Rotated scores and loadings by projecting the original PCA scores and loadings onto the dominant directions in t3-t4: (B) t1New-t4New, (C) p1new, and (D) p4new. ... 242
Figure A3.13- PCA results of NIR images before and after UV aging: (A) t1-t2, (B) t1-t3,
xxi
Nomenclature
ANN Artificial neural networks
AAS Atomic absorption spectroscopy
CCD Charge-coupled device
CNF Carbon nanofiber
CNT Carbon nanotube
CV Cross-validation
DMA Dynamic mechanical analysis
DWT Discrete wavelet transform
EVA Ethylene vinyl acetate
FT-IR Fourier transform infrared
GLCM Gray-level co-occurrence matrix
GPC Gel permeation chromatography
HACCP Hazard analysis and critical control points
HDPE High density polyethylene
iPP Isotactic polypropylene
IR Infrared
LDPE Low-density polyethylene
LLDPE Linear low-density polyethylene
MA Maleic anhydride
MAPE Maleic anhydride grafted polyethylene MAPP Maleic anhydride grafted polypropylene
MCR Multivariate curve resolution
MFI Melt flow index
MIA Multivariate image analysis
Mid-IR Mid-infrared
MIR Multivariate image regression
MLR Multiple linear regression
MR-MIA Multiresolution multivariate image analysis MSC Multiplicative scatter correction
NIPALS Non-linear iterative partial least square
NIR Near-infrared
NMR Nuclear magnetic resonance
OPA Orthogonal projection approach
PCA Principal component analysis
PDF Probability density function
PE Polyethylene
PET Polyethylene terephthalate
PEVA Polyethylene vinyl acetate
xxii
PLS Projection to latent structures/partial least square PLS-DA Partial least square discriminant analyses
PMMA Poly methyl methacrylate
PO Polyolefin
PP Polypropylene
PS Polystyrene
PVC Poly vinyl chloride
PVOH Polyvinyl alcohol
RMSE Root mean squared error
RMSEC Root mean square error of calibration RMSEP Root mean square error of prediction
SAXS Small angle X-ray scattering
SEM Scanning electron microscopy
SIMPLS Statistically inspired modification of the PLS
SPC Statistical process control
SPE Squared prediction error
SVD Singular value decomposition
TEM Transmission electron microscopy
UV Ultraviolet
VIP Variable importance on the projection
VIS Visible
WAXS Wide-angle X-ray scattering
WTA Wavelet texture analysis
xxiii
Acknowledgments
I would like to express the deepest appreciation to Professor Carl Duchesne, for his excellent supervision and invaluable guidance during all stages of my work. Above all and most needed, he provided me unflinching encouragement and unconditional support in various ways throughout the ups and downs of this journey. I truly appreciate his genuine kindness. I am indebted to him more than he knows.
I would also like to thank Professor Denis Rodrigue for his professional guidance and insightful advice during my PhD study. This study would have never been accomplished without his continued support. I never forget his help and support while I was applying to the PhD program. In fact I would not have been here if he had not given me a big chance and accepted me as his graduate student. I am so grateful for his incessant kindness.
I wish to thank Mr. Adel Ramezani Kakroodi, a very good friend of mine, who let me work on his materials as a part of my project.
I would like to thank Mr. Yann Giroux for his patience and technical assistance during this work. Yann is not only a capable and hardworking technician, but also a nice person and very good friend.
Thanks to Simon Levasseur from Centre d'optique, photonique et laser (COPL) for his help on FTIR imaging.
I appreciate the technical assistance and financial support from IPL Inc., the Natural Sciences and Engineering Research Council of Canada (NSERC) and Consortium de Recherche en Plasturgie et Composites du Québec (CRPCQ) throughout this project.
I would like to thank Charlotte Gillium and Sophie Hudon who helped me to translate the abstracts into French.
Julien Lauzon-Gauthier, Pierre-Marc Juneau, Mathias Mangion, Jean-Pascal Lepetit-Stoffaes, Wilinthon Owindon Bogoya Forero, Moez Ben Boubaker, Karl Tremblay-Bouliane, Amir Vasebi, Mousa Javidani, Sheida Makvandi, Maryam Mavaddat, Ali Vazirizadeh, Arsia Afshar Taromi, Ali Faridkhou, Yasamin Kazemi, Amin Sarvaramini,
xxiv
Kamran Azari: thank you all for your friendship, support and discussion on your projects, life, … during lunch and break times. You made great memories for me.
I want to express my deepest appreciation to my dad and mom, Reza and Shahnaz, who sacrificed their lives for my sisters and myself and provided unconditional love, care and support throughout my life. Thank you both for everything you taught me.
Thanks to my lovely sisters, Soheila, Samaneh and Sepideh, for their support and encouragement.
I specially thank my sweet little daughter, Farnia, who makes me stronger and happier in my life.
I would like to express my special gratitude to my love, Malous, for her patience and kindness as a wife and best friend. She has always been a great supporter during my good and bad times. She has faith in me and I truly thank her for allowing me to be ambitious as I want.
Finally, I would like to thank everybody who was involved in the successful realization of this thesis.
xxv
Foreword
This thesis consists of 7 chapters and three appendices. The first three chapters review the recent literature on on-line quality control of polymer materials, present background knowledge on the chemometrics methods used in this project, and the details of materials and experiments, respectively. Chapters 4 to 6 are based on articles published in international scientific journals. Chapter 7 contains thesis conclusion and recommendations for future works.
Chapter 4:
As the first step in this project a binary system consisting of maleic anhydride grafted polyethylene (MAPE)/hemp fiber composite with different filler concentration between 0 to 60% was analyzed by NIR imaging. Three chemometrics methods including PLS, MCR and Multivariate Image Analysis/Multivariate Image Regression (MIA/MIR) were implemented to predict mechanical properties, mapping chemical compositions and physical variations. This work is presented in:
- Ghasemzadeh-Barvarz M., Ramezani-Kakroodi A., Rodrigue D., and Duchesne C., Multivariate image regression for quality control of natural fiber composites. Industrial & Engineering Chemistry Research 2013; 52(35), p. 12426-12436. Some of the results are also discussed in:
- Ghasemzadeh-Barvarz M., Ramezani-Kakroodi A., Rodrigue D., and Duchesne C., NIR imaging for real-time quality control of hemp plastic composites, in PPS Americas Conference. 2012: Niagara Falls, Canada.
xxvi
- Ghasemzadeh-Barvarz, M. Rodrigue D., and Duchesne C., Quality control of plastic composites using Multivariate Image Analysis (MIA), in Stats&Control. 2013: Kingston, Canada.
It is necessary to mention that the first part of sample preparation including polymer/fillers extrusion and granulation was performed by Mr. Adel Ramezani-Kakroodi (a PhD student) for his project. Then I carried out compression molding, NIR imaging, mechanical testing, applied chemometrics methods for image analysis by writing the necessary MATLAB codes and reported the work under the guidance of my supervisors.
Chapter 5:
For the second part of this project, a series of complex multilayer films, kindly supplied by IPL Inc., were investigated using NIR hyperspectral imaging and Multivariate Image Analysis (MIA). The potential and effectiveness of the proposed methods for detecting defects caused by missing layer(s) were studied for unprinted and printed films.
The results of multilayer films are discussed in
- Ghasemzadeh-Barvarz M., Rodrigue D., and Duchesne C., Multivariate image analysis for inspection of multilayer films. Polymer Testing 2014; 40, p 196-206.
One of the first challenges for inspecting films in this work was providing appropriate NIR images which were sensitive enough to subtle variations caused by missing thin layer(s). Therefore a special set-up was developed for image acquisition of these particular samples. The details of this set-up are presented in chapter 3.
I performed all the experiments including set-up design and NIR imaging, as well as modeling and reporting the results under the guidance of my supervisors.
xxvii
Chapter 6:
As the third part of this PhD project, PP/glass/flax hybrid composites, representing a practical complex composite, which can be used in plastic industry to produce for instance interior automotive parts, were studied. In this part, the effects of not only chemical composition (fiber content between 0 and 40 vol%) but also water, thermal and UV aging on mechanical properties have been studied.
The results of this part are discussed in:
- Ghasemzadeh-Barvarz M., Duchesne C., and Rodrigue D., Mechanical, water absorption, and aging properties of polypropylene/flax/glass fiber hybrid
composites. Journal of Composite Materials 2015; Corrected Proofs. DOI: 10.1177/0021998314568576
Some of the results are also presented in:
- Ghasemzadeh-Barvarz, M. Rodrigue D., and Duchesne C., Quality control of plastic composites using Multivariate Image Analysis (MIA), in Stats&Control. 2013: Kingston, Canada.
I performed all experiments including sample preparation, mechanical tests and reported the results under the guidance of my supervisors.
Appendices
Appendix 1:
Due to word and page limitations imposed by the Polymer Testing journal, some parts of the work on multilayer films presented in chapter 5 could not be included in the
xxviii
submitted manuscript. Therefore, the excluded results are discussed in Appendix 1. This section contains:
1- Simulation of a final product having some defects caused by missing layer(s) and the analysis of the NIR images.
2- Partial Least-Squares Discriminant Analysis (PLS-DA) and wavelength selection by the variable importance on the projection (VIP) method to discriminate printed barrier and non-barrier films.
3- FTIR hyperspectral imaging to discriminate printed barrier and non-barrier films.
Appendix 2:
In Chapter 6, the effects of fiber concentrations and aging on mechanical properties of PP/glass/flax hybrid composites are discussed. But in order to quantify two aspects of mixing including dispersion and distribution, SEM images of all samples before aging were analyzed using image texture analysis and multivariate methods. Therefore, the results of SEM images are reported in Appendix 2 as well as in the following conference paper:
- Ghasemzadeh-Barvarz, M. Rodrigue D., and Duchesne C., Mixing characterization of polymer composites using SEM images and texture analysis methods, in Canadian Chemical Engineering Conference 2014: Niagara Falls, Canada.
I performed all the experiments including sample preparation, image analysis and reported the results under the guidance of my supervisors.
Appendix 3:
In this section, NIR image analyses of PP/glass/flax hybrid composites before and after water, thermal and UV aging have been discussed. The objective of this work is to assess the effectiveness of hyperspectral imaging for chemical mapping,
xxix predicting final properties and detecting aging for more complex polymer composites.
Some of the results are presented in:
- Ghasemzadeh-Barvarz, M. Rodrigue D., and Duchesne C., Quality control of plastic composites using Multivariate Image Analysis (MIA), in Stats&Control. 2013: Kingston, Canada.
I performed all the experiments including sample preparation, mechanical tests, hyperspectral imaging, image analysis and reported the results under the guidance of my supervisors.
1
Chapter 1. Introduction
1.1 Quality control of polymers
1.1.1 Background
Nowadays, one cannot imagine the world without polymers including rubbers and plastics because they are widely used in many applications (such as automobile parts, containers, pipes, electric and electronic parts, medical products, construction materials, agricultural materials, packaging materials, clothing, adhesives, etc.) due to their excellent specific properties. However, polymers are generally not processed and used alone. Because in order to achieve processability and required end-use properties, they must be compounded with different additives (to enhance the stability), fillers (e.g. composites), or even other resins (e.g. polymer blends). Consequently, production quality control of these complex materials must be carried out to verify product conformity (attributes/properties) with requested specifications.
Several definitions have been proposed for “QUALITY” in recent years. The on-line Merriam-Webster dictionary [1] defines quality as “a peculiar character, a degree of excellence or a distinguishing attribute”. Quality as defined by ANSI/ASQC standard A3-1987 [2] is “the totality of features and characteristics of a product or service that bear on its ability to satisfy implied or stated needs”. Other definitions such as “meeting customer needs”, “conformance to specifications”, and “value for price” have also been mentioned in the literature [3, 4]. On the other hand, Juran and De Feo [5], two international leaders in the quality management field, settled on a new definition for quality: “fitness for purpose”.
The American Society for Testing and Materials (ASTM) defined “QUALITY CONTROL” as a “method of implementing the quality specifications for raw materials, intermediate, and finished products as established by management, and carries out the operational techniques and the activities that sustain quality of a product or service” [6].
Properties of plastic materials like other products need to be measured for quality control purposes. Although there is no unique classification for plastics characterization,
2
they can be summarized into 8 categories: mechanical, analytical, thermal, optical, electrical, elemental and structural, rheological, and weathering [7, 8].
1- Mechanical tests: mechanical properties are often the most important because all products must bear some degree of mechanical loading in their service life [9]. Mechanical tests are usually performed by applying known mechanical forces on standardized section of the sample, and measuring its response. Tensile strength and modulus (ASTM D 638), flexural strength and modulus (ASTM D 790), Izod impact (ASTM D 256), and compressive strength (ASTM D 695) are in this category.
2- Analytical tests: basic information that is crucial for qualifying and characterizing plastics can be provided by analytical tests [9]. Chromatographic techniques such as gas chromatography (GC) (ASTM D 4526), gel permeation chromatography (GPC) (ASTM D 6474), specific gravity (ASTM D 792), bulk density (ASTM D 1895), and water absorption (ASTM D 570) are some examples [8, 9].
3- Thermal tests: thermal analyses are equally as important as mechanical tests. Performance and behavior of polymers are studied by methods such as heat deflection temperature (ASTM D 648), Vicat softening point (ASTM D 1525), brittleness temperature (ASTM D 746), thermogravimetric analysis (TGA) (ASTM E 1131), and differential scanning calorimetry (DSC) (ASTM D 3417) over a wide range of temperature.
4- Optical tests: properties like refractive index (ASTM D 542), color (ASTM D 6290), haze (ASTM D1003), and specular gloss (ASTM D 2457) are in this category.
5- Electrical tests: for electrical applications like connectors, terminals, plastic-coated wires, switches, and printed circuit, the most important properties are dielectric strength (ASTM D 149), dielectric constant and dissipation factor (ASTM D 150), volume and surface resistivity (ASTM D 257), and arc resistance (ASTM D 495) [9].
3 6- Elemental and structural tests: for molecular information, different analyses like atomic absorption spectroscopy (AAS), nuclear magnetic resonance (NMR) spectroscopy, and infrared spectroscopy (IR) can provide information about elements concentration, chemical structure and chemical groups [7, 8].
7- Rheological tests: tests such as melt flow index (MFI) (ASTM D 1238), capillary rheometry (ASTM D 3835), and dynamic mechanical properties (ASTM D 4440) are widely used to study the deformation and flow of molten plastics.
8- Weathering tests: these tests are used to assess the effect of the environment on plastic materials. Weathering tests are implemented through actual outdoor exposure or accelerated analyses. Since they are time consuming, accelerated tests like “exposure of plastics to fluorescent UV lamps and condensation” (ASTM G 53) and “exposure of plastics to Xenon-arc type light and water” (ASTM D 2565) are often used to simulate the effects of long term outdoor exposure.
1.1.2 The limitations of off-line (laboratory) measurements
Generally, quality control measurements, regarding sampling procedure, can be performed off-line, at-line, in-line, and on-line [10, 11].
Off-line measurement is performed by collecting the samples from the production line and sending them to a laboratory for analysis.
At-line measurement takes samples and transports them to an analyzer near the process line. In this technique, various samples from different process stages can be analyzed.
In-line measurement is continuously measuring with a local probe in the process line which is connected to an automated analyzer.
On-line measurement uses a sampling stream drawn or divided from the process flow line and transfers it to a measurement apparatus.
4
In the plastics industry, only a few parameters are typically continuously monitored during the production such as temperature, pressure, and motor amperage. These measured variables do not provide a direct assessment of the materials properties. Thus, traditional off-line testing of polymer materials in quality control laboratories is still widely used for industrial process analysis. Relying solely on off-line measurements for controlling the materials quality has a number of drawbacks. First, the long time delays required for performing the destructive tests in the laboratory may cause large amounts of waste materials (off-specification) to be produced before the occurrence of process instabilities or defects are detected and corrective actions are applied. Second, the size of the samples used for testing is typically very small (few grams) and the sampling rates are low due to lab capacity constraints. Hence, only a small fraction of the production is tested for quality and there is always a risk to deliver undetected poor quality products to customers.
On the other hand, due to increasing public concern, over the last decades, about the environmental impacts of plastic wastes and in order to produce more environmentally friendly products and to reduce cost and/or weight (density), the use of recycled resins and natural fibers for replacing virgin polymers is becoming more and more favored by the industry. Hence, more complex formulations are developed involving virgin and/or recycled resins as well as different fillers and additives (e.g. compatibilizer, thermal stabilizers, etc.).
The increasing material complexity combined with raw material variability (recycled polymers and natural fibers) imposes new challenges for quality control of plastic products. Because in addition to the traditional surface defects (e.g. melt fracture) and product dimensions (e.g. thickness), the dispersion and distribution of fillers and other components as well as their concentration within the polymer matrix need to be monitored on the production line due to their considerable impact on the final properties. This can hardly be assessed on a real-time basis by conventional destructive and time-consuming laboratory tests.
Therefore, in recent years, research efforts were made to develop continuous and reliable measurement techniques to cope with the mentioned off-line testing drawbacks. These will be reviewed in the following section.
5
1.2 Real-time quality control techniques
The objective of this section is to review the proposed methods in the literature for real-time quality control of plastics. Since among the measurement modes, in-line and on-line are the most important techniques for continuous measurement, they are discussed here.
1.2.1 In-line measurement for plastics processing
In-line measurement probes are used directly within processing lines, and as a result, there is a very short (or even no) delay between the sampling and detection of process variations. Implementation of in-line probes for measurement of conventional parameters such as temperature, pressure, and motor amperage, in many cases, do not provide sufficient information on all material properties [12]. This is especially the case for analyzing complex polymer materials [13]. Moreover, industrial interest for acquiring direct information on chemical composition or material properties led to vast and dynamic researches on rapid, reliable, and robust in-line methods [14].
Various measurement techniques have been successfully used to gain information about rheological, morphological, chemical, and physical properties of polymer melts [15-18]. Among in-line measurement methods spectroscopic techniques, as analytical tools for fast quality control, have been used to extract specific information on molecular or chemical composition during melt processing [13]. For instance, a number of papers have been published describing the application of in-line near-infrared (NIR) probes for characterization of fillers, additives, and polymer blend composition [13, 19-23], as well as for estimating mechanical, structural, and rheological properties [24-27]. Other applications like mid-infrared (Mid-IR), Raman, ultraviolet (UV)-visible (VIS), and ultrasound spectroscopy have been used for composition analysis of copolymers and polymer blends, as well as for estimating filler concentration and residence time distribution [13, 28-30].
Although in-line techniques provide continuous measurement and have no sampling delay, their probes may interfere with the melt flow inside extrusion or injection machines. Process operating temperature and/or pressure can also influence the readings. Additionally, in-line analysis do not represent the finished products because after melt
6
processing, the molten polymer passes through the downstream units (i.e. cooling unit and haul-off systems) while it solidifies. Therefore, downstream units conditions such as cooling temperature profile and haul-off speed have a considerable effect on the quality attributes of final products which cannot be detected by in-line probes. For these reasons, on-line sensors to collect quality relevant measurements directly from the finished products during or just after solidification must be developed to compensate for the drawbacks of in-line techniques.
1.2.2 On-line measurement for plastics processing
As mentioned earlier the main difference between the on-line and in-line techniques is the sampling procedure. An on-line sensor collects measurements from a sampling stream diverted from or directly on the process flow line. Consequently, the probe has no effect on the process, and vice versa. In this case, instrument calibration and maintenance is simplified [12, 31], while sample conditioning, when necessary, consists of providing stable measurement conditions is applicable. Furthermore, some on-line measuring systems can allow testing on finished products. It is important to note that, due to material storage in the measurement unit, short delays might occur [32]. Generally speaking the on-line sensors have been implemented to analyze appearance, polymer structure, color, morphology, composition, additive concentration, dimensions, production stability, and flow properties [12].
Although the instruments are mainly categorized based on sampling procedure (in-line and on-(in-line), the on-(in-line devices can be classified as well based on:
1) the measurement techniques: rheometry, imaging, scattering and spectroscopy; 2) the scanning pattern: point-scan (a single point per acquisition), line-scan (a single line per acquisition) and area-scan (a 2D area per acquisition); and
3) the state of material being measured: melt or solid.
In order to review recent articles published on on-line quality control methods, the following sections will describe all measurement techniques, regardless of their scanning
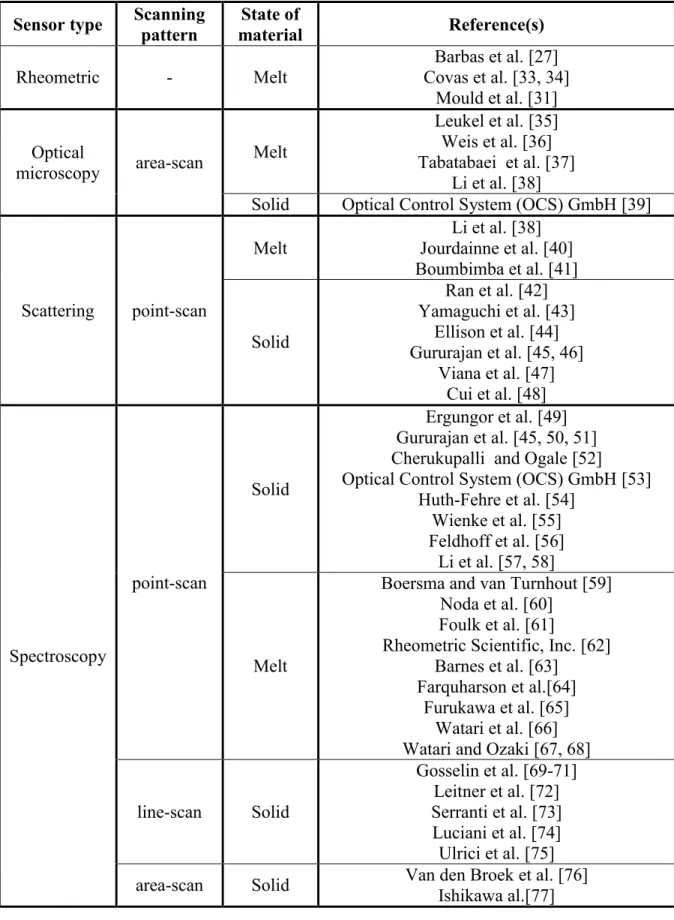
7 pattern and the state of material. However to have an overview of these approaches, Table 1.1 summarizes the on-line methods discussed in the next sections. Note that the emphasis for on-line instruments will be on remote sensors which are suitable for continuous analysis of finished products. “Remote sensing” is referred to the acquisition of information without making physical contact with samples.
8
Table 1.1- An overview of the proposed techniques for on-line quality control of plastic products.
Sensor type Scanning pattern material State of Reference(s)
Rheometric - Melt Covas et al. [33, 34] Barbas et al. [27] Mould et al. [31] Optical
microscopy area-scan Melt
Leukel et al. [35] Weis et al. [36] Tabatabaei et al. [37]
Li et al. [38]
Solid Optical Control System (OCS) GmbH [39]
Scattering point-scan
Melt Jourdainne et al. [40] Li et al. [38] Boumbimba et al. [41] Solid Ran et al. [42] Yamaguchi et al. [43] Ellison et al. [44] Gururajan et al. [45, 46] Viana et al. [47] Cui et al. [48] Spectroscopy point-scan Solid Ergungor et al. [49] Gururajan et al. [45, 50, 51] Cherukupalli and Ogale [52] Optical Control System (OCS) GmbH [53]
Huth-Fehre et al. [54] Wienke et al. [55] Feldhoff et al. [56]
Li et al. [57, 58]
Melt
Boersma and van Turnhout [59] Noda et al. [60]
Foulk et al. [61]
Rheometric Scientific, Inc. [62] Barnes et al. [63]
Farquharson et al.[64] Furukawa et al. [65]
Watari et al. [66] Watari and Ozaki [67, 68] line-scan Solid Gosselin et al. [69-71] Leitner et al. [72] Serranti et al. [73] Luciani et al. [74] Ulrici et al. [75] area-scan Solid Van den Broek et al. [76] Ishikawa al.[77]
9
1.2.2.1 On-line rheometric techniques
As an important scientific and technological target, real time monitoring of the rheological properties of polymers during their melt processing has been performed. An on-line capillary rheometer was designed by Covas et al. [33] for viscosity monitoring of polypropylene (PP) and polyethylene (PE). But this system suffers from the potentially destructive nature of the designed capillary rheometer since the morphology of the materials at detouring point may be changed by the test [34]. Therefore in the most recent publications, new on-line rotational rheometers were implemented to follow the viscoelastic behavior of PP, PP/polypropylene-grafted-maleic anhydride (PP-g-MA), PE, polystyrene (PS), and PP/PP-g-MA/organoclay [27, 31, 34].
1.2.2.2 On-line imaging techniques
Among imaging systems, optical microscopy is a useful technique for on-line remote sensing. Leukel et al. [35] and Weis et al. [36], for instance, have used on-line optical microscopy to characterize the morphology of PS/polymethylmethacrylate (PMMA) blends in the melt state. Tabatabaei et al. [37] have recently investigated the crystallinity of PP during tandem extrusion using a visualization chamber and charge-coupled device (CCD) camera before the die exit. Figure 1.1 shows the schematic of their set-up. The authors have showed that their visualization system can be used to study the effect of various parameters such as temperature profile, as well as amount and type of nucleating agents on the crystallization of polymers.
10
Figure 1.1- Schematic representation of the set-up used for online visualization of PP melt during extrusion [37].
Optical Control System (OCS) GmbH, has introduced a closed-loop on-line quality control system for monitoring spots, burns and gel particles on cast and blown film in the melt or solid state [39]. For detection of defects, the running film is imaged by CCD cameras, and the images are immediately analyzed by a proprietary pattern-recognition software. This software stores and measures the defect level of the products and, if necessary, alarms the operators. By gathering and processing these data, direct “closed-loop” feedback can be provided to control the production line. Figure 1.2 represents this on-line imaging system.
11 Figure 1.2- Schematic of web inspection for on-line imaging of plastic sheets and
films presented by Optical Control System GmbH [39].
It is worth mentioning that on-line imaging systems can be used for visual inspection of the product surface (aesthetic, visible defects, etc.), but does not provide any chemical information about the material. On the other hand, the strong refractive index of polymers and sample motion may limit the application of this method [32].
1.2.2.3 On-line scattering techniques
Scattering techniques, using light and X-ray, are extremely useful to study the structure, size, and shape of polymers in the solid, melt or solution state. Basically, the interaction of radiation with matter is the principle for all scattering techniques.
Light scattering: The National Institute of Standards and Technology (NIST, USA)
developed the first on-line light scattering imaging system for extrusion which was based on a slit die with sapphire windows [14], and Li et al. [38] has used this setup combined with optical microscopy to study the melt morphology of PE/PS blends. The scattering images provide information on domain size and shape of polymer blends when the components have similar refractive indices. Otherwise, the samples are turbid and multiple scattering occurs.
The dispersion and morphology of filled PP and PMMA with nanoclay particles have been investigated during extrusion using a new compact on-line optical sensor based
12
on light scattering [40, 41]. Note that this sensor can be applied on many polymer processing machines as soon as Dynisco (pressure) fittings would be available.
X-ray scattering: The application of real-time X-ray diffraction technique has been
limited to fiber spinning operations until recent years [45]. For instance, on-line structural studies on different fibers such as Kevlar 49, polyethylene terephthalate (PET), and isotactic polypropylene (iPP) during a continuous drawing process using small angle X-ray scattering (SAXS) and wide-angle X-ray scattering (WAXS) techniques have been reported [42-44].
Real-time WAXS was applied for blown film extrusion by Gururajan et al. [45, 46]. The WAXS data acquired in transmission mode were obtained at different axial positions in a film line in order to quantify crystallinity values of low-density polyethylene (LDPE) and PP. Since during real-time X-ray diffraction measurements, the diameter of the bubble cannot exceed the size of gap in the platform that holds the X-ray gun and the image-plate, only small diameter bubble could be investigated by this method. Viana et al. [47] used simultaneous time resolved WAXS and SAXS experiments for real time monitoring of the crystalline phase morphology of a PE shrinkable film (free ends) which was subjected to a thermal treatment. The experimental set-up allowed the simultaneous acquisition of WAXS and SAXS patterns for monitoring the evolution of the crystalline phase morphology in a controlled heating run. Li et al. [78] used SAXS for on-line morphological observation of extruded microfibrillar reinforced blend (MRB) based on PET and iPP.
Recently, a novel apparatus, including a simultaneous SAXS and WAXS system and an infrared thermometer, was designed by Cui et al. [48] which allows real-time monitoring of structure and temperature development in polymers during extrusion process. To mimic the processing of uni-axially oriented films or sheets, a vertical industrial extruder equipped with a rectangular die of 3×20 mm2 and a four-roll stretching device was used to study the structure development of iPP. Since the extruder and stretching device can be precisely moved upward and downward using a servo motor, any point of extrudate can be analyzed by X-ray scattering system. Combining structural information provided by this system and processing conditions, one can assess the relationship between processing
13 parameters and structural evolution which is a promising method to improve the understanding of physics in polymer processing.
Although X-ray scattering probes can be used as remote sensors to assess morphological properties of solid polymers, they can scan a single localized point on the sample at a time (point-scan). Thus the probes or the sample must move in two perpendicular direction (horizontally and vertically) to analyze the whole surface of sample. Consequently, these probes are not suitable for spatial analysis of finished products in real industrial environment.
1.2.2.4 On-line spectroscopic techniques 1.2.2.4.1 On-line dielectric spectroscopy
In dielectric spectroscopy, dielectric properties of a medium are measured as a function of frequency. Literature review shows that this method can be used for on-line characterization of morphology and microstructure of polymer blends in the melt state [59, 60].
1.2.2.4.2 On-line Raman spectroscopy
Raman spectroscopy, based on “Raman scattering”, is one of the principal approaches by which the molecular vibrations and rotations may be studied [79]. When an incident laser beam encounters molecules in a target sample, the scattering called Rayleigh scattering, is predominantly elastic, where the excited molecule returns to the original ground state, and the photon is “reemitted” at the incident frequency. Other possibility for the incident photons is to interact with the molecules in such a way that energy is either gained or lost. In this situation the scattered light which has a different wavelength than the incident, is called inelastic scattering or Raman scattering.
Among recent applications of Raman spectroscopy for on-line quality control of plastics processing, Ergungor et al. [49] used this approach, together with neural network, for estimation of crystallinity and temperature of Nylon 6 nano-composite while the sample was cooled from the melt at a fixed cooling rate. Gururajan et al. [45, 50] implemented single-point laser Raman spectroscopy to measure the molecular orientation evolution
14
during blown film extrusion of LDPE and PP. Real-time crystallinity measurement of LDPE/iPP and linear low-density polyethylene (LLDPE) films has been reported as well [51, 52].
Although Raman spectroscopy is a convenient technique, it requires high-stability laser sources and sensitive amplification equipment for detecting the weak signals. Thus Raman instruments are more expensive than IR equipment [80]. Fluorescence is an important issue when Raman spectroscopy is used for non-pure polymers (polymer with additive, catalyst residual or degradation product). Using an excitation laser wavelength in the NIR region (785 nm) can reduce fluorescence, but comes with additional costs [81]. It is worth mentioning that in this method sample heating by intense laser radiation may happen which can destroy the sample or change the Raman spectrum [82].
1.2.2.4.3 On-line Ultraviolet (UV)/Visible (VIS) spectroscopy
Foulk et al. [61] showed that a UV (200-400 nm) spectroscopic probe is applicable to measure antioxidant concentration in polyolefins melt. The AddiMetTM spectroscopic package, introduced by Rheometric Scientific, Inc., can be equipped with UV spectroscopy to measure low levels of antioxidants, and with VIS (200-750 nm) to determine colorants and whiteness of polymer melt [62].
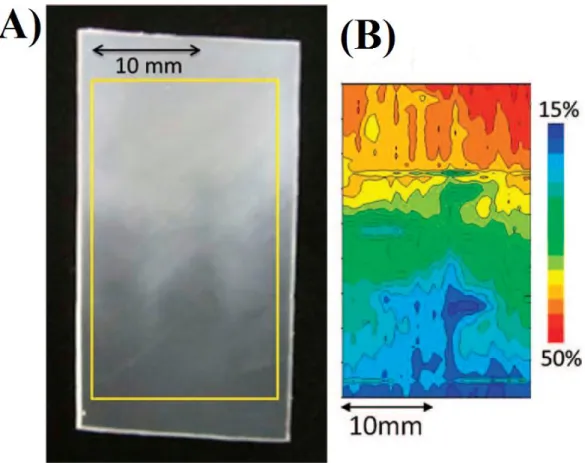
Gosselin et al. [69] proposed a line-scan VIS hyperspectral imaging sensor to monitor finished film products. In this work, LDPE/PS properties such as modulus, tensile strength, and toughness, were predicted using partial least square (PLS) regression based on spectral and textural image features extracted by multivariate image analysis (MIA) and wavelet texture analysis (WTA), respectively. In addition, image analysis provided real time 2D estimation of blend composition (Figure 1.3).
15 Figure 1.3- Determination of local PS content within a LDPE/PS film (3% PS) by VIS spectral analysis. (Left) Score image of a sample showing defects. (Right) Illustration of estimated composition showing PS in red, LDPE in white, and intermediates in shades of
yellow [69].
1.2.2.4.4 On-line Mid-Infrared (IR) spectroscopy
Mid-IR (2500-25000 nm) spectroscopy has been used in analytical laboratories for decades. It was the first optical spectroscopic method tested for controlling melt extrusion [83]. Since in mid-IR region, fundamental molecular vibration occurs, this method has been used frequently for monitoring chemical composition during production. As an example, Barnes et al. [63] at Bradford university implemented a point-scan on-line transmission mid-IR spectroscopy for monitoring PE/PP blend composition and determine the vinyl acetate content of a series of polyethylene vinyl acetate (PEVA) copolymers during single screw extrusion.
A commercial on-line Fourier transform infrared (FT-IR) spectroscopy system, called APLAIRS®, has been produced by Optical Control System GmbH (OCS) for cast and blown film production [53]. Although this system focuses on film measurement because it is closer to end product, it can be implemented for melt samples as well. APLAIRS is capable of measuring and predicting many quality control parameters such as additive concentration, density, thickness, gloss, and haze. Furthermore, it is applicable to determine composition and thickness of different layers of co-laminates samples.
![Figure 1.1- Schematic representation of the set-up used for online visualization of PP melt during extrusion [37]](https://thumb-eu.123doks.com/thumbv2/123doknet/6615145.180010/40.918.194.742.101.566/figure-schematic-representation-used-online-visualization-melt-extrusion.webp)
![Figure 1.4- a) Laboratory-scale system used by Leitner et al. [72] for on-line classification of waste plastics](https://thumb-eu.123doks.com/thumbv2/123doknet/6615145.180010/48.918.168.761.106.538/figure-laboratory-scale-used-leitner-classification-waste-plastics.webp)
![Figure 2.2- A procedure for quality control of a given process/product using hyperspectral images (adapted from [91])](https://thumb-eu.123doks.com/thumbv2/123doknet/6615145.180010/60.918.240.601.350.798/figure-procedure-quality-control-process-product-hyperspectral-adapted.webp)
![Figure 2.3- Application of multivariate statistical methods for feature reduction/analysis (adapted from [91])](https://thumb-eu.123doks.com/thumbv2/123doknet/6615145.180010/62.918.190.723.353.711/figure-application-multivariate-statistical-methods-feature-reduction-analysis.webp)