© Louis-Philippe Ménard, 2019
Abondance et impact des espèces concurrentes sur la
régénération résineuse après coupe avec protection de
la régénération dans un secteur de la forêt boréale du
Québec
Mémoire
Louis-Philippe Ménard
Maîtrise en sciences forestières - avec mémoire
Maître ès sciences (M. Sc.)
Abondance et impact des espèces concurrentes sur la
régénération résineuse après coupe avec protection de
la régénération dans un secteur de la forêt boréale du
Québec
Mémoire
Louis-Philippe Ménard
Sous la direction de :
Jean-Claude Ruel, directeur de recherche
Nelson Thiffault, codirecteur de recherche
iii
Résumé
Nous avons mené une étude pour identifier les situations où les éricacées et des feuillus causent des problèmes de compétition aux conifères en forêt boréale.
Pour ce faire, nous avons lié les données d’un inventaire de régénération réalisé entre 2007 et 2011 à des données portant sur l’hypsométrie, la classification écologique, les sols et les peuplements forestiers avant la récolte. Nous avons analysé cet assemblage de données pour étudier les relations entre la végétation concurrente et les variables associées à la récolte et à l’environnement, puis nous avons estimé la probabilité d'observer une couverture d'espèces concurrentes donnée en fonction de ces variables. De plus, en 2015, nous avons rééchantillonné une partie des sites pour évaluer l'impact temporel de différents niveaux de compétition sur le coefficient de distribution (c.d.), la vigueur et la surface terrière de la régénération résineuse, là où elle était marginale tôt après la coupe.
L’analyse des données de l’inventaire de 2007 à 2011 montre, qu’après une coupe avec protection de la régénération et des sols, les éricacées et les feuillus ne sont pas associés aux mêmes types de milieux. Les éricacées se retrouvent surtout dans des milieux moins productifs associés à l’épinette noire et au pin gris. La distinction entre les milieux propices aux feuillus commerciaux intolérants à l’ombre et aux feuillus non commerciaux est moins nette puisqu’ils répondent souvent de façon semblable à une même variable. L’analyse des données de l’inventaire de 2015 montre une amélioration significative du c.d. lorsque les niveaux de compétition des feuillus commerciaux intolérants à l'ombre sont faibles (c.d. 0-40%) et lorsque les niveaux de compétition des éricacées sont modérés (c.d. 26-75%). Les différents types et intensités de compétition ne semblent pas affecter la vigueur ni influencer la surface terrière de la régénération résineuse de 9 à 14 ans après la coupe.
iv
Table des matières
Résumé ... iii
Table des matières ... iv
Liste des tableaux ... v
Liste des figures ... vi
Remerciements ... vii
Avant-propos ... viii
Introduction générale ... 1
Chapitre 1. Abundance and impacts of competing species on conifer regeneration following careful logging in the eastern-Canadian boreal forest ... 6
Abstract ... 6
Introduction ... 7
Materials and Methods ... 9
Study area ... 9
Creation of a first database ... 11
Data from the monitoring of post-harvest regenerating stands ... 11
Hypsometric data from topographic maps ... 12
Ecological classification data from the governmental ecological classification system ... 12
Forest stands and soil attributes from forest ecological survey datasets... 12
Creation of a second database ... 12
Stratified inventory ... 13
Data analysis ... 14
Variables significantly linked to competing vegetation cover ... 14
Probability of observing a given competing species cover ... 15
Regeneration on sites with marginal FTG stocking ... 15
Results ... 17
Variables significantly linked to competing vegetation cover ... 17
Probability of observing a given competing species cover ... 19
Regeneration on sites with marginal FTG stocking ... 24
Discussion ... 26
Conclusion ... 33
Conclusion générale ... 35
v
Liste des tableaux
Table 1. Distribution of transects in the stratified inventory based on dominance by competing vegetation groups and levels of competition. ... 13 Table 2. Description of the independent variables identified in the RDA and later used in the linear mixed model and the cumulative link mixed models. ... 18 Table 3. Summary of the linear mixed models predicting commercial shade-intolerant hardwood stocking as a function of harvesting and biophysical variables. ... 20 Table 4. Threshold coefficients and summary of the cumulative link mixed model predicting non-commercial hardwood percent cover as a function of harvesting and biophysical variables. ... 22 Table 5. Threshold coefficients and summary of the cumulative link mixed model predicting ericaceous shrub percent cover as a function of harvesting and biophysical variables. ... 23
vi
Liste des figures
Figure 1. Location of the study area and sampling sites in Quebec (Canada). ... 10 Figure 2. (A) Configuration of the micro-plots in a transect used in the 2007-2011 monitoring of post-harvest regenerating stands. (B) Configuration of the plot and the microplots in a transect for the 2015 stratified inventory. ... 14 Figure 3. RDA ordination biplot showing the correlation between competing species groups (black arrows) and explanatory variables selected using a forward selection approach (grey arrows). ... 19 Figure 4. Free-to-grow conifer stocking per strata of competing cover and over two time periods. ... 24
vii
Remerciements
Je tiens à remercier mon directeur, Jean-Claude Ruel, et mon codirecteur, Nelson Thiffault, pour m’avoir donné l’opportunité d’effectuer ce projet de maîtrise, pour leurs conseils et pour leur grande patience. Je veux aussi remercier Benoît Lafleur et Louis Bélanger d’avoir commenté la version préliminaire de ce mémoire, Brian Harvey d’avoir commenté mon proposé de recherche, Jean Bégin d’avoir trouvé le financement pour supporter ce projet, Martin Riopel qui m’a fourni une partie des données à la base de ce projet, Marie-Laure Lusignan et Gabriel Cliche qui m’ont accompagné sur le terrain pour récolter des données et Josianne DeBlois ainsi que Marc Mazerolle pour leurs conseils en statistiques. Merci aussi à Olivier, Marine, Christine, Simon, Laurence, Pierre-Yves et Célia d’avoir mis de la vie dans notre bureau sans fenêtre!
viii
Avant-propos
Ce mémoire débute par une introduction générale en français, suivie d’un chapitre central rédigé en anglais sous la forme d’un manuscrit d’article scientifique, puis d’une conclusion générale en français. Jean-Claude Ruel et Nelson Thiffault ont élaboré l’étude. J’ai conçu le protocole expérimental détaillé, planifié les travaux de terrain et réalisé l’inventaire de 2015. L’analyse des données et la rédaction ont été sous ma responsabilité, avec le support de Jean-Claude Ruel et Nelson Thiffault. Le projet a été financé par une subvention de recherche du Fonds québécois de la recherche sur la nature et les technologies (FRQNT) – Actions concertées accordée à une équipe dirigée par Jean Bégin.
1
Introduction générale
Les conifères constituent une part importante de l'économie forestière en forêt boréale. Or, après une coupe, des espèces feuillues et éricacées peuvent rapidement envahir les stations, ce qui risque d’empêcher ou de ralentir l’établissement de la régénération résineuse.
En fait, les feuillus peuvent à la fois faciliter ou inhiber la croissance et la survie des conifères. La facilitation peut prendre la forme d’une protection contre les insectes, les maladies, la photoinhibition, la photooxydation, les extrêmes de température et les extrêmes d’humidité (MacLean 1996, Gerlach et al. 1997, Man et Lieffers 1999a, 1999b, Man et Greenway 2011), d’une amélioration de la fertilité du sol (Fortin et al. 1983, Bradley et Fyles 1995, Wang et al. 1996, Laganière et al. 2010), ou un meilleur accès aux éléments nutritifs grâce à des mycorhizes (Simard et al. 1997, Philip et al. 2010). La compétition peut survenir par l’interception d’une partie de la lumière (ce qui semble être le mode de compétition principal des feuillus faisant l'objet de cette étude; Farmer et al. 1988, Simard 1990, Bell 1991, Jobidon 2000, Simard et Hannam 2000, Comeau et al. 2003, Filipescu et Comeau 2007), de l’eau (Lieffers et al. 1993, Jobidon 1995) et des éléments nutritifs (Lieffers et al. 1993, Simard et Sachs 2004) disponibles. Les feuillus, peuvent aussi causer des dommages physiques, par fouettement, aux semis de conifères (comme c'est le cas pour le peuplier faux tremble et bouleau à papier; Kagis 1952, Bell et al. 2011). Les problèmes de compétition semblent survenir lorsque les feuillus atteignent un seuil de densité qui varie selon les espèces en interaction (p. ex. Légaré et al. 2004, Hawkins et al. 2012, Hawkins et Dhar 2013).
Le bouleau à papier (Betula papyrifera Marsh.) et le peuplier faux-tremble (Populus
tremuloides Michx.) sont deux des feuillus que l’on retrouve le plus souvent en forêt
boréale québécoise (Saucier et al. 2009). Bien que ces espèces revêtent un intérêt commercial, leur valeur économique est généralement inférieure à celle des conifères en forêt boréale, ce qui contribue à ce qu’elles soient perçues comme des espèces concurrentes. De plus, elles peuvent attirer des herbivores qui pourraient endommager les semis de conifères (Parker 1984, DeLong 2000). Le peuplier faux-tremble a des besoins en nutriments plus élevés que l’épinette noire (Picea mariana (Mill.) B.S.P.) (Paré et al. 2002). Si on remplace une épinette noire par un peuplier faux-trembles, on peut donc s’attendre à une augmentation de la compétition pour les nutriments (Légaré et al. 2005). Cependant, en se décomposant, la litière de racines et de feuilles du
2
peuplier faux-tremble retourne une partie des éléments nutritifs absorbés dans le sol, les rendant ainsi disponibles pour les semis de conifères (Van Cleve et al. 1983, Paré et Van Cleve 1993, Wang et al. 1995, Légaré et al. 2005, Laganière et al. 2010). Le bouleau accumule lui aussi de grandes concentrations d’éléments nutritifs dans son feuillage (Wang et al. 1996). Le cyclage rapide des éléments contenus dans la litière de ces deux espèces pourrait s’avérer particulièrement utile sur des sites pauvres ou pour atténuer les effets négatifs de l’épinette noire sur le cyclage des éléments nutritifs (Man et Lieffers 1999a, Légaré et al. 2004). Simard et al. (1997) ainsi que Philip et al. (2010) ont également observé que des connexions mycorhiziennes permettent au bouleau à papier et au sapin de Douglas (Pseudotsuga menziesii (Mirb.) Franco) d’effectuer des transferts de carbone bidirectionnels. Le sapin de Douglas peut ainsi bénéficier d’un gain en carbone, lorsqu’il est en présence de bouleau à papier (Philip et al. 2010). De plus, Man et Lieffers (1999a, 1999b) ont observé que la présence d’un couvert résiduel de peupliers faux-trembles augmente l’humidité en sous-étage, diminue les problèmes de gels des semis et pourrait offrir une protection contre la photoinhibition, ce qui semble bénéficier à l’épinette blanche (Picea glauca (Moench) Voss). Dans un même ordre d’idées, les bouleaux créent de l’ombrage qui pourrait protéger les épinettes blanches contre la photoinhibition, la photooxidation ainsi que les extrêmes de température et d’humidité (Man et Greenway 2011). La présence de peupliers faux-trembles et de bouleaux à papier permettrait aussi d’atténuer la mortalité par le pourridié-agaric chez le sapin baumier, le mélèze laricin (Larix laricina (Du Roi) K. Koch) et l’épinette noire (Morrison et Mallett 1996, Gerlach et al. 1997). Dans des peuplements composés d’un mélange de bouleaux à papier et d’épinettes blanches, les problèmes de compétition commenceraient à se faire sentir lorsque les densités de bouleau dépassent 3000 à 4000 tiges par hectare (Hawkins et al. 2012, Hawkins et Dhar 2013). Dans des peuplements composés d’un mélange de peuplier faux-tremble et d’épinettes noires, Légaré et al. (2004) ont observé qu’à l’échelle du peuplement, les problèmes de compétition commencent à survenir quand le pourcentage en surface terrière du peuplier est supérieur à 41%.
L’aulne rugueux (Alnus incana subsp. rugosa (Du Roi) J. Clausen), l’érable à épis (Acer
spicatum Lam.) et le cerisier de Pennsylvanie (Prunus pensylvanica L. f.) sont d’autres
espèces feuillues fréquemment rencontrées en forêt boréale et ne possèdent actuellement aucune valeur commerciale. Elles semblent principalement inhiber la croissance des résineux en exerçant une compétition pour la lumière (Bell 1991, Jobidon 2000). En effet, l’aulne rugueux forme souvent un couvert très dense pouvant empêcher
3
l’établissement des conifères (Jobidon 1995). Par contre, cette espèce peut aussi fixer l’azote atmosphérique et en stocker une partie dans ses feuilles (Fortin et al. 1983, Hurd et al. 2001, Kaelke et Dawson 2003, Tobita et al. 2016). La litière de l’aulne rugueux se décompose rapidement et permet un cyclage rapide des éléments nutritifs (Daly 1966). À faible densité, cet arbuste pourrait donc faciliter la croissance des résineux en enrichissant le sol (Watt et Heinselman 1965, Johnston 1972, Jutras et al. 2006), ce qui pourrait être particulièrement avantageux sur des sites pauvres. L’érable à épis envahit rapidement les sites ayant bénéficié d’une ouverture de la canopée et forme des couverts denses pouvant supprimer les autres espèces pendant 30 à 60 ans (Vincent 1965, Archambault et al. 1998, De Grandpré et al. 2000). Cette espèce exerce également une compétition pour l’eau et sa litière inhibe la germination des résineux (Vincent 1965, Bell 1991, Jobidon 1995, Boulet et Beaudet 2013). L’érable à épis et le cerisier de Pennsylvanie constituent aussi des sources de nourriture et des couverts de protection pour des lièvres qui peuvent brouter de jeunes conifères situés à proximité (Parker 1984, Bell 1991). Le cerisier de Pennsylvanie peut également exercer une compétition pour l’eau et les éléments nutritifs (Bell 1991).
Les éricacées peuvent rapidement envahir un site à la suite d’une perturbation comme un feu ou une coupe (van Nostrand 1971, Viereck 1983, Mallik 1995, Hébert et al. 2010a). Le niveau d’inhibition et les mécanismes de compétition affectant la croissance des conifères peuvent varier en fonction de l’espèce éricacée et du type de site (Mallik 2003). Dans la zone boréale du Québec, la concurrence par les éricacées est principalement constituée du thé du Labrador (Rhododendron groenlandicum (Oeder) K.A. Kron et Judd), du kalmia à feuilles étroites (Kalmia angustifolia L.) et des bleuetiers (Vaccinium spp.) (Thiffault et Roy 2011). Ces espèces peuvent interférer avec la croissance des conifères en compétitionnant directement pour les nutriments (Thiffault et al. 2004b, Hébert et al. 2010b). Elles peuvent également s’associer à des mycorhizes éricoïdes qui les aideront à assimiler de l’azote (Malloch et Malloch 1981, Goulart et al. 1993, Mayor et al. 2012). Le feuillage du kalmia contient des composés phénoliques pouvant inhiber les mycorhizes bénéfiques aux conifères (Titus et al. 1995). Par contre, Yamasaki et al. (1998) ont observé que le cette plante favorise la présence de
Phialocephala dimorphospora, une pseudo-mycorhize qui nuit à la croissance de
l’épinette noire (Richard et Fortin 1970). Le feuillage du kalmia contient aussi des composés pouvant inhiber la germination (Titus et al. 1995) et la croissance primaire des racines de l’épinette noire (Peterson 1965, Mallik 1987, Zhu et Mallik 1994). De plus, les tanins produits par cette plante réduisent la minéralisation de l’azote, possiblement
4
en inhibant l’activité enzymatique du sol ou en formant des complexes de protéines et de tanins (Bradley et al. 2000, Joanisse et al. 2007, 2009). C’est toutefois la compétition racinaire causée par le kalmia qui semble avoir le plus d’impact sur la croissance de l’épinette noire (Mallik et al. 2016). Le système racinaire extensif du kalmia lui permettrait d’accéder à un plus grand volume de sol, ce qui l’avantagerait face à l’épinette noire pour l’absorption de l’eau et des nutriments (Inderjit et Mallik 2002, Thiffault et al. 2004b, Mallik et al. 2016). Le feuillage du bleuet à feuilles étroites (Vaccinium angustifolium Aiton) aurait une capacité légèrement inférieure à celle du kalmia à inhiber la germination des semences d’épinettes noires (Titus et al. 1995). Les composés phénoliques présents dans le feuillage et la litière du thé du Labrador vont modifier la disponibilité des éléments nutritifs du sol (Inderjit et Mallik 1997). D’autre part, le kalmia et le thé du Labrador favorisent une accumulation de la couche de matière organique (Damman 1971, Inderjit et Mallik 1996), ce qui affecte négativement la croissance des semis résineux (Lavoie et al. 2007) en diminuant la qualité du lit de germination (Greene et al. 2007) et en abaissant la température du sol (Balisky et Burton 1997, Thiffault et al. 2004b).
Une gestion avisée de la végétation concurrente nécessite une compréhension des facteurs influençant son abondance ainsi que de l’impact de cette végétation sur les essences désirées. Or, peu d’études ont évalué les effets simultanés de différentes variables sur la présence des espèces concurrentes. Une caractérisation des variables biophysiques (c.-à-d. l’altitude, le drainage, les régions écologiques, perturbation d’origine du peuplement avant la coupe, composition du peuplement avant la coupe et les dépôts de surface) et des caractéristiques de récolte (c.-à-d. le procédé de récolte et la saison de la récolte) favorisant le développement de ces espèces permettrait de mieux prédire les sites où des travaux d’entretien seraient nécessaires et où une baisse de productivité devrait être attendue.
L’objectif principal de cette étude était donc d’identifier les problèmes de régénération liés à la compétition par les éricacées et les feuillus en fonction de la composition initiale du peuplement, des caractéristiques du site et des régions écologiques de la forêt boréale. Nos objectifs spécifiques étaient : i) d’identifier les caractéristiques de récolte et les variables biophysiques significativement corrélées à la présence de la végétation concurrente, ii) d’estimer la probabilité d’observer un groupe de végétation concurrente donné en fonction des caractéristiques de récolte et les variables biophysiques, et iii) d’évaluer l’impact de la végétation concurrente sur la régénération désirée lorsque
celle-5
ci est marginale. Nous avons donc émis l’hypothèse que la composition de la végétation concurrente pouvait être liée à des variables biophysiques et des caractéristiques de récolte. De plus, nous avons prédit que la nature et l’abondance de la végétation concurrente est principalement fonction des caractéristiques biophysiques. Finalement, nous avons avancé que l’intensité et la nature de la compétition devraient avoir une influence déterminante sur l’évolution de la régénération dans les zones récoltées comportant une régénération résineuse marginale. À des niveaux de compétition faibles, nous nous attendions à une augmentation de la régénération résineuse avec le temps, alors que sous des niveaux de compétition élevés, nous nous attendions à ce que le coefficient de distribution des tiges libres de croître, la surface terrière et la vigueur des jeunes résineux restent similaires ou diminuent avec le temps.
6
Chapitre 1. Abundance and impacts of competing
species on conifer regeneration following careful
logging in the eastern-Canadian boreal forest
Abstract
Conifers represent an important part of forest economy in northern countries. After harvesting, competing species can quickly invade cutovers and impair conifer regeneration establishment, with significant impacts on long-term site productivity. Our objective was to identify the biophysical and harvesting characteristics associated with ericaceous and hardwoods competing species that cause competition problems to conifers, so that reforestation or tending efforts could be better planned.
To do so, we linked data from the monitoring of 4,471 transects realized between 2007 and 2011 to data relating to elevation, ecological classification, soil attributes, and pre-harvest forest stands. We analyzed this assemblage of data to study the relationships between competing vegetation and harvesting and biophysical variables. We then estimated the probability of observing a given competing species cover based on these variables. In 2015, we re-sampled a portion of the sites to assess the temporal impact of different competing levels on the stocking, vigour and basal area of softwood regeneration, where conifer regeneration was marginal early after cutting.
Analysis of the data from the 2007-2011 inventory showed that, after a cut with protection of regeneration and soils, ericaceous shrubs and hardwoods were not associated with the same sets of sites features. Ericaceous shrubs were mainly found in low fertility sites associated with black spruce and jack pine. The distinction between suitable environments for commercial shade-intolerant hardwoods and non-commercial hardwoods was less clear, as they responded similarly to many variables. Analysis of data from the 2015 inventory showed a significant improvement in conifer stocking when commercial shade intolerant hardwood competing levels were low (stocking 0-40%) and when ericaceous shrubs competing levels were moderate (percent cover 26-75%). The different types and intensities of competition did not appear to affect the vigour or the basal area of softwood regeneration, 9 to 14 years after harvesting.
7
Introduction
Conifers represent an important part of forest economy in northern countries. However, after harvesting, some hardwoods and ericaceous shrubs can quickly invade cutovers and prevent or slow down conifer regeneration establishment.
In fact, hardwoods can both facilitate or impede conifers’ growth and survival. Facilitation can happen by providing better protection against insects, disease, photoinhibition, photooxidation, temperature and moisture extremes (MacLean 1996, Gerlach et al. 1997, Man and Lieffers 1999a, 1999b, Man and Greenway 2011), by improving soil productivity (Fortin et al. 1983, Bradley and Fyles 1995, Wang et al. 1996, Laganière et al. 2010), or by nutrient gains through associations with mycorrhizae (Simard et al. 1997, Philip et al. 2010). Competition can occur through the interception of a part of the light (Jobidon 2000, Comeau et al. 2003, Filipescu and Comeau 2007), water (Lieffers et al. 1993, Jobidon 1995) and nutrients (Lieffers et al. 1993, Simard and Sachs 2004). Hardwoods can also cause physical damages to conifer seedlings by whipping (Kagis 1952, Man and Lieffers 1999a, Bell et al. 2011). Competing problems seem to occur when hardwoods reach a certain density threshold that varies depending on species (Légaré et al. 2004, Hawkins et al. 2012, Hawkins and Dhar 2013).
Ericaceous shrubs can quickly invade a site after a disturbance such as fires or harvesting operations (van Nostrand 1971, Viereck 1983, Mallik 1995, Hébert et al. 2010a). These plants may directly inhibit conifers’ growth through competition for nutrients (Thiffault et al. 2004b, Hébert et al. 2010b). Additionally, ericaceous shrubs can impede conifer germination and primary root growth through allelopathy (Peterson 1965, Mallik 1987, Zhu and Mallik 1994, Titus et al. 1995, Mallik and Pellissier 2000). Tannins and other polyphenols present in the litter or roots of ericaceous plants cause allelopathy and can also lead to a nutrient imbalance in the soil (Jäderlund et al. 1996, Castells et al. 2005, LeBel et al. 2008). Some ericaceous species favour a thickening of the organic layer (Damman 1971, Inderjit and Mallik 1996, DeLuca et al. 2002), which negatively affects conifer growth (Lavoie et al. 2007) by decreasing the quality of the seed bed (Greene et al. 2007) and lowering soil temperature during summer (Balisky and Burton 1997, Thiffault et al. 2004b). Ericaceous shrubs are also associated with ericoid mycorrhiza that helps absorbing nitrogen in organic forms (Malloch and Malloch 1981, Goulart et al. 1993, Read et al. 2004, Mayor et al. 2012). Allelopathic substances can also inhibit the production of mycorrhizae that benefits conifers and, sometimes, favour the presence of
8
pseudo-mycorrhizae on coniferous roots (Robinson 1972, Yamasaki et al. 1998, Javaid 2007). The inhibition level and competition mechanisms affecting conifer growth may vary depending on ericaceous species, coniferous species and site types (Mallik 2003). For example, black spruce regeneration failure in presence of sheep laurel (Kalmia
angustifolia L.) is mainly caused by root growth inhibition, nutrient deficiency, and
competition (Mallik, 1987, 2003; Mallik and Newton, 1988), while Norway spruce regeneration problems in presence of bilberry (Vaccinium myrtilus) is mostly due to the germination inhibition (Pellissier, 1993, 1994; Mallik and Pellissier, 2000, Mallik 2003).
Management of competing vegetation requires an understanding of the factors influencing its abundance and its impacts on the most commercially desired species. A characterization of biophysical (e.g. pre-harvest stand dominant species group, type and year of the original disturbances, drainage, surficial materials, ecological region, elevation) and harvesting (e.g. harvesting method, harvesting season) characteristics favouring the development of these species would enable predicting sites where site preparation or tending operations would be required, based on biophysical characteristics and forest planning.
The main objective of our study was to identify regeneration problems related to competition by ericaceous shrubs and hardwoods in relation to initial stand composition, site characteristics and ecological units in the eastern Canadian boreal forest. Our specific objectives were to i) identify the harvesting characteristics and biophysical variables that are significantly correlated to competing vegetation dominance, ii) estimate the probability of observing a given competing species group according to harvesting and environmental characteristics, and iii) assess the impact of competing vegetation on conifer vigour and sapling basal area in cases of marginal regeneration. Therefore, we hypothesized that competing vegetation composition could be linked to harvesting and environmental characteristics. Also, we predicted that nature and abundance of competing vegetation is primarily a function of biophysical characteristics. Finally, we posited that competing vegetation intensity and nature should have a decisive influence on regeneration evolution on harvested areas featuring marginal softwood regeneration. Under low competition levels, we expected softwood regeneration to increase over time, whereas under high competition levels, we anticipated conifer saplings’ free to grow stocking, basal area and vigour to remain similar or decrease over time.
9
Materials and Methods
Study area
The study area is located in northern Quebec, Canada, between 48°29'34.44"N and 50°47'44.16"N of latitude and 74°24'15.12"W and 71°8'20.4"W of longitude (Fig. 1). Inventory sites are found in the western balsam fir-white birch bioclimatic sub region (which includes ecological regions 5c and 5d), the eastern black spruce-moss bioclimatic sub region (which includes ecological region 6h) and western black spruce-moss bioclimatic sub region (which includes ecological regions 6c, 6d and 6g) and the northern part of the eastern balsam fir-yellow birch bioclimatic sub region (which includes ecological region 4e) (Saucier et al. 2009). The climate is characterized by a mean annual temperature ranging from -2.0 to 2.5 °C and mean annual precipitations ranging from 850 to 1450 mm (Saucier et al. 2009). Fires and insect outbreaks are the main disturbances driving forest dynamics in the study area (Saucier et al. 2009). Conifer stands dominate in the northern part of the study region (85%, area-based), followed by mixed wood stands (5–10%) and northern hardwood stands (2–3%) (Morneau and Landry 2007). The proportion of mixed and hardwood stands increases from north to south. The most common conifer species are black spruce (Picea mariana (Mill.) B.S.P.), balsam fir (Abies balsamea (L.) Mill.) and jack pine (Pinus banksiana Lamb.). The most common hardwoods are trembling aspen (Populus tremuloides Michx.) and paper birch (Betula papyrifera Marsh.) (Saucier et al. 2009). Even though they have commercial values, these hardwoods are often considered as competing species because they can impede the growth and survival of the more economically valuable conifers. Other common competing hardwoods are mountain maple (Acer spicatum Lam.), pin cherry (Prunus pensylvanica L. f.) and speckled alder (Alnus incana subsp. rugosa (Du Roi) J. Clausen) (Thiffault and Roy 2011, Cauboue 2013). Ericaceous competition is mainly caused by bog Labrador tea (Rhododendron groenlandicum (Oeder) K.A. Kron and Judd), sheep laurel and blueberries (Vaccinium spp.) (Thiffault and Roy 2011).
10
Figure 1. Location of the study area and sampling sites in Quebec (Canada). Gray dots represent transects from the 2007-2011’s inventory and red dots represent transects that have been re-sampled in 2015. Ecological regions are those defined by Saucier et al. (2009).
11
Creation of a first database
We created a database (further referred to as "database 1") using four data sources: i) inventory data from the monitoring of regenerating stands in the study region following harvesting by cutting with protection of regeneration and soils (CPRS) between 2001 and 2006, ii) hypsometric data from governmental topographic maps (Québec 1999), iii) ecological classification data from the governmental ecological classification system (Québec 2016), and iv) pre-harvest forest stands and soil attributes from the governmental forest ecological survey dataset (Létourneau et al. 2009).
Data from the monitoring of post-harvest regenerating stands
We used data collected between 2007 and 2011, by AbitibiBowater Inc. (now Resolute Forest Products Inc.) in post-harvest regenerating stands. Monitoring was conducted within the first eight years (usually four or five years) following operational CPRS. Sampling was conducted in north-oriented transects of 10 micro-plots (sometimes less) separated 5 m from each other (centre to centre). Each micro-plot consisted in two superimposed circular plots with radii of either 1.13 m (plots ≈ 4 m2) for conifer observations, or 1.69 m (plots ≈ 9 m2) for hardwood observations (MRNF 2011; Fig. 2A). Data collected in each micro-plot consisted in 1) presence/absence of regenerating trees by species and height class (15–30 cm, 30–60 cm, 60–100 cm, >100 cm), and 2) percent cover for groups of competing species (ericaceous shrubs and non-commercial hardwoods) using 25% classes (0%, 1–25%, 26–50%, 51–75%, 76–100%). Non-commercial hardwoods and ericaceous shrubs were treated as groups during the monitoring to limit time and money expenses (i.e. percent covers were collected by groups and not by species). Using data from the micro-plots, we calculated stocking at the transect level by species (spruce sp., balsam fir, jack pine, trembling aspen, paper birch) and species groups (conifers, hardwoods).
For each transect, metadata from the inventory was cross-validated using external data sources (Bournival et al. 2014). Stand ages were adjusted according to known harvesting dates, and harvesting seasons were verified using Landsat images. Presence/absence of delimbing areas, skidding cones and orthogonal trails were used to validate the use of cut-to-length or full tree harvesting methods. Transect localization was also validated; when coordinates pointed to forest roads, gravel pits or outside a
12
CPRS cutblock, transects were removed from the database. Sites that had been affected by wildfires since 1969 were also eliminated from the database.
Hypsometric data from topographic maps
We used hypsometric data from Quebec’s topographic database to determine transect elevation a.s.l. We converted the contour lines into a "smooth layer" using the "Topo to
raster", "Int" and "Raster to polygon" tools of software ArcMAP 10.2 (ESRI, Redlands,
CA, USA). We then used the "Intersect" tool of ArcMAP to verify where the transects intersected the layer and extracted the corresponding elevation value. Altitude ranged from 177 to 702 m a.s.l.
Ecological classification data from the governmental ecological
classification system
The Ecological Land Classification system of Quebec describes ecosystem characteristics at various scales, based on ecological variables related to the vegetation, the physical environment, and climate (see Saucier et al. 2009 for details). Using this system, we associated each transects to the corresponding ecological region (Fig. 1), a hierarchical level of the ecological classification characterized by the composition and dynamics of the vegetation growing on mesic sites, and by the distribution of ecological types within the landscape.
Forest stands and soil attributes from forest ecological survey datasets
For each transect, we obtained information about the pre-harvest stand using ecological forest maps. We included information about drainage, surficial materials as well as the type and year of the original disturbance. Sites classified as alder groves, dry barrens or wet barrens were discarded, being considered as unproductive from a forest management perspective. As a result, 4,471 transects were retained, representing 43,972 microplots distributed in 1,277 cutblocks.
Creation of a second database
During summer 2015, we performed a stratified inventory in 72 of the transects from "database 1" to evaluate conifer regeneration and competing vegetation. This led to the creation of a new database (further referred to as "database 2") created from: 1)
13
vegetation and soil data collected during the 2015 inventory, and 2) initial data from the 72 corresponding transects in "database 1".
Stratified inventory
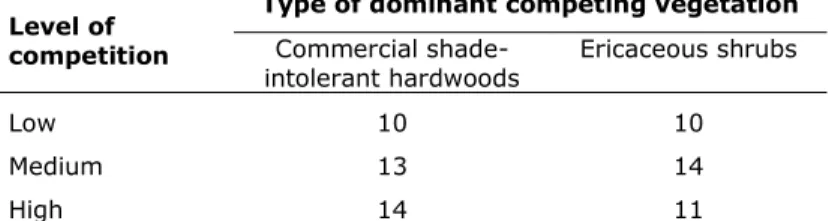
We selected 72 transects from database 1 that had an initial free-to-grow (FTG) conifer stocking varying between 40 and 60% and that were still accessible in 2015. FTG implied that no vegetation within a 1 m radius exceeded half the height of the target tree (Méthot et al. 2014). Five years after harvesting, a conifer stocking of 60% is about the minimum threshold for a stand to reach maximum yield at maturity (Pominville and Ruel 1995) and, in practice, a site is generally considered as non-regenerated when its commercial species stocking is less than 40% (Pominville and Doucet 1993, Agence régionale de mise en valeur des forêts privées de la Gaspésie-Les-îles 2013, Agence Forestière Lac St-Jean and Agence Forestière Saguenay 2014). Between these two thresholds, conifer establishment success is uncertain. It is therefore important to better understand the impact of competing vegetation on coniferous regeneration under those circumstances.
Sites were divided into three strata representing the initial level of competing vegetation (low, medium, high; see Table 1) and two strata representing the initial type of dominant competing vegetation (Table 1). Sites initially dominated by non-commercial hardwoods were not included in the stratification due to a lack of transects belonging to the “high” level of competition. Transects that had been submitted to mechanical site preparation and/or plantation were also avoided.
Table 1. Distribution of transects in the stratified inventory based on dominance by competing vegetation groups and levels of competition.
Level of competition
Type of dominant competing vegetation
Commercial
shade-intolerant hardwoods Ericaceous shrubs
Low 10 10
Medium 13 14
High 14 11
Ericaceous shrubs: low = percent cover between 1–25%, medium = percent cover between 26–75%, high = percent cover between 76–100%. Commercial shade-intolerant hardwoods: low = stocking between 0–40%, medium = stocking between 40–60%, high = stocking between 60–100%.
Based on the initial sampling, we established transects of 10 circular micro-plots separated by 5 m from each other, except for the fifth whose centre was distanced 7 m from the adjacent micro-plots (Fig. 2B). Micro-plot areas were similar to the ones used in the initial sampling (radius of 1.13 m and 1.69 m for conifer and hardwood
14
observations, respectively); vegetation cover estimation was conducted in a similar manner. In each micro-plots (Fig. 2B), we noted the presence/absence and FTG status of regeneration by species and height class (15–30 cm, 30–60 cm, 60–100 cm and more than 100 cm).
Saplings (defined as having a diameter at breast height, DBH > 1.0 cm and < 9,1 cm) were counted in a 5.64 m radius plot superimposed on the fifth micro-plot (Fig. 2B). In this micro-plot, three sample-trees representative of the modal height of the regeneration were selected; we noted the species, height, length of the live crown, length of the terminal shoot and length of the longest lateral branch of the last whorl. Tree height and length of the live crown were used to calculate a live crown ratio (Seidel 1980, Ruel and Doucet 1998, Ruel et al. 2000). Length of the terminal shoot and length of the longest lateral branch of the last whorl were used to calculate an apical dominance ratio (Kohyama 1980, Klinka et al. 1992, Parent and Messier 1995). Live crown ratio and apical dominance ratio are two indices used to estimate conifer vigour.
Figure 2. (A) Configuration of the micro-plots in a transect used in the 2007-2011 monitoring of post-harvest regenerating stands. (B) Configuration of the plot and the microplots in a transect for the 2015 stratified inventory.
Data analysis
Variables significantly linked to competing vegetation cover
To achieve objective i), we used data from database 1 to perform a redundancy analysis (RDA ; Borcard et al. 2011) using the vegan package (Oksanen et al. 2017) in R version 3.3.3 (R Core Team 2017). We split the data into two matrices. The first matrix (the Y
N E 1 W 5m 1 2 3 4 5 6 7 8 9 10 5,64m
1.13 m radius for conifers.
7m
The center of the fifth plot is georeferenced.
1,69 m radius for hardwoods
5m
1 2 3 4 5 6 7 8 9 10
1.13 m radius for conifers.
The center of the transect is georeferenced.
1,69 m radius for hardwood A B S
15
matrix) contained the dependent variables, namely, the percent cover of ericaceous shrubs, the percent cover of non-commercial hardwoods and the stocking of commercial shade-intolerant hardwoods. The second matrix (the X matrix) contained explanatory variables, namely, harvesting and forest characteristics such as pre-harvest stand dominant species group, type and year of the original disturbances, drainage, surficial materials, ecological region, elevation, harvesting method and harvesting season. Before the RDA, we kept explanatory variables containing more than 20 observations (n > 20), to detect reasonable size effects with reasonable power (Harrell 2015). We also applied a Hellinger transformation to the Y matrix to give low weights to variables with low counts and many zeros and thus maintain an ecologically meaningful distance among sites in the ordination (Legendre and Gallagher 2001). We also performed a forward selection using a double-stopping criterion (Blanchet et al. 2008) to select the best subset of explanatory variables and avoid strong multicollinearity. We verified multicollinearity by making sure variance inflation factors (VIF) were <10 for the explanatory variables (Borcard et al. 2011).
Probability of observing a given competing species cover
To achieve objective ii), we performed a linear mixed effects analysis (LMM; Zuur et al. 2009) of the commercial shade-intolerant hardwood stocking with the lme4 package (Bates et al. 2015) in R. Degrees of freedom and p-values for the LMM were obtained using the lmerTest package (Kuznetsova et al. 2016). We also performed two cumulative link mixed analyses (CLMM; Agresti 2002) of the cover of non-commercial hardwoods and ericaceous shrubs with the ordinal package (Christensen 2015). For LMM and CLMMs, cutblocks were used as a random effect factor and the X variables identified in the RDA were used as fixed effects. Commercial shade-intolerant hardwood stocking was used as a dependent variable for the LMM and percent cover of ericaceous shrubs or commercial shade-intolerant hardwoods were used as dependent variables for the CLMMs. We calculated a pseudo-R2 for the LMM with the MuMIn package (Barton 2016).
Regeneration on sites with marginal FTG stocking
To achieve objective iii) we performed four mixed ANOVAs (also referred to as “nested ANOVA”; McDonald 2014) on data from “database 2” using the nlme package (Pinheiro et al. 2017) and the anova function of R. When a significant effect was detected (p < 0.05) for an interaction or a main effect, we proceeded to a pairwise comparison of the least square means with the lsmeans package (Lenth 2016) to determine if the
16
differences between means were significant (p < 0.05). For the first mixed ANOVA, we checked whether the competing cover type and level affected free-to-grow conifer stocking where conifer regeneration success was uncertain. To do so, we used the conifer stocking measured in both inventories as a dependent variable and the six strata of competing cover (Table 1), as well as the time of the inventory (1 for the first inventory, 2 for the second) as fixed effects. For the random effects, we used sites (to account for the repeated measures) and cutblocks (to account for the nested design). We tested for interaction between time and competing vegetation cover. For the second and third analyses, we asked if the competing level measured during the first inventory influenced the vigour of the conifer regeneration assessed at the second inventory. To do so, we relied on the two vigour indices (live crown ratio and apical index) and performed a mixed ANOVA using each of these as dependent variables and strata of competing covers as a fixed effect. We used cutblocks as a random effect to account for the nested design. Finally, we asked if the competing level measured in the first inventory influenced sapling basal area measured in the second inventory. To do so, we used sapling basal area as a dependent variable and the six strata of competing covers as a fixed effect. To account for the nested design, we used cutblocks as a random effect.
17
Results
Variables significantly linked to competing vegetation cover
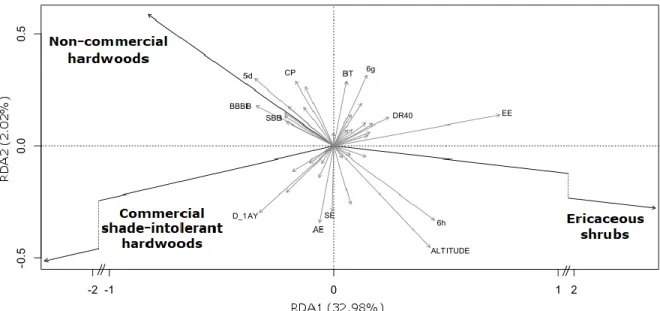
Explanatory variables (Table 2) selected for the RDA accounted for 35.3% of the variation in the composition of competing vegetation; axes 1 and 2 respectively explained 32.98% and 2.02% of the variance (Fig. 3). Permutation tests indicate that the global model and canonical axes were significant at p = 0.001. Axis 1, which contains most of the information, contrasts conditions associated with ericaceous shrubs and those associated with other competing vegetation types. The ericaceous shrubs were positively correlated with imperfect drainage, altitude, hills of Lake Péribonka and pre-harvest stands dominated by black spruce (Fig. 3). Hardwoods were negatively correlated with all the above and positively correlated to the hills surrounding Lake Saint-Jean, tills 50-100 cm thick, harvest stands dominated by paper birch and pre-harvest stands dominated by both balsam fir and paper birch. Non-commercial hardwoods were also positively correlated to partial harvesting.
18
Table 2. Description of the independent variables identified in the RDA and later used in the linear mixed model and the cumulative link mixed models.
Theme Code Description
Altitude ALTITUDE Altitude Drainage DR20 Good
DR31 Moderate and lateral DR40 Imperfect
DR50 poor
Ecological region 4e Plain of Lake Saint-Jean and Saguenay 5d Hills surrounding Lake Saint-Jean 6c The plain of Lake Opemisca 6g Hillsides of Lake Manouane 6h Hills of Lake Péribonka Harvesting method AE Full tree harvesting
BT Cut-to-length logging MA Manual harvesting Harvesting season AUT Harvested in fall
ÉTÉ Harvested in summer HIV Harvested in winter Pre-harvest stand’s
original disturbance CHP CHT_M Partial windthrow Total windthrow CP Partial harvesting CT_M Clearcutting EL Mild epidemic
Pre-harvest stand BBBB Betula papyrifera (>75% a)
BBBBE Betula papyrifera (>75% a) with Picea mariana (>50% b)
BBBBS Betula papyrifera (>75% a) with Abies balsamea (>50% b)
BBPE Betula papyrifera (50-75% a) with Populus tremuloides (25%-50% a)
BJmR Betula alleghaniensis (25%-50% of the basal area) with conifers
EBB Picea mariana (>50% b) with Betula papyrifera (>50% a)
EE Picea mariana (>75% b)
EPG Picea mariana (50-75% b) with Pinus banksiana
ES Picea mariana (50-75% b) with Abies balsamea
PGE Pinus banksiana (50-75% b) with Picea mariana
PGPE Pinus banksiana (>50% b) with Populus tremuloides (>50% a)
PGPG Pinus banksiana (>75% b)
SBB Abies balsamea (>50% b) with Betula papyrifera (>50% a)
SE Abies balsamea (50-75% b) with Picea mariana
Surficial materials D_1AY Till (50-100cm) D_1BP Disintegration moraine D_2A Juxtaglacial deposits D_2BE Outwash
D_7T Thin organic deposits
a of the hardwood basal area b of the conifer basal area
19
Figure 3. RDA ordination biplot showing the correlation between competing species groups (black arrows) and explanatory variables selected using a forward selection approach (grey arrows). Only variables with the highest contribution to axes RDA1 or RDA2 are labeled (i.e. coordinate on one axis was > 90th quantile or < 10th quantile of the distribution of variables coordinates on the same axis). Refer to Table 2 for variables description.
Probability of observing a given competing species cover
The LMM produced for the commercial shade-intolerant hardwoods had a marginal pseudo-R2 of 0.34. It’s coefficient estimates (Table 3) show that the chances of observing commercial shade-intolerant hardwoods significantly increased in presence of good drainage, full tree harvesting, tills 50-100 cm thick, and pre-harvest stands dominated by paper birch and accompanied by trembling aspen. These chances significantly decreased in presence of imperfect drainage, ecological regions 6g or 6h, winter harvesting, pre-harvest stands originating from total windthrow, clearcutting or mild epidemic, pre-harvest paper birch stands, pre-harvest stands containing black spruce or jack pine as a dominant or co-dominant species, disintegration moraine, juxtaglacial deposit, and outwash.
20
Table 3. Summary of the linear mixed models predicting commercial shade-intolerant hardwood stocking as a function of harvesting and biophysical variables.
Theme Variable Estimate Standard Error df t value Pr(>|t|)
- (Intercept) 0.54370 0.05373 1531 10.120 < 0.001 Altitude ALTITUDE 0.00009 0.00008 1900 1.153 0.249 Drainage DR20 0.07027 0.01119 4309 6.278 < 0.001 DR31 -0.01313 0.02284 4464 -0.575 0.565 DR40 -0.06080 0.01560 4452 -3.897 < 0.001 DR50 -0.10780 0.06686 4468 -1.613 0.107 Ecological region 4e 0.06302 0.05910 1443 1.066 0.286 5d 0.02577 0.01754 1470 1.469 0.142 6c -0.11330 0.07517 1213 -1.507 0.132 6g -0.13250 0.06537 2211 -2.027 0.043 6h -0.22990 0.02273 949 -10.116 < 0.001 Harvesting method AE 0.07429 0.02909 1068 2.554 0.011 BT -0.03012 0.02895 1061 -1.040 0.299 MA 0.05013 0.05282 1333 0.949 0.343 Harvesting season AUT -0.04905 0.02591 1494 -1.893 0.059 ÉTÉ -0.01959 0.02511 1674 -0.780 0.435 HIV -0.11760 0.02502 1437 -4.699 < 0.001 Pre-harvest stand’s original disturbance CHP -0.02564 0.02166 4470 -1.184 0.237 CHT_M -0.19060 0.05479 4276 -3.480 < 0.001 CP -0.01894 0.03065 3683 -0.618 0.537 CT_M -0.16920 0.03891 4439 -4.348 < 0.001 EL -0.04465 0.01382 4099 -3.232 0.001 Pre-harvest stand BBBB -0.05861 0.02013 3702 -2.912 0.004 BBBBE -0.09851 0.02590 4373 -3.804 < 0.001 BBBBS -0.04788 0.03123 4303 -1.533 0.125 BBPE 0.07814 0.02977 3557 2.624 0.009 BJmR -0.10780 0.05573 3560 -1.935 0.053 EBB -0.11740 0.02796 4462 -4.199 < 0.001 EE -0.28480 0.01368 4099 -20.815 < 0.001 EPG -0.25630 0.02618 3929 -9.789 < 0.001 ES -0.15870 0.01834 4444 -8.656 < 0.001 PGE -0.24760 0.02642 4209 -9.372 < 0.001 PGPG -0.14080 0.03621 3425 -3.889 < 0.001 SBB -0.04816 0.02719 4206 -1.771 0.077 SE -0.11720 0.02307 4470 -5.082 < 0.001
Surficial materials D_1AY 0.06825 0.00954 4388 7.157 < 0.001
D_1BP -0.10830 0.04932 4407 -2.196 0.028
D_2A -0.13000 0.02921 3908 -4.451 < 0.001
D_2BE -0.14630 0.03152 3843 -4.642 < 0.001
D_7T -0.06660 0.06767 4460 -0.984 0.325 Refer to Table 2 for variable description. Bold indicate significance at α = 0.05.
21
Proportional odds assumption was not met for the CLMMs of the ericaceous shrubs and non-commercial hardwoods; the explanatory variables did not have the same effect on the odds from one threshold to another. This assumption is however rarely met (Harrell 2015), especially in presence of many explanatory variables and a large sample size (O’Connell 2006), like in our case. However, these models can still be useful (Harrell 2015); estimates obtained from both models (Tables 4 and 5) provided a general idea of the changes in competing species’ percent cover induced by the explanatory variables. Furthermore, for both CLMMs, altitude was put aside to avoid convergence problems.
The CLMM’s coefficient estimates (Table 4) show that the chances of observing non-commercial hardwoods significantly increased in presence of good drainage, in ecological regions 4e or 5d, in pre-harvest stands originating from partial windthrow or partial harvesting, in pre-harvest paper birch stands and pre-harvest stands dominated by paper birch with balsam fir or trembling aspen as companion species. These chances significantly decreased in presence of imperfect or poor drainage, in ecological region 6h, in pre-harvest stands originating from total windthrow, in pre-harvest stands dominated by black spruce, in pre-harvest stands dominated by jack pine, in pre-harvest stands dominated by balsam fir and accompanied by black spruce, in disintegration moraine, juxtaglacial deposit and outwash.
The chances of observing ericaceous shrubs (Table 5) significantly increased in ecological region 6h, following winter harvesting, in pre-harvest stands originating from total windthrow, clearcutting, in pre-harvest stands dominated by paper birch and accompanied by black spruce, pre-harvest stands dominated by black spruce or jack pine, in juxtaglacial deposits and in outwash. Those chances significantly decreased in presence of the ecological regions 4e or 5d, full tree harvesting, cut-to-length logging, pre-harvest stands originating from partial windthrow or mild epidemic, pre-harvest paper birch stands, pre-harvest stands dominated by paper birch with balsam fir or trembling aspen as companion species, pre-harvest stands dominated by balsam fir with paper birch as companion species.
22
Table 4. Threshold coefficients and summary of the cumulative link mixed model predicting non-commercial hardwood percent cover as a function of harvesting and biophysical variables.
Threshold coefficients
Threshold Estimate Std. Error z value
0|0.13 -5.0714 0.4069 -12.463 0.13|0.38 0.3689 0.3915 0.942 0.38|0.63 2.5542 0.3977 6.422 0.63|0.88 4.9381 0.4204 11.746
Summary of the cumulative link mixed model
Theme Variable Estimate Std. Error z value Pr(>|z|)
Drainage DR20 0.3812 0.1114 3.422 0.001 DR31 0.0696 0.2300 0.303 0.762 DR40 -0.4878 0.1657 -2.943 0.003 DR50 -2.3104 0.6536 -3.535 < 0.001 Ecological region 4e 2.5180 0.5172 4.869 < 0.001 5d 0.7600 0.1328 5.722 < 0.001 6c -0.6781 0.7818 -0.867 0.386 6g 0.9201 0.6364 1.446 0.148 6h -1.9205 0.2282 -8.417 < 0.001 Harvesting method AE -0.0384 0.2872 -0.134 0.894 BT -0.5390 0.2868 -1.880 0.060 MA -0.2286 0.5125 -0.446 0.656 Harvesting season AUT -0.0861 0.2516 -0.342 0.732 ÉTÉ -0.0249 0.2438 -0.102 0.919 HIV -0.3902 0.2428 -1.607 0.108 Pre-harvest stand’s original disturbance CHP CHT_M -1.8587 0.5077 0.2218 0.6112 -3.041 2.290 0.022 0.002 CP 1.2115 0.2920 4.149 < 0.001 CT_M -0.5768 0.3873 -1.489 0.136 EL -0.0037 0.1378 -0.027 0.979 Pre-harvest stand BBBB 0.9485 0.1881 5.043 < 0.001 BBBBE -0.3060 0.2482 -1.233 0.218 BBBBS 0.9878 0.2905 3.400 0.001 BBPE 1.1753 0.2680 4.386 < 0.001 BJmR 0.4597 0.5042 0.912 0.362 EBB -1.1451 0.2888 -3.965 < 0.001 EE -1.9998 0.1430 -13.986 < 0.001 EPG -1.1734 0.2714 -4.324 < 0.001 ES -1.4700 0.1912 -7.689 < 0.001 PGE -1.7468 0.2773 -6.300 < 0.001 PGPG -0.7324 0.3504 -2.090 0.037 SBB -0.1708 0.2596 -0.658 0.511 SE -1.4806 0.2460 -6.018 < 0.001
Surficial materials D_1AY 0.0994 0.0963 1.032 0.302 D_1BP -1.3321 0.5583 -2.386 0.017 D_2A -0.6868 0.3020 -2.274 0.023 D_2BE -0.9578 0.3340 -2.867 0.004
D_7T 0.8254 0.6412 1.287 0.198 Refer to Table 2 for variable description. Bold indicate significance at α = 0.05.
23
Table 5. Threshold coefficients and summary of the cumulative link mixed model predicting ericaceous shrub percent cover as a function of harvesting and biophysical variables.
Threshold coefficients
Threshold Estimate Std. Error z value
0|0.13 -2.5516 0.3616 -7.056 0.13|0.38 1.0497 0.3589 2.925 0.38|0.63 2.7395 0.3618 7.572 0.63|0.88 4.7524 0.3694 12.866
Summary of the cumulative link mixed model
Theme Variable Estimate Std. Error z value Pr(>|z|)
Drainage DR20 0.0668 0.1002 0.667 0.505 DR31 -0.3836 0.2063 -1.860 0.063 DR40 0.0989 0.1344 0.736 0.462 DR50 -0.4695 0.5956 -0.788 0.431 Ecological region 4e -1.1891 0.5260 -2.261 0.024 5d -0.5362 0.1198 -4.475 < 0.001 6c -0.5223 0.6569 -0.795 0.427 6g 0.3594 0.5326 0.675 0.500 6h 1.7799 0.1968 9.045 < 0.001 Harvesting method AE -0.8260 0.2625 -3.147 0.002 BT -0.8409 0.2618 -3.212 0.001 MA 0.3715 0.4652 0.799 0.425 Harvesting season AUT 0.4521 0.2311 1.956 0.050 ÉTÉ 0.1765 0.2251 0.784 0.433 HIV 0.9542 0.2237 4.265 < 0.001 Pre-harvest stand’s original disturbance CHP CHT_M -0.6950 1.2666 0.1941 0.4657 -3.581 2.720 < 0.001 0.007 CP -0.3474 0.2776 -1.251 0.211 CT_M 1.7252 0.3484 4.951 < 0.001 EL -0.3673 0.1250 -2.939 0.003 Pre-harvest stand BBBB -1.2135 0.1884 -6.442 < 0.001 BBBBE 0.5869 0.2302 2.549 0.011 BBBBS -1.2338 0.2977 -4.145 < 0.001 BBPE -0.7174 0.2776 -2.584 0.010 BJmR -0.7653 0.5338 -1.434 0.152 EBB 0.5780 0.2499 2.312 0.021 EE 1.7337 0.1236 14.031 < 0.001 EPG 1.4064 0.2289 6.145 < 0.001 ES 0.9399 0.1625 5.784 < 0.001 PGE 1.4891 0.2289 6.506 < 0.001 PGPG 1.0648 0.3196 3.332 0.001 SBB -1.0221 0.2571 -3.975 < 0.001 SE 0.2655 0.2063 1.287 0.198 Surficial materials D_1AY -0.0539 0.0848 -0.636 0.525 D_1BP 0.0940 0.4140 0.227 0.820 D_2A 0.6050 0.2516 2.405 0.016 D_2BE 0.6132 0.2703 2.268 0.023
D_7T 1.0095 0.6018 1.677 0.093 Refer to Table 2 for variable description. Bold indicate significance at α = 0.05.
24
Regeneration on sites with marginal FTG stocking
There was a significant interaction between time and competing cover strata (F(5, 66) = 2.7, p = 0.028). However, pairwise comparison of the least square means showed that the increase in stocking was only statistically significant for low competing levels of commercial shade-intolerant hardwoods (t(66) = -5.992, p < 0.001) and moderate competing levels of ericaceous shrubs (t(66) = -5.653, p < 0.001) (Fig. 4). We did not detect statistically significant differences over time for low competing levels of ericaceous shrubs (t(66) = -3.205, p < 0.081), high competing levels of ericaceous shrubs (t(66) = -2.126, p < 0.607), moderate competing levels of commercial shade-intolerant hardwoods (t(66) = -3.300, p < 0.063) and high competing levels of commercial shade-intolerant hardwoods (t(66) = -2.709, p < 0.245) (Fig. 4). Free-to-grow conifer stocking had a tendency to improve over time in every strata of competing cover (Fig. 4). On average, at the time of the second inventory, we observed free-to-grow conifer stocking exceeding 60% for every strata (Fig. 4), which is generally considered a sufficient regeneration level.
Figure 4. Free-to-grow conifer stocking per strata of competing cover and over two time periods. LIH: low competing level of commercial shade-intolerant hardwoods, MIH: moderate competing level of commercial shade-intolerant hardwoods, HIH: high competing level of commercial shade-intolerant hardwoods, LES: low competing level of ericaceous shrubs, MES: moderate competing level of ericaceous shrubs, HES: high competing level of ericaceous shrubs. Bold indicate significance at α = 0.05.
There were no significant difference in live crown ratio (F(5, 13) = 2.296, p = 0.106) and apical index (F(5, 13) = 1.030, p = 0.440) according to competing cover strata. Most sampled trees were vigorous. For each competing cover strata, average live crown ratio was higher than 70% and average apical index was higher than 1.20. Least square
25
means did not detect any significant differences in sapling basal area between the different competing cover strata. Average sapling basal area ranged from 1.67 to 5.19 m2/ha for each competing cover strata.
26
Discussion
Ecological region and altitude
Our results indicate that hardwoods and ericaceous shrubs competition are not found in the same type of environments (Fig 3; Tables 3 to 5). Ecological regions located at the north of the study area had significantly lower odds of observing both the non-commercial and the non-commercial shade-intolerant hardwoods, whereas ecological regions located at the south of the study area had significantly higher odds of observing non-commercial hardwoods (Tables 3 and 4). The opposite occurred for ericaceous shrubs. Furthermore, ericaceous shrubs were positively correlated with altitude (Fig. 3). These latitudinal and altitudinal differences suggest that colder climates favour ericaceous shrubs presence over hardwoods.
Pre-harvest stand composition
We also found a close relationship between competing vegetation and stand type. Pre-harvest stands of jack pine or with black spruce in its dominant species increased the odds of observing ericaceous shrubs and reduced the chances to encounter hardwoods. This could partly be explained by climatic conditions. Colder climate favour conifers over hardwoods (Pastor and Mladenoff 1992, Sirois 1992, Pothier 2001) and we just mentioned that colder climates might favour ericaceous shrubs presence over hardwoods. Cold climate slows down decomposition rates and favours the accumulation of organic matter (Harden et al. 1997, Kurz et al. 2013), a substrate favourable to black spruce and ericaceous shrubs growth (Viereck and Johnston 1990, Jobidon 1995), while paper birch, trembling aspen, pin cherry and mountain maple are generally found on richer soils (Chapin et al. 1983, Bell 1991, Jobidon 1995). Furthermore, we observed that both hardwood categories had a better chance to grow on well-drained sites, an observation that concurs with previous studies (Marquis et al. 1969, Corns 1989, Bell 1991, Jobidon 1995). On the other hand, black spruce and some ericaceous shrubs are often found on poorly drained soils (Viereck and Johnston 1990, Jobidon 1995). Poor drainage favours accumulation of organic matter (Harden et al. 1997), which worsen conditions for hardwoods. Indeed, Lafleur et al. (2015) observed that organic layers accumulation hinders aspen seedling germination and growth as well as sucker development. Moreover, black spruce stands favour paludification by promoting
27
and Van Cleve 1983, Turetsky 2003, Légaré et al. 2004, Fenton et al. 2005). Sphagnum also favours the creation of acidic, wet and cold soils that decrease the decomposition rate of the organic matter, nutrients availability, microbial activity and plant growth (Turetsky 2003, Fenton et al. 2005, Lavoie et al. 2007). Ericaceous shrubs can also favour sphagnum growth through a scaffolding effect (Malmer et al. 2003, Fenton et al. 2005). Furthermore, sheep laurel and bog Labrador tea favour the accumulation of organic matter (Damman 1971, Inderjit and Mallik 1996). Sheep laurel produces tannins that inhibit nitrogen mineralization and bog Labrador tea produces phenolic compounds that modify soil nutrients availability (Inderjit and Mallik 1997, Bradley et al. 2000, Joanisse et al. 2007, 2009). Therefore, an increasing amount of nutrients get immobilized overtime in the organic layer where the understory is dominated by a shade-tolerant ericaceous shrub like sheep laurel (Mallik et al. 2012). Furthermore, jack pine can grow on very xeric sandy sites that are less favourable to hardwoods but on which ericaceous shrubs like sheep laurel can grow (Rudolph and Laidly 1990, Jobidon 1995).
Climate and soil fertility could also have been responsible for the lower chances of encountering ericaceous shrubs and the better odds of observing non-commercial hardwoods where pre-harvest stands were dominated by hardwoods without black spruce as a companion species. Also, paper birch and trembling aspen can facilitate non-commercial hardwood establishment. Although they can have detrimental effects on conifer growth by intercepting light, paper birch and trembling aspen canopies can attenuate weather extremes and increase humidity for understory vegetation (Man and Lieffers 1997, 1999b, Simard et al. 1997). Their litter decompose rapidly and increase nutrient availability (Wang et al. 1995, Peterson et al. 1997, Man and Lieffers 1999a). Moreover, paper birch is also known to facilitate carbon transfer to Douglas fir (Pseudotsuga menziesii (Mirb.) Franco) through ectomycorrhizal connections (Simard et al. 1997, Simard and Vyse 2006). It is however unclear if it can also facilitate carbon transfer to conifer species present on our study sites. Furthermore, hardwoods let more light reach the understory than conifers (Messier 1996, Messier et al. 1998), which could help semi shade-tolerant species such as mountain maple to persist under their cover.
We only observed an increase in the probabilities to encounter commercial shade-intolerant hardwoods when pre-harvest stands were dominated by paper birch accompanied by trembling aspen (Table 3). Without aspen, the presence of paper birch as a dominant or a companion species in the pre-harvest stands did not increase the chances to observe commercial shade-intolerant hardwoods in the post-harvest
28
regeneration. Similarly to this observation, Harvey and Bergeron (1989) observed a reduction in paper birch density and an increase of trembling aspen density following clearcutting in northwestern Quebec. This could be due to reproductive characteristics of both species. Trembling aspen mainly propagates via root sprouting (Moss 1937, Maini 1968, David et al. 2001), which allows to quickly repopulate a site and overtop competition. Paper birch can also produce sprouts but rarely in a quantity that is sufficient to regenerate a stand (Marquis et al. 1969). It mostly regenerates through seeds that can disperse over relatively long distances (Safford et al. 1990), making it less tightly linked to the harvest site than trembling aspen. Also, trembling aspen grows faster than paper birch (Doyon et al. 2001), giving it better chances to overtop competition and form the dominant cover. Furthermore, in boreal forests, shade-tolerant species usually establish in the understory of mature shade-intolerant hardwood stands, slowly shifting site composition from broadleaves to conifers (Bélanger et al. 1993, Bergeron and Charron 1994, Bergeron 2000, Hébert 2003). If they have not reached merchantable size, those shade-tolerant trees are not harvested during CPRS. Trees left on cutovers intercept light, hence impeding potential site colonization by shade-intolerant species (Haeussler and Coates 1986, Doucet 1989).
Drainage and harvesting season
Our results show that well-drained sites increased the odds of observing both hardwood categories, while wet sites decreased those odds (Tables 3 and 4). Paper birch and trembling aspen are indeed known to grow best on well-drained sites (Marquis et al. 1969, Corns 1989). Mountain maple and pin cherry are generally present on relatively well-drained sites (Bell 1991, Jobidon 1995). Speckled alder, on the other hand, is commonly associated with poorly drained sites (Healy and Gill 1974, Jobidon 1995). Analyzing competing vegetation by functional groups might have affected our ability to predict the presence of hardwoods like speckled alder on imperfectly or poorly drained sites. We must also consider that wet sites are often harvested during winter to avoid damaging soils. The snow cover on the ground may help protecting preestablished shade-tolerant regeneration during harvesting (Groot 1995, Pothier 2000), making it harder for shade-intolerant hardwoods to repopulate those sites. This would also explain why the odds of encountering commercial shade-intolerant hardwoods diminished after winter harvesting (Table 3). Similarly, the increased odds of observing ericaceous shrubs after winter harvesting might be attributed to the fact that some ericaceous species can