arXiv:astro-ph/0311026v1 3 Nov 2003
(DOI: will be inserted by hand later)
VLT + UVES Spectroscopy of the Low-Ionization Intrinsic
Absorber in SDSS J001130.56
+
005550.7
⋆
Damien Hutsem´ekers
1,2⋆⋆, Patrick B. Hall
3,4, J. Brinkmann
5 1 Institut d’Astrophysique, Universit´e de Li`ege, All´ee du 6 Aoˆut 17, Bat. B5c, B-4000 Li`ege, Belgium 2 European Southern Observatory, Casilla 19001, Santiago 19, Chile3 Princeton University Observatory, Princeton, NJ, USA 08544
4 Departamento de Astronom´ıa y Astrof´ısica, Pontificia Universidad Cat´olica de Chile, Casilla 306, Santiago 22, Chile 5 Apache Point Observatory, P.O. Box 59, Sunspot, NM, USA 88349-0059
Received: 7 May 2003 ; accepted: 31 October 2003
Abstract.We analyse high-resolution VLT+UVES spectra of the low-ionization intrinsic absorber observed in the BAL QSO SDSS J001130.56+005550.7. Two narrow absorption systems at velocities −600 km s−1and −22000 km s−1are detected. The
low-velocity system is part of the broad absorption line (BAL), while the high-velocity one is well detached. While most narrow absorption components are only detected in the ionization species, the lowest velocity component is detected in both high-and low-ionization species, including in the excited Si ⋆ and C ⋆lines. From the analysis of doublet lines, we find that the
narrow absorption lines at the low-velocity end of the BAL trough are completely saturated but do not reach zero flux, their profiles being dominated by a velocity-dependent covering factor. The covering factor is significantly smaller for Mg than for Si and N , which demonstrates the intrinsic nature of absorber. From the analysis of the excited Si ⋆ and C ⋆ lines
in the lowest velocity component, we find an electron density ≃ 103cm−3. Assuming photoionization equilibrium, we derive
a distance ≃ 20 kpc between the low-ionization region and the quasar core. The correspondence in velocity of the high- and low-ionization features suggests that all these species must be closely associated, hence formed at the same distance of ∼ 20 kpc, much higher than the distance usually assumed for BAL absorbers.
Key words.Quasars: general – Quasars: absorption lines
1. Introduction
Intrinsic absorption lines in quasars are usually classified as broad absorption lines (BALs) or narrow absorption lines (NALs). These absorption line systems are to be distinguished from cosmologically “intervening” systems unrelated to the quasar environment (Barlow et al. 1997).
Broad (velocity width FWHM > 2000 km s−1) troughs (BALs) are detected in roughly 15% of optically selected quasars (Hewett & Foltz 2003, Reichard et al. 2003b). They are blueshifted with respect to the QSO emission lines. BAL outflows occur at velocities of typically 0.1c (Weymann et al. 1991). Most BAL QSOs have absorption in high-ionization species like C λ1549, Si λ1397 and N λ1240. A minority of them also show absorption due to lower ionization species (LoBAL) such as Mg λ2798 or Al λ1857.
NALs have velocity widths of at most a few hundred km s−1. NALs are not only observed at redshifts zabs≃z
embut also at blueshifted velocities comparable to those seen in BAL QSOs (Barlow et al. 1997, Hamann et al. 1997a). NALs can
⋆ Based on observations collected at the European Southern
Observatory, Cerro Paranal, Chile (ESO 267.A-5698)
⋆⋆ Research Associate FNRS (Belgium)
also appear redshifted up to ∼ 2000 km s−1even though they are frequently blueshifted. Since common doublet transitions are resolved in NALs using high-resolution spectroscopy, they constitute useful diagnostics of the quasar environment. The so-called mini-BALs (e.g. Churchill et al. 1999) have interme-diate absorption widths, i.e. FWHM between a few hundred and 2000 km s−1.
BALs and NALs indicate that outflows from Active Galactic Nuclei span a large range of velocity widths. While it is known that NALs may form in various environments (Hamann et al. 2001 and references therein), it is not clear whether at least some of them are directly related to the BAL phenomenon. In some rare cases, NALs and BALs may be ob-served in the same quasar, providing an opportunity to directly investigate this issue.
In this paper we report high-resolution spectroscopy of SDSS J001130.56+005550.7 (hereafter SDSS J0011+0055; Schneider et al. 2002) discovered in the Sloan Digital Sky Survey (York et al. 2000). This object is one of the ∼105quasar candidates (Richards et al. 2002) for which the survey is ob-taining redshifts, in addition to the ∼ 106galaxies which com-prise the bulk of the spectroscopic targets (Blanton et al. 2003), selected from astrometrically calibrated drift-scanned imaging
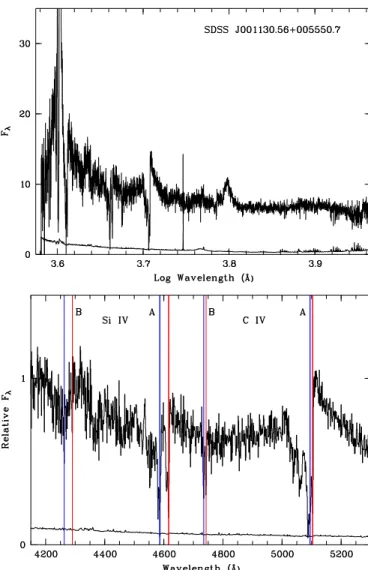
Fig. 1. SDSS spectrum (R ≃ 2000) of SDSS J0011+0055.Top:
the full spectrum. Fλ is in units of 10−17 ergs cm−2 s−1
Å−1. Bottom: a portion of the spectrum illustrating the Si λλ1393.75, 1402.77 and C λλ 1548.20, 1550.78 doublets. Absorption lines at z = 2.29071 (part of system A) and at z = 2.05844 (part of system B) are indicated
data (Gunn et al. 1998, Pier et al. 2003) on the SDSS ugriz AB asinh magnitude system (Fukugita et al. 1996, Lupton et al. 1999, Hogg et al. 2001, Stoughton et al. 2002, Smith et al. 2002).
SDSS J0011+0055 has strong intrinsic absorption extend-ing up to a velocity of ∼5500 km s−1 in C . It just misses formal classification as a BAL QSO: the balnicity index de-fined by Weymann et al. (1991) is measured to be zero using the method of Reichard et al. (2003a). However, it has a value of 2040 km s−1on the absorption index scale designed by Hall et al. (2002) to include troughs too narrow or close to the quasar redshift for consideration by the balnicity index. Since the for-mal classification is rather arbitrary and non-physical, we con-sider SDSS J0011+0055 as a BAL QSO in the following.
SDSS J0011+0055 shows both high- and low-ionization absorptions resolved into narrow components, together with a well-detached high-velocity zabs ≪ zem narrow line sys-tem. Because some absorption arises from excited levels,
SDSS J0011+0055 also provides a rare opportunity to derive the electron gas density and to constrain the distance to the ab-sorber.
Observations are reported in Sect. 2 and the characteristics of the spectrum in Sect. 3. The narrow lines are analysed in Sect. 4 in order to establish their intrinsic nature, to evaluate the covering factor of the different ions, and to estimate the electron density in the flow using excited lines. Discussion and conclusions form the last section.
2. UVES observations
Observations of several SDSS BAL quasars were obtained on UT 10-12 Aug 2001 using the ESO Very Large Telescope (VLT) Unit 2 (Kueyen) and the Ultraviolet-Visual Echelle Spectrograph (UVES). Part of these observations are reported in Hall et al. (2003).
For SDSS J0011+0055 two hour-long exposures were se-cured in the UVES DIC2 437+860 standard setting (Kaufer et al. 2001) with the depolarizer inserted. A 1′′
slit and a 2×2 CCD binning were used, yielding an overall spectral resolu-tion R ≃ 40000 (7.5 km s−1). Taking into account the fact that some orders are not useful due to bad signal to noise and/or strong artifacts, good quality spectra were obtained in the spec-tral ranges λλ 3760–4980 Å, λλ 6700–8510 Å and λλ 8660– 10420 Å.
Each exposure was reduced individually using the dedi-cated UVES pipeline (Ballester et al. 2000) developed within the ESO Munich Image Data Analysis System (MIDAS). Optimal extraction of the spectra was performed, including si-multaneous rejection of cosmic ray hits and subtraction of the sky spectrum. Telluric absorption lines were removed for the red setting with the use of observations of telluric standard stars, shifted in velocity according to the different times of the observations and scaled in intensity according to the airmass difference. Additional cosmic ray rejection was done by a de-tailed comparison of the two exposures, before co-addition and merging. The final 1-D spectrum was rebinned on a vacuum heliocentric scale.
3. Overview of the spectrum
SDSS J0011+0055 is a high redshift (zem≃2.3) low-ionization BAL QSO. Since only the rest-frame λλ 1140–1510 Å, λλ 2040–2590 Å and λλ 2630–3160 Å are covered by UVES spec-tra, C λ1549 is not observed. We show in Fig. 1 a portion of the SDSS spectrum illustrating this spectral region (Schneider et al. 2002).
From the peak of the Mg emission line at λ 2803 Å in the UVES spectrum, we adopt a systemic redshift of zsys = 2.29263. This is slightly lower than the SDSS redshift of
z = 2.30576 (Schneider et al. 2002), but the SDSS spectrum
does not include the Mg emission line. The exact value does not particularly matter, since all our discussions are in velocity space.
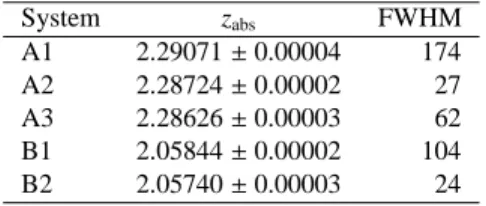
Several narrow absorption line systems may be identified in the UVES spectrum of SDSS J0011+0055. The character-istics of the systems studied in the present paper are reported
Table 1. The absorption systems studied in this paper System zabs FWHM A1 2.29071 ± 0.00004 174 A2 2.28724 ± 0.00002 27 A3 2.28626 ± 0.00003 62 B1 2.05844 ± 0.00002 104 B2 2.05740 ± 0.00003 24
in Table 1. FWHM (in km s−1) are measured from the Si and C lines for which these absorption lines are best seen. System A consists of a cluster of resolved narrow lines at the low-velocity end of the BAL trough seen in the SDSS low reso-lution spectrum (Fig. 1). It is well defined and resolved in Si as well as in Mg , making this system well suited for a detailed analysis. The higher velocity components seen in the C BAL trough (Fig. 1) appear broad, shallow or blended in the UVES spectrum of Si and N and undetected in Mg such that they are not further considered in the analysis. While system A is part of the BAL and superimposed on the broad emission, system B is a high-velocity narrow absorption system well de-tached from the BAL trough and the broad emission (Fig. 1). Additional (FWHM ≃ 18 km s−1) intervening systems are also detected at z = 1.77889 in C , Si and Mg , at z = 1.77791 in C , and at z = 0.48727 in Mg .
Portions of the UVES spectrum are illustrated in Fig. 2. The absorption system A1 is seen in the high- and low-ionization species N , Si , Mg , Si , C and H , including Si ⋆ and C ⋆excited states. No Fe absorption is detected. The veloc-ity correspondence indicates that all the observed species must be physically associated. Component A1 is definitely broader than the typical thermal velocity width (. 10 km s−1, Barlow & Sargent 1997). No ionization dependent velocity stratifica-tion can be observed in this component. Different behavior is seen in components A2 and A3, which are not detected in the low-ionization species but only in N , Si , and Lyα. It is worth emphasizing that broad absorption at higher veloc-ity is seen in C , Si and N while only the narrow com-ponent A1 is clearly detected in Mg in agreement with the fact that low-ionization features are more often found at the low-velocity ends of BAL troughs (Voit et al. 1993). Note that the important diagnostic line Mg λ 2853 is not detected in SDSS J0011+0055.
The other interesting feature is the detached narrow absorp-tion system with a velocity > 20000 km s−1. This high-velocity system is detected in the high-ionization species only and not in the low-ionization ones (i.e. not in Si nor C ; Mg and Lyα at z ≃ 2.05 are not in the observed UVES spectral range). It is relatively narrow and clearly separated from the BAL trough, which reaches only ∼ 5500 km s−1(Fig. 1). Two major compo-nents (named B1 and B2) are identified in the C line, while several narrower (15 – 20 km s−1 FWHM) components form the unsaturated Si line. The fact that component B1 is de-tected in N is suggestive of an intrinsic origin.
4. Analysis of the spectrum 4.1. Partial line-of-sight covering
The ability to measure unblended features from two lines of the same ion allows us to solve separately for the effective cover-ing factor and real optical depth, and to establish the intrinsic nature of the absorbers (e.g. Barlow & Sargent 1997).
If the absorption region covers a fraction Cv of the quasar light with an optical depth τv, then for unblended doublet ab-sorption lines we have (e.g. Hall et al. 2003):
Ib = 1 − Cv(1 − e−τv)
Ir = 1 − Cv(1 − e−0.5 τv) (1)
from which we derive
Cv= 1 + I2 r −2 Ir 1 + Ib−2 Ir and e−τv= 1 −1 − Ib Cv , (2)
where Ib and Ir are the normalized residual intensities in the
blue and red lines of the doublet (when the blue line is also the strongest). The solution for Cv–and e−τv– is only physical
(0 ≤ Cv≤1) when 0 ≤ I2
r ≤Ib≤Ir≤1. When I2r = Ib, Cv= 1
and the line profile is determined solely by the opacity. I2
r <Ib
implies Cv <1. When Ir = Ib, Ir= 1 − Cvand the line profile is saturated and essentially determined by the covering factor.
This analysis requires the residual intensities to be normal-ized to the underlying continuum. Since the absorption lines at z ≃ 2.29 deeply cut the broad emission, we assume that the absorption also covers the emission, and we adopt a local con-tinuum that includes the broad emission. We will see below that this hypothesis is adequate.
4.1.1. The low-velocity absorption system
Results for the low-velocity absorption system A are given in Fig. 3. Although some parts of the line profiles are noisy or sat-urated, a solution to Eqs. (1) - (2) is found for most data points in the absorption profiles, apart from a few relatively narrow “spikes” due to photon noise, incorrect background subtraction, or contamination by other lines. These results are not very sen-sitive to small modifications to the adopted local continuum.
A clear trend is observed especially in the lowest veloc-ity component A1: the line profiles are mostly determined by the velocity-dependent covering factor while the absorption is completely saturated; remarkably e−τv ≃0 all throughout the profiles. This complete saturation prevents the determination of column densities. For Mg and Si it is quite clear that the normalized residual intensites Irand Ibare identical within the
uncertainties. Since these intensities were normalized to a local continuum including different amounts of broad emission at the wavelength of each doublet, the absorption must cover part of the broad emission region, justifying our hypothesis a posteri-ori. Components A2 and A3 in Si and N do follow the same trend, although a spike obviously contaminates the N profile between components A2 and A3.
The covering factor is also dependent on the ionization. Apart from the fact that the components A2 and A3 are not seen in Mg , the covering factor of the Mg component A1
Fig. 3. The covering factor and opacity of resonance doublets
seen in the low-velocity absorption system A and computed from Eq. (2). From top to bottom: the normalized residual in-tensities Ib(blue) and Ir(red); the normalized residual intensity
Ib(blue) and the square of the normalized residual intensity I2r
(black); the covering factor Cv; the opacity expressed as e−τv.
Horizontal dashed lines indicates the range [0,1] over which these quantities have a physical meaning. Unphysical values of
Cvand e−τvhave been cut to a maximum of 1.1 and a minimum of -0.1
Fig. 4. Same as Fig.3 but for the high-velocity absorption
sys-tem B
reaches a maximum value of only ∼ 0.5, smoothly decreasing to lower and higher velocities. For Si and N the derived covering factor has a broader profile with a maximum value reaching nearly complete covering. No significant difference is seen between Si and N .
4.1.2. The high-velocity absorption system
Results for the high-velocity narrow absorption system B are given in Fig. 4. N data are not illustrated due to the poor sig-nal to noise (Fig. 2). Moreover N in the higher velocity com-ponent B2 is contaminated by intervening Lyα absorption, and nothing clear can be derived about its nature.
The C B1 component appears black and saturated at all velocities indicating that it must fully cover the continuum emitting region (there is no longer emission at these velocities). More interesting is the covering factor derived for Si . Although the data are noisier than in system A, I2
r <Ibfor the
four absorption sub-troughs seen in the B1 component, corre-sponding to a velocity-dependent covering factor varying be-tween 0.9 and 0.5. This indication of partial covering supports
Fig. 5. Part of the spectrum illustrating the C λ1334.53, C ⋆ λ1335.70, Si λ1260.42, and Si ⋆λ1264.76 transitions in
sys-tem A1 (cf. Fig. 2). In order to emphasize these features, the spectra are divided by a local continuum, and smoothed us-ing median filterus-ing on 20 km s−1 boxes. The vertical marks indicate the velocities predicted for these absorption lines at
z = 2.29071 (A1).
the hypothesis that this high-velocity component is intrinsic to the QSO. Detection of variability would nevertheless be useful to confirm this result.
Confirming the intrinsic nature of this high-velocity narrow component would be interesting: high-velocity NALs are not uncommon but they are rarely seen in BAL QSOs (Hamann et al. 1997a).
4.2. Absorption from excited levels: electron density and distance to the absorbers
Excited-state narrow absorption lines of C ⋆ λ1335.7 and
Si ⋆λ1264.8 are clearly detected in the component A1 in the
spectrum of SDSS J0011+0055 (Fig. 5). These features arise from ground multiplets that behave approximately as two-level atoms, the level populations being controlled by collisional processes and radiative decays (Bahcall & Wolf 1968, Morris et al. 1986, Osterbrock 1989). The strength of the absorption lines from the excited fine-structure levels C ⋆ λ1335.7 and
Si ⋆λ1264.8 can be directly compared to the resonance tran-sitions C λ1334.5 and Si λ1260.4 in order to estimate the electron density needed to populate the upper level. Note that the very close transitions Si ⋆ λ1264.74 and Si ⋆ λ1265.00
–as well as C ⋆λ1335.66 and C ⋆λ1335.71– are considered
as a single transition at the g f -weighted wavelength, keeping in mind that one of the transitions is much stronger. Also note that the weaker transitions Si λ1304.37 and Si ⋆ λ1309.27
are not detected, despite of confusion with Si from absorp-tion system B and an instrumental artifact (seen in all UVES spectra from the observing run), respectively.
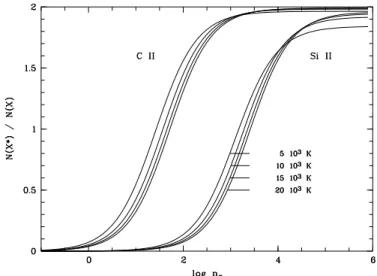
Fig. 6. C and Si column density ratios N(X⋆)/N(X) as a
function of the electron density nein cm−3. The Si curves are
labeled with the electron temperature; the C curves follow the same trend.
The population ratio of the upper excited level 2 to the lower resonance level 1 may be written (Osterbrock 1989)
N2 N1 = ne q12 A21 (1 + ne q21 A21 )−1, (3)
assuming equilibrium between collisional excitation, colli-sional de-excitation and radiative de-excitation1. A21 is the radiative de-excitation rate; ne is the electron density; q21 =
8.629 10−6T−1/2g−1
2 Ω(1, 2) and q12 = q21g2g
−1 1 e
−E12/kT; g1=
2 and g2= 4 are the statistical weights of levels 1 and 2; E12is the difference of energy between levels 1 and 2; T is the elec-tron temperature; and Ω(1, 2) is the collision strength, which is only slightly dependent on the temperature (e.g. Hayes & Nussbaumer 1984). For Si ⋆ λ1264.8, A21 = 2.13 10−4 s−1, Ω(1, 2) = 5.58, and E12 = 3.56 10−2eV (corresponding to the fine-structure transition [Si ] at λ 34.8 µm); for C ⋆λ1335.7,
A21 = 2.29 10−6 s−1, Ω(1, 2) = 2.90, and E12 = 7.86 10−3 eV (corresponding to the fine-structure transition [C ] at λ 158 µm) (data from Osterbrock 1989, and from The Atomic Line List v2.04).
Eq. (3) has been used to compute the C and Si column density ratios for several values of the electron density and tem-perature. Results are illustrated in Fig. 6 and can be used as a diagnostic. It is interesting to note that Si and C are sensitive to different –although overlapping– electron density ranges.
Looking at Fig. 5 we can see that C ⋆λ1335.7 is stronger
than C λ1334.5 while Si ⋆λ1264.8 is approximately equal
to Si λ1260.4. Although the signal to noise is not optimal and uncertainties on the location of the continuum are large,
1 In principle, excitation by infrared radiation is also possible.
However, for this excitation mechanism to be significant, very low electron densities are required, hence extremely large distances of the low-ionization clouds from the photoionization source. Even if the in-frared source is extended, this requires inin-frared flux densities much larger than expected for a typical quasar, and SDSS J0011+0055, un-detected by IRAS, is not an infrared-luminous quasar.
we estimate N(C ⋆)/N(C ) ≃ 1.6±0.3 and N(Si ⋆)/N(Si ) ≃
1.1±0.35. These values were first obtained by integrating the optical depths over the excited- and ground-state line profiles, and then computing their ratio. Also, in order to ensure that the same parts of the profiles are considered, the optical depth ratio was computed as a function of the velocity, and then the mean ratio evaluated. Both methods give similar results. The uncertainties are estimated by considering the ratios obtained with these two methods, as well as various binning values and locations of the underlying continuum.
According to Fig. 6, the measured values roughly agree within the uncertainties to indicate an electron density log ne≈
3, the value derived from C being smaller than the one de-rived from Si . The overall agreement between the C and Si behaviors supports the assumptions underlying Eq. (3). However, these column density ratios have been computed as-suming complete covering (Cv = 1), which is most probably not true. When there is partial covering, unabsorbed flux is added to the line profiles with the result that intensity differ-ences between two lines are attenuated. Correcting for partial covering will restore these differences. Taking partial covering into account could then increase N(C ⋆)/N(C ) and decrease
N(Si ⋆)/N(Si ), which would result in a better agreement
be-tween the electron densities derived from both species. In the following we conservatively adopt 2.2 ≤ log ne ≤ 3.4, the
lower and higher values corresponding to the values obtained from C and Si respectively, with T = 104K.
With the reasonable assumption that the gas is in photoion-ization equilibrium with the quasar radiation field, the electron density can be combined with the ionization parameter U to estimate the distance r between the absorber and the quasar. Hamann et al. (2001) give
r = LLL
4πch(−α)nHU !1/2
(4)
where LLL is the luminosity density at the Lyman limit, nH is the total hydrogen density, and α the power-law spectral coefficient in the Lyman continuum. The ionization parame-ter U is constrained by the simultaneous presence of Mg and N in the narrow component A1, which requires −2.8 . log U . −2.5 for ionization fractions > 1% for both ions, ac-cording to the calculations of Hamann & Ferland (1999). We adopt log U = −2.8 for ease of comparison with Hamann et al. (2001). We estimate LLL ≈2.5 1030 ergs s−1 Hz−1 by ex-trapolating the flux measured in the low-resolution SDSS spec-trum (assuming a cosmology with H0 = 70 km s−1 Mpc−1, ΩM = 0.3, and ΩΛ= 0.7, Pen et al. 1999). Adopting nH≈ne,
and α = −1.6, again for ease of comparison with Hamann et al. (2001), we find a distance 9 kpc ≤ r ≤ 37 kpc. This range of values reflects only the uncertainties on ne; the distance would
be 30% smaller if we had used log U = −2.5. We emphasize that this distance is only a rough estimate, and in particular relies upon the assumption of a uniformly dense outflow, as discussed in the next section.
5. Discussion and Conclusions
One of the main results of our study is that the narrow ab-sorption components seen at the low-velocity end of the BAL troughs are completely saturated, their profiles being domi-nated by the covering factor. Velocity and ionization dependent partial covering is often seen in NALs (Barlow & Sargent 1997, Hamann et al. 2001), and has also been reported for mini-BAL and BAL QSOs (Arav et al. 1999, Srianand & Petitjean 2000, de Kool et al. 2001, 2002b, Hall et al. 2003). The partial cover-ing proves the intrinsic nature of the absorbers.
However, our most intriguing result is the distance between the ionizing source and the absorber that we derived on the ba-sis of the excited lines. BALs are usually thought to be formed much closer to the central engine, at distances ∼ 0.1 – 1 pc, roughly four to five orders of magnitude smaller than the dis-tance of ∼ 20 kpc we have measured. Our estimate is clearly uncertain, but the errors cannot explain such a large difference. Note that the C ⋆and Si ⋆must be related to the other
ab-sorption features. The correspondence in velocity of the high-and low-ionization features in component A1 (Figs. 2 high-and 5) clearly indicate that all species must form at roughly the same location. Also, the continuity of the opacity and covering factor properties towards the higher velocity components A2 and A3 (Fig. 3) suggests a common formation for these components too. The components of the absorbing system A are definitely part of the BAL outflow because of their association with the high-ionization features seen in the wider C BAL (cf. the SDSS low-resolution spectrum in Fig. 1).
It is therefore likely that the BAL formation region (BALR) in SDSS J0011+0055 — at least for component A — is at much higher distance than commonly thought. In fact, small BALR distances are based more on theoretical considerations than on direct observational evidence. Here we summarize the few direct estimates that have been made of the distances to confirmed intrinsic outflows; all distances have been converted to our cosmology (Sect. 4.2).
Two NALs that have undergone time variability have thereby confirmed themselves as intrinsic and yielded upper limits to their distances in the kiloparsec range: < 1 kpc in UM 675 (Hamann et al. 1997b), and < 2 kpc in QSO 2343+125 (Hamann et al. 1997c).
Large distances have been inferred from the presence of C ⋆or Si ⋆absorption in two other NALs which are known to
be intrinsic absorbers due to partial covering: 20 kpc for 3C 191 (Hamann et al. 2001)2, and > 570 pc for APM 08279+5255 (Srianand & Petitjean 2000).
A related but distinct technique is the use of numerous Fe absorption lines to estimate absorber distances. Using this method, r ∼ 310 pc has been measured for the low-velocity system in FIRST J084044.5+363328, whereas r ∼ 1.35 pc is found for the high-velocity system in the same object using dif-ferent diagnostic (de Kool et al. 2002b). However, analysis of
2 Note that 3C 191 is a radio-loud quasar, whereas
SDSS J0011+0055 is radio-quiet by virtue of its non-detection in the FIRST survey (Becker et al. 1995). Absorbers apparently can be found at large distances from the ionizing source in both RLQs and RQQs.
the similar NAL in FIRST J121442.3+280329 yielded a small distance range ∼ 1 – 30 pc for the entire outflow (de Kool et al. 2002a), similar to that found for LBQS 0059-2735 (Wampler et al. 1995). The largest distance found by this method has been for the low-ionization BAL in FIRST J104459.6+365605 (de Kool et al. 2001). On the basis of excited Fe lines and veloc-ity correspondence between Fe and Mg lines, r ∼ 630 pc was found. We emphasize that – again based on velocity corre-spondence – our high distance estimate in SDSS J0011+0055 also applies to the high-ionization absorbers and not only to the low-ionization ones, as found in FIRST J104459.6+365605.
However, Everett et al. (2002) model a multiphase outflow at only r ∼ 4 pc that can reproduce the observations of FIRST J104459.6+365605, including the density measurements used by de Kool et al. to infer a much larger distance. In their model the intrinsic outflow does not have a constant density, but instead consists of a relatively low-density, high-ionization wind with embedded higher-density, lower-ionization clouds. Absorption in the high-ionization wind modifies the spectrum seen by the outer region of the wind and the low-ionization clouds, effectively reducing the value of LLL in Eq. (4) and thereby decreasing the inferred distance. The ionization and density in the wind decrease with increasing distance until species such as Fe and Mg are present at the required ne.
Denser clouds embedded in the flow at that distance are in-voked to produce Mg absorption at the same velocities as Fe and Mg .
Everett et al. claim that a multiphase outflow at a small dis-tance from the ionizing source could also explain the absorp-tion in 3C 191. Hamann et al. do in fact state that the outflow in 3C 191 must span a range of densities (or distances) to ex-plain the presence of N and Mg at the same velocities. A range of densities could also be present in SDSS J0011+0055 but is not required, because Mg is not detected. In any case, the density diagnostics used to infer large absorber distances in SDSS J0011+0055 and 3C 191 are different than those used in FIRST J104459.6+365605. Therefore, detailed mod-eling should be done to determine whether or not a multiphase outflow at small distances can indeed reproduce the observed densities, column densities and velocity structure of all ions ob-served in these objects. A further observational test of a mul-tiphase model for SDSS J0011+0055 and 3C 191 could come from spectra extending shortward of Lyα past the Lyman limit, directly measuring LLL and constraining any modification of the spectrum by the inner wind. It would also be worth moni-toring objects with large inferred distances, to search for time variable NALs which could require much smaller distances.
If they are confirmed, large distances from the continuum source and the broad emission line region may be difficult to reconcile with the evidence of velocity and ionization depen-dent partial covering in these absorbers. On the one hand, par-tial covering implies only that the projected size scale of the absorber is less than or comparable to that of the emitting re-gion. That inferred size for the absorber is independent of the
distance from the source, as long as the distance is small
com-pared to the angular diameter distance to the quasar. Partial covering by outflows at kpc-scale distances is therefore pos-sible, at least in principle. However, it is difficult to understand
how such distant outflows could be common, for several rea-sons. The usual problems of cloud (or density inhomogeneity) survival and confinement (e.g. Hamann et al. 2001, de Kool et al. 2001) are exacerbated by the requirement that such struc-tures must survive for the time needed to reach such large dis-tances. Also, if such outflows are seen in ∼10% of quasars, they cover somewhere between ∼10% of the unobscured lines of sight around all quasars and all such sightlines in ∼10% of quasars at distances of ∼10 kpc, implying outflows of very large masses (∼ 108−109M⊙; Hamann et al. 2001).
It is worth noting that the observed partial covering may in fact be due to additional emission from an extended re-gion of scatterers comparable in size to the BALR. Such a region has already been suggested to explain spectropolari-metric measurements (Cohen et al. 1995, Goodrich & Miller 1995) but its size and location have never been directly mea-sured. Resonance scattering in a roughly axially symmetric BALR could also explain abnormal doublet line ratios usu-ally interpreted as partial covering (e.g. Branch et al. 2002). Spectropolarimetry could provide some tests of these hypothe-ses.
Whether our results are generic to BAL QSOs is not clear. The objects for which BALR sizes have been measured so far show absorption somewhat intermediate between mini-BALs and BALs, rather than the very wide and deep troughs often seen in BAL QSOs. Perhaps these intermediate objects have different outflows, or represent an older evolutionary stage of the BAL QSO phenomenon when most of the material has dis-sipated, preferentially leaving behind denser clumps.
Clearly these results are puzzling and raise many questions. To determine the range of distances spanned by intrinsic out-flows will require detailed study of other, similar objects with C ⋆and Si ⋆absorption, including photoionization modeling to determine if multiphase models can explain such outflows.
Acknowledgements. We acknowledge use of data from the Atomic
Line List v2.04 (http://www.pa.uky.edu/∼peter/atomic/). PBH ac-knowledges support from Fundaci´on Andes. Funding for the cre-ation and distribution of the SDSS Archive has been provided by the Alfred P. Sloan Foundation, the Participating Institutions, the National Aeronautics and Space Administration, the National Science Foundation, the U.S. Department of Energy, the Japanese Monbukagakusho, and the Max Planck Society. The SDSS Web site is http://www.sdss.org/. The SDSS is managed by the Astrophysical Research Consortium (ARC) for the Participating Institutions. The Participating Institutions are The University of Chicago, Fermilab, the Institute for Advanced Study, the Japan Participation Group, The Johns Hopkins University, Los Alamos National Laboratory, the Max-Planck-Institute for Astronomy (MPIA), the Max-Max-Planck-Institute for Astrophysics (MPA), New Mexico State University, University of Pittsburgh, Princeton University, the United States Naval Observatory, and the University of Washington.
References
Arav, N., Korista, K.T., de Kool, M., et al., 1999, ApJ, 516, 27 Bahcall, J.N., Wolf, R.A., 1968, ApJ, 152, 701
Ballester, P., Modigliani, A., Boitquin, O., et al., 2000, The Messenger, 101, 31
Barlow, T.A., Hamann, F., Sargent, W.L.W., 1997, In: Arav N., Shlosman I., Weymann R.J. (eds), Mass Ejection from Active Galactic Nuclei, ASP Conf. Ser. Vol. 128, p. 13
Becker, R.H., White, R.L., Helfand D.J., 1995, ApJ, 450, 559 Blanton, M.R., Lupton, R.H., Miller Maley, F., et al., 2003, AJ, in
press (astro-ph/0105535)
Branch, D., Leighly, K., Thomas, R.C., Baron, E., 2002, ApJ, 578, L37
Cohen, M.H., Ogle, P.M., Tran, H.D., et al., 1995, ApJ, 448, L77 Churchill, C.W, Schneider, D.P., Schmidt, M., Gunn, J., 1999, AJ, 117,
2573
de Kool, M., Arav, N., Becker, R.H., et al., 2001, ApJ, 548, 609 de Kool, M., Becker, R.H., Gregg, M.D., et al., 2002a, ApJ, 567, 58 de Kool, M., Becker, R.H., Arav, N., et al., 2002b, ApJ, 570, 514 Everett, J., K¨onigl, A., Arav, N., 2002, ApJ, 569, 671
Fukugita, M., Ichikawa, T., Gunn, J.E., et al., 1996, AJ, 111, 1748 Goodrich R.W., Miller J.S., 1995, ApJ, 448, L73
Gunn, J.E., Carr, M., Rockosi, C., et al., 1998, AJ, 116, 3040 Hamann, F., Barlow, T.A., Cohen, R.D., et al., 1997a, In: Arav N.,
Shlosman I., Weymann R.J. (eds), Mass Ejection from Active Galactic Nuclei, ASP Conf. Ser. Vol. 128, p. 19
Hamann, F., Barlow, T.A., Junkkarinen, V., Burbidge, E.M., 1997b, ApJ, 478, 80
Hamann, F., Barlow, T.A., Junkkarinen, V., 1997c, ApJ, 478, 87 Hamann, F., Ferland, G.J., 1999, ARA&A, 37, 487
Hamann, F., Barlow, T.A., Chaffee, F.C., et al., 2001, ApJ, 550, 142 Hall, P.B., Anderson, S.F., Strauss, M.A., et al., 2002, ApJS, 141, 267 Hall, P.B., Hutsem´ekers, D., Anderson, S.F., et al., 2003, ApJ, 593,
189
Hayes, M.A., Nussbaumer, H., 1984, A&A, 134, 193 Hewett, P.C., Foltz, C.B., 2003, AJ, 125, 1784
Hogg, D. W., Finkbeiner, D.P., Schlegel, D.J., and Gunn, J.E. 2001, AJ, 122, 2129
Kaufer, A., D’Odorico, S., Kaper, L., 2001, UV-Visual Echelle Spectrograph (UVES) User Manual, European Southern Observatory
Lupton, R.H., Gunn, J.E., and Szalay, A.S. 1999, AJ, 118, 1406 Morris, S.L., Weymann, R.J., Foltz, C.B., et al., 1986, ApJ, 310, 40 Osterbrock, D.E. 1989, Astrophysics of Gaseous Nebulae and Active
Galactic Nuclei (Mill Valley: University Science Press) Pier, J.R., Munn, J.A., Hindsley, R.B., et al., 2003, AJ, 125, 1559 Pen, U., 1999, ApJS, 120, 49
Reichard, T.A., Richards, G.T., Schneider, D.P., et al., 2003a, AJ, 125, 1711
Reichard, T.A., Richards, G.T., Hall, P.B., et al., 2003b, AJ, submitted Richards, G.T., Fan, X., Newberg, H.J., et al., 2002, AJ, 123, 2945 Schneider, D.P., Richards, G.T., Fan, X., et al., 2002, AJ, 123, 567 Smith, J.A., Tucker, D.L., Kent, S., et al., 2002, AJ, 123, 2121 Srianand, R., Petitjean, P., 2000, A&A, 357, 414
Stoughton, C., Lupton, R.H., Bernardi, M., et al., 2002, AJ, 123, 485 Voit, G.M., Weymann, R.J., Korista, K.T., 1993, ApJ, 413, 95 Wampler, E.J., Chugai, N.N., Petitjean, P., 1995, ApJ, 443, 586 Weymann, R.J., Morris, S.L., Foltz, C.B., Hewett, P.C., 1991, ApJ,
373, 23
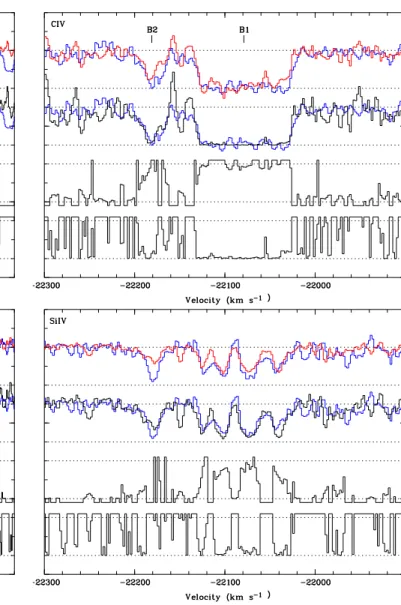
Fig. 2. Portions of the UVES spectrum of SDSS J0011+0055 illustrating the absorption line systems A and B defined in Table 1.
System B is best seen in C and system A in Si (C at z ≃ 2.29 is outside the observed UVES spectral range). The following transitions are indicated: N λλ 1238.82, 1242.80, C λλ 1548.20, 1550.78, Si λλ 1393.75, 1402.77, Mg λλ 2796.35, 2803.53 , Si λλ 1260.42, 1264.74, 1265.00, C λλ 1334.53, 1335.66, 1335.71, and Lyα λ 1215.67. For clarity, the two reddest and very close transitions of Si and C are represented by single marks at the mean wavelengths; all four of those transitions are excited-state transitions. Absorption from the high-velocity system B is not detected in Si or C , and therefore is not plotted although it lies well within the observed UVES spectral range (Si λ 1260.42 could be present in system B1 but the detection is not convincing). Narrow intervening Mg λλ 2796.35, 2803.53 absorption contaminates the Si absorption of system A2. Narrow intervening C λ1548.20 lines are seen slightly longward of the Si absorption from system B, along with a broader instrumental artifact. All spectra are plotted on a velocity scale of v/c = (R2 −1)/(R2+ 1) where R = (1 + z
sys) λ0/λobs, λobs being the observed wavelength, λ0 the laboratory vacuum rest wavelength of the red transition of the multiplets, and zsys the