1
Preprint, the final version, of the article that has been transferred to the journal's production team.
To cite this article: Labdaoui, K., Mazouz, S., Acidi, A. E. H., Cools, M., Moeinaddini, M., & Teller, J. (2021). Utilizing thermal comfort and walking facilities to propose a comfort walkability index
(CWI) at the neighbourhood level. Building and Environment, 107627. https://doi.org/10.1016/j.buildenv.2021.107627
Utilizing thermal comfort and walking facilities to propose a Comfort
Walkability index (CWI) at the neighbourhood level
Abstract
Many walkability indices have been developed by considering a range of specific indicators. However, comfort indicators at the neighbourhood scale and the effects of thermal comfort have generally not been accounted for in such research. To this end, we propose the comfort walkability index (CWI) at the neighbourhood micro-scale. The proposed tool is based on two questionnaires, 330 respondents answered the first questionnaire, to evaluate the relative coefficient for each indicator (Cis). The second questionnaire based on 282 respondents using a simple random sampling technique to assess the scores of the selected factors (Sis). We tested the CWI in two areas in the city centre of Annaba, Algeria, and calculated the physiological Equivalent temperature (PET) using RayMan software on two average summer days from 7 a.m. to 8 p.m. when heat and humidity peaks are observed. The results show that over 95% of the suggested indicators were estimated as being very important and necessary. The CWI scores were dependent on PET values and thermal perception. The highest scores of CWI were 40.95% and 25.23% in Colonial centre and Old town respectively, correlated with neutral thermal sensation (20°C-26°C). CWI in the Colonial centre was changing from rarely acceptable comfort quality to uncomfortable level depending on PET scores; however, CWI in Old Town defined a low comfort quality despite the variability of PET scores. This paper highlights the importance of assessing pedestrian comfort facilities at the neighbourhood microscale and heeding the importance of thermal comfort in promoting a satisfying walking experience.
Keywords: Comfort Walkability Index (CWI), Hot-summer Mediterranean climate (Csa),
neighbourhood scale, Physiological Equivalent Temperature (PET), thermal comfort, walkability comfort indicators.
2
1. Introduction
Walkability refers to the suitability of an urban environment to provide pedestrian walkways [1–4]. Walkability also enhances the liveability and environmental quality of a neighbourhood [5,6], while it depends on simple infrastructure [1,3,7,8]. Walking is now considered a significant factor in promoting healthier, sustainable and active communities [9]. It has pertinent effects on reducing pollution in cities and ensuring inhabitants’ well-being and health [10–12]. Encouraging walking environments in cities is viewed as a relevant goal in attaining sustainable mobility patterns.
A number of studies have investigated macro-level indicators at the neighbourhood scale to improve walking rates in urban areas [10–12]. Other studies have attempted to address key elements that help to create a pedestrian-friendly neighbourhood [13] by considering important factors such as safety, comfort and convenience indicators [7,14,15]. Urban furniture such as drinking fountains [16,17], slope [7,18] and benches [19,20] provide a comfortable environment for pedestrians in urban areas besides other social benefits [21–23]. Another important urban design indicator is vegetation, which has the aesthetic potential to create attractive spaces [21,22]. Trees that provide shade [12] encourage citizens to walk around the streets during the hot hours of the day [22]. Using the microscale approach can contribute to the provision of attractive sidewalks, pleasant and comfortable walking paths. Thus, walkability micro-scale assessment models allow us to achieve a better and more reliable perception of the walking environment [1].
From another perspective, thermal comfort can affect the use of the outdoor environment and many studies have shown the importance of climatic conditions for the well-being of inhabitants in outdoor environments [24,25]. People in outdoor environments are vulnerable to thermal conditions throughout the different seasons of the year, ranging from
3
heat stress and cold stress to neutral and comfortable conditions. Even during a single day, people can be subject to varying levels of hot and cold thermal stress [29]. Many studies have elaborated universal indices to define thermal comfort in hot and cold conditions [26]. The two leading thermal comfort indices, the physiologically equivalent temperature (PET) and the Universal Thermal Climate Index (UTCI) have been widely used and applied to cold and hot conditions [26,27]. However, PET has been successfully tested in different climate zone and urban spaces such as streets, squares, parks [24,28–31]. That had been based on questionnaire confirmed by people’s vote [26,32,33].
Because street life and outdoor activities vary depending on the climatic conditions [34], associating thermal comfort with walkability could contribute to making streets more comfortable for pedestrians. A pedestrian-friendly environment can be developed by realizing standards and assessing walking facilities in an ongoing manner. Previous studies have linked comfort to urban design features, attractiveness and safety [7,8,35–38]. However, few studies have considered the micro-level factors at the neighbourhood scale. Moreover, walkability in urban areas has rarely been assessed using thermal comfort indices such as PET. Although there have been some developments in walkability measurement, the following practical issues related to pedestrian comfort remain unresolved: (1) the lack of methods and measurement tools that address the neighbourhood micro-scale; (2) the definitions of comfort walkability indicators; and (3) the assessment of walkability by considering thermal comfort.
Therefore, the main objective of this study is to complement the current literature by measuring walking comfort on the neighbourhood micro-level and PET values. The proposed measurement is tested in the hot-summer Mediterranean climate (Csa) of Annaba, Algeria. The novelty of this study involves the design of a new assessment tool, the Comfort Walkability Index (CWI) based on 21 pedestrian comfort indicators at the neighbourhood microscale, besides PET as a thermal comfort index. The lack of thermal comfort in
4
walkability assessment tools is a challenge when the process results are to be interpreted and applied in the transport planning and urban design.
2. Literature review
The literature review presented in this section intended to identify the effective pedestrian- features and climatic conditions related to the comfort concept at the neighbourhood micro scale. Measurement tools and methods had been also described for a better understanding of the representative measurement of thermal comfort and walkability.
Cain et al. [39] note that there are two methods for assessing walkability at the neighbourhood scale. The first concerns macro-level characteristics, including existing structures of neighbourhoods (e.g., street connectivity, land-use mix, residential density) that are not exposed to frequent changes in the urban environment [40]. The second approach is related to the micro-level at the neighbourhood scale, consisting of the quality and attractiveness of sidewalks, which can affect the comfort and safety of walkability in urban spaces [7,35,41]. However, the micro-level approach at the neighbourhood scale, which can more easily account for frequent changes than at the macro level, has rarely been explored [39]. Moreover, it is essential to identify pedestrian amenities in relation to the quality of the walking environment [7]. Thermal comfort assessment at the neighbourhood micro-level is thus a promising quantitative approach to estimate pedestrian comfort because of its straightforward measurement.
Streets, sidewalks, parks, squares and other urban design elements can play a crucial role in promoting walkability, as they can affect pedestrian walking behaviour [9,40,42]. Furthermore, sidewalk amenities conducive to comfortable walking involve main facilities (e.g., kerbs, ramps, sidewalk width), encouragement facilities (e.g., lighting, sitting areas, landscaping and trees) and convenience facilities (e.g., toilets, drinking fountains) [1]. Such indicators can transform spaces into accessible, walkable and comfortable areas [1,4,45,46].
5
Aghaabbasi et al. [8] divided walkability indicators into different components, such as accessible design factors (e.g., accessible drinking fountains, accessible toilets, tactile pavements, kerb ramps, accessible signage and signals, skybridge lifts); safety design factors (e.g., landscaping and trees, signage, bollards, surfaces and materials, lighting, signals); attractiveness design factors (e.g., landscaping and trees, benches and sitting areas, rubbish bins, effective sidewalk width, lighting, cleanliness); and sidewalk path conditions (e.g., maintenance, slope, natural barriers). Other studies have used similar walkability indicators, such as seating areas, bollards, landscaping and trees, toilets, rubbish bins, skybridge lifts, driveways, slope, materials/surfaces, effective sidewalk width, signals, signage, tactile pavements, ramps, kerb ramps, cleanliness, lighting [7], drinking fountains [1], shady trees, accessibility to green spaces, benches and pedestrian-scale lighting [43–47].
According to Asadi-Shekari et al. [43], improvement in sidewalk conditions can be achieved by integrating certain walkability factors such as the following: slower traffic, mid-block crossings, landscaping and trees, facilities (e.g., fire hydrants), lighting, signals, bollards, slope, kerb ramps, wheelchair-accessible drinking fountains, tactile pavements (warning and guiding), signals, benches and seating areas. These walkability indicators are suitable for all users, including people with disabilities.
It can be concluded that most existing studies have focused on attractive design features, safety, usability and convenience design factors at the street level. Few studies have explored comfort at the neighbourhood scale. We, therefore, propose a wide range of comfort indicators for the neighbourhood micro-scale level.
2.1 Assessment of walkability tools
In recent years, numerous studies have adopted an objective approach to the evaluation of walkability. The complexity of the relationship between neighbourhood
micro-6
scale indicators and walking behaviour, and in addition the role of individual perception, form an elaborate framework that researchers have tried to resolve.
The Path Environment Audit Tool (PEAT) [48] uses a variety of walkability indicators at the micro-scale level; however, many comfort indicators such as sidewalk material and width, as well as trees and shade, are not considered. The Walking Suitability Assessment Form (WSAF) [49] and the PIN3 Neighbourhood Audit Instrument [50] examine a restricted number of walkability indicators and focus on the presence of trees and shading effects on the walking area and street lighting; however, many comfort factors are not included (e.g., toilets, slope, fountains, benches, seated drinking fountains, toilets, slope benches, seats). The Neighbourhood Environment Walkability Survey (NEWS) [51] is the most commonly used tool in survey question formats, and includes a number of walkability indicators such as lighting, cleanliness and separation of pedestrians and vehicles (buffering). However, NEWS also lacks certain comfort indicators (e.g., drinking fountains, tactile pavements, toilets).
Clifton et al. [20] proposed the Pedestrian Environment Data Scan (PEDS) tool, which includes abroad range of indicators (e.g., path material, path condition, slope and path obstructions), although, again, many comfort indicators are missing (e.g., drinking fountains, slope and kerbs). Aghaabbasi et al. [7] focused on the Neighbourhood Sidewalk Assessment Tool (NSAT), which considers a wide variety of comfort indicators besides extended pedestrian categories, leading to increased satisfaction among people with different physical abilities. Overall, there is a generalised lack of use of comfort indicators in the assessment of walkability in measures such as PIN3, PEAT, NEWS and PEDS, besides the exclusion of consideration of people with disabilities.
Asadi-Shekari et al. [35] reported that the pedestrian level of service (PLOS) was found to be a useful measurement tool. This measure helps designers and planners to evaluate the quality of the street environment for pedestrians and can provide guidance regarding
7
enhancements to solve existing problems. Although some studies have used PLOS to assess sidewalk capacity [35], PLOS models have generally focused on the street characteristics involving micro-design factors and pedestrian amenities [14,35,41,43].
The different methods described above have been used according to the respective research objectives. Because most of these objectives focused on the street level, few methods are available for the neighbourhood micro-scale level.
2.2. Thermal comfort
In recent years, researchers have paid particular attention to thermal comfort in urban environments and its effect on inhabitants [25,26,33,52–54]. Numerous studies have attempted to define thermal comfort conditions to determine the concept of thermal sensation in outdoor urban spaces [24,53,55–59]. Thermal comfort is referred to as user satisfaction regarding the thermal environment [26,60].
Understanding microclimate environment characteristics is important because they influence people’s comfort and outdoor activities [24]. Some studies have focused on the development of universal indices that can measure thermal comfort in hot and cold climates [24,26]. Indices such as Perceived temperature (Pt) [26,61], Standard Effective Temperature (SET*) [26,62] and its outdoor variant OUT-SET* [63], UTCI [64], PET [68,69] and predicted mean vote (PMV) [26,67–69] have been effectively applied to urban areas for thermal comfort assessment.
Most current indices for outdoor thermal perception include PET, PMV, UTCI and SET* [26], and these are suitable for calculating heat and cold stress. PMV allows the classification of thermal sensation; PET, UTCI and SET* provide an evaluation in °C of thermal sensation. SET* is a more suitable index for hot climates, whereas PET and UTCI are typically employed in both hot and cold climates [27].
8
According to Chen and Matzarakis. [70], UTCI used 135 W/m 2 as reference activity. It highlights the relevance of the effect of air humidity and wind speed concern. The initial scaling for UTCI was based on the multi-node dynamic-thermo physiological UTCI - Fiala model [71]. While PET used 80 W/m2 as a standard stimulating activity, experimental studies showed that people feel usually much heated under brutal metabolism than slight metabolism [70]. The original scaling for PET was based on human energy balance [72], besides PET focuses on radiant and sensible heat loss [70].
PET had been less criticized in comparison with UTCI, according to Potchter et al. [26], the examination of the relation between PET and full scale and outdoor thermal conditions showed a positive relationship and demonstrated a strong correlation. Many field surveys based on questionnaires have been undertaken in different climatic zones, searching to validate those indices against actual people’s votes [24,32,33], while the exploration of the relation between UTCI full scale and outdoor thermal conditions highlighted a positive and weak relation, identified as not correlative and significant due to the limited sample size [26]. Besides a few studies tested the subjective method, which the results showed a different scale of no stress category (comfort range) for the different climatic condition, that should be examined according to Potchter et al.[26]. In comparison PET had been validated in several climatic zones [27,28,31,65] and investigated in a wild range of outdoor environments [30,31,53,75].However, the verification of the PET and UTCI indices shows that the perceived comfort zone values are very similar to each other [26].
PET was introduced in Western and Central Europe [24,55,78]; The “neutral” scale for the PET index in hot climates of 24–26°C was confirmed in 95% of studies. In a cold climate, 89% of studies showed a “neutral” range of 15–20°C. Lin [79] examined thermal sensation and its adaptation to the tropical climate in Taiwan and reported PET values of 21.3–28.5°C all year round, which were higher than the European scale PET values of 18–23°C. Another
9
study in the Csa of Tel Aviv, Israel, demonstrated that the PET values were higher than the European PET scale by 3°C and lower by 5°C than the lower boundary of the PET values recorded in Taiwan [24]. Mahmoud [29] studied thermal comfort in an urban park in Cairo, Egypt, where the PET values were 22–30°C in summer and 21–29°C in winter, which were also higher than the European scale [26]. These results demonstrated the influence of urban climatic characteristics on human balance, energy and people’s thermal perception, all of which affect the use of outdoor environments [55]. These studies thus highlight the impact of the duality of microclimatic measurement and thermal perception in cities and the use of the outdoor environment in different climates.
Based on this literature review, we strongly support the feasibility of including thermal comfort in the assessment of walkability. This study seeks to develop an innovative approach towards inclusive design features and thermal comfort for a pleasant walking experience. We focus on universal comfort factors at the neighbourhood micro-scale level, in addition to a broad range of user categories, and consider PET as a thermal comfort index, that had been calculated based on climatic data such as air temperature, relative humidity and wind velocity on two representative summer days. Our method had been tested in the city of Annaba, Algeria, which is characterised by a Csa climate. Moreover, relating walkability scores to people’s perception of the pedestrian environment and thermal sensation in a Csa climate provides a better understanding of the pedestrian comfort rating.
3. Method
Several methodologies have been developed and applied in urban planning to integrate pedestrian audits in transportation system plans and pedestrian planning. To date, however, there are few data gathered using walkability measurement methods that involve the neighbourhood micro scale. We now briefly present each of the main steps of the CWI procedure. Figure 1 provides a comprehensive description.
10
Fig. 1.Conceptual framework of the comfort walkability index (CWI).
3.1. Review of effective indicators
This research paper involved the identification of indicators in full research papers, review articles and standard guidelines, using Google Scholar, the Web of Science and weather records. Keywords included walkability, thermal comfort, assessment tools, streets,
Literature review
Case study
Hot-summer Mediterranean climate (Csa)
Neighbourhood micro-scale level 22 comfort indicators
Data collection
Process indicator evaluation
Equation
Questionnaire survey Weather file 2017
PET scale in a Csa Importance of each indicator Estimation of each indicator Air temperature Relative humidity Wind velocity PET Scores (Si) Coefficients (Ci) 5-point rating system 4-point rating system
PET scores (Si)
11
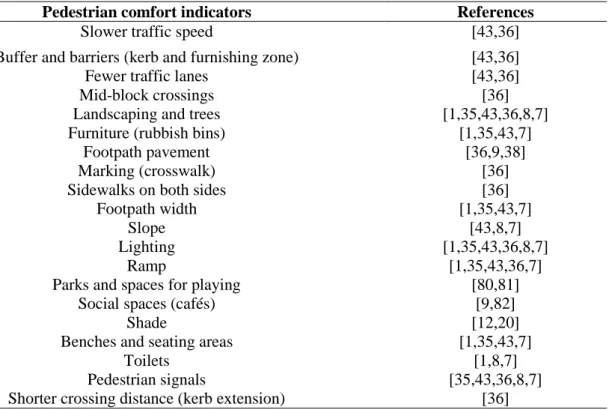
neighbourhood and Csa. Some papers were omitted because they focused on collecting data related to the trip level, and as a result, there was a lack of information regarding tool assessment and application. According to our criteria, the selected indicators concerned research conducted between 2002 and 2019, with the aim of defining the comfort indicators that promoted enjoyment of a pleasant walking experience. This concept was analysed on neighbourhood and street scales, as well as the widely used index of thermal comfort in outdoor environments. The findings highlighted the gap in research on the neighbourhood micro-scale regarding the evaluation of thermal comfort in walkability. The relevant comfort indicators are presented in Table 1.
Table 1. List of pedestrian comfort indicators appropriate for the neighbourhood micro scale.
Pedestrian comfort indicators References
Slower traffic speed [43,36]
Buffer and barriers (kerb and furnishing zone) [43,36]
Fewer traffic lanes [43,36]
Mid-block crossings [36]
Landscaping and trees [1,35,43,36,8,7]
Furniture (rubbish bins) [1,35,43,7]
Footpath pavement [36,9,38]
Marking (crosswalk) [36]
Sidewalks on both sides [36]
Footpath width [1,35,43,7]
Slope [43,8,7]
Lighting [1,35,43,36,8,7]
Ramp [1,35,43,36,7]
Parks and spaces for playing [80,81]
Social spaces (cafés) [9,82]
Shade [12,20]
Benches and seating areas [1,35,43,7]
Toilets [1,8,7]
Pedestrian signals [35,43,36,8,7]
Shorter crossing distance (kerb extension) [36]
3.2. Data collection
For data collection, we conducted two surveys, one with pedestrians and the other via an online platform (Monkey, Google Forms). It is worth noting that the participants who answered on online platforms were very familiar with the selected neighbourhood as they are
12
residents. Besides general information (age, sex, education), the questionnaire focused on the importance of pedestrian comfort facilities and the status of each indicator in the selected neighbourhoods. The respondents were asked to classify the importance of the chosen factors and estimate their actual condition.
3.3. Assessing indicators
To evaluate the indicators, we calculated coefficients and scores from the survey results, as well as a suitable model for designing walkable neighbourhoods. Climate data such as air temperature, wind velocity and relative humidity were used to calculate PET values using RayMan software. We chose two representative summer days to explore the micro differences in the same season characterised by a Csa. Finally, we calculated the CWI using a point system; the related scoring method for PLOS followed Asadi-Shekari et al. [36,41,43]. The CWI score can be calculated from Eq. (1):
𝐂𝐖𝐈 = (( 𝑖=22𝑖=1 Ci × Si)/ 𝑖=22𝑖=1 Ci) × 100, (1) Where Ci is the coefficient of each indicator and Si is the score of each indicator.
Table 2 shows the different classifications of the CWI percentage rating and their interpretations. CWI A shows the highest comfort quality conditions. CWI B may be acceptable considering the availability of some comfort indicators besides the feasibility of some operational improvements. CWI C requires more attention and improvement. CWI D indicates inferior quality and uncomfortable conditions, requiring considerable improvement. CWI E and F are the worst comfort quality and lack of standard pedestrian facilities; therefore, they require significant improvement.
13 Table 2. Interpretation of CWI rating.
CWI % rating
Model
score Interpretation
A 80–100 Highest comfort quality (very pleasant), many pedestrian comfort facilities present.
B 60–79 High comfort quality (acceptable), some pedestrian comfort facilities present. C 40–59 Average comfort quality (rarely acceptable), pedestrian comfort facilities
present; however, there is potential to improve pedestrian comfort conditions. D 20–39 Low quality (uncomfortable), minimal pedestrian comfort facilities.
E 1–19 Lowest comfort quality (unpleasant).
F 0 No standard pedestrian amenities (very uncomfortable).
For thermal comfort, we selected PET for its various benefits in outdoor urban spaces
PET was applied and approved in multiple urban areas with detailed shading design; precise averages for thermal environments were thus obtained [27,28, 30,31].
PET was compared and related to the mean thermal sensation vote (MTSV) scale across multiple climatic zone classifications [24,55,69,83–85] and used for improving outdoor thermal comfort ratings in hot and cold climates.
PET was validated in different climatic zones using multiple field surveys based on population responses [25,33,55,76], which makes it reliable.PET was legally approved as a human biometeorological climate assessment tool for urban and regional planning, according to the German standard VDI 3787 (VDI,1998) [55].
PET was calculated using software packages (e.g., RayMan, ENVI-met) and considering climatic/microclimatic data (air temperature, relative humidity, wind speed, average radiant temperature).
PET had been explored and proved at the street level [55,24,86,58,71], and correlated to the pedestrian thermal comfort term.
We validated the relevance of the listed indicators and thermal comfort within the Csa using the method described below.
14
3.4. Data collection
The selected indicators were the subject of two specific questionnaires for data collection: the first focused on the importance of comfort design features at the neighbourhood micro scale, and the second included the participants’ evaluation of each indicator.
The climate data (air temperature, relative humidity and wind velocity) were acquired from the Annaba weather records 2017 on two representative summer days (18 July and 8 August 2017) when air temperatures and the relative humidity reach their peak.
3.5. Process indicator evaluation
3.5.1. Pedestrian comfort facility coefficients and scores
The first questionnaire evaluates the importance of 21 indicators at the neighbourhood micro-scale level using a five-point Likert scale ranging from 1 (least important) to 5 (very important). In total, 330 respondents from different cities in Algeria including Annaba answered the first questionnaire using an online platform. The outputs of this questionnaire are used to generate the relative coefficient for each comfort indicator (Cis). The second questionnaire (282 respondents) assesses the scores of the selected factors (Sis), using a simple random sampling technique. The randomised information allowed us to define the respondents’ characteristics (e.g., sex, age, residential origin), while participants evaluated each indicator using a scale ranging from 0 (awful) to 4 (very good).
3.5.2. Calculating and scoring PET 3.5.2.1. Calculating PET
This study used RayMan software to calculate PET values from 7 a.m. to 8 p.m. (every hour) on two representative summer days. This software, which was developed in accordance with guidelines of the German Engineering Society [87] at the University of
15
Freiburg, Germany, is regarded as one of the most reliable radiation and bioclimate models [24,55] to predict thermal comfort and has been approved for use in urban spaces and several climatic zones [29,34,36,59,84].
RayMan measures PET based on air temperature, air humidity, wind speed, mean radiant temperature, clothing and human activity. The period of the year, time of day and environmental obstacles allow the sky view factor (SVF) to be calculated. It can also be adjusted to account for other variables, such as the albedo of the surrounding surfaces, altitude and location, the Bowen ratio of the ground surface and the related air turbidity [30,55,56]. The software manufacturer recommends that for the assessment of thermal sensation, constants should be adjusted based on a man with a height of 1.75 m and a weight of 75 kg [24,66]. PET calculation is based on representative segments of each neighbourhood, with every street having a PET calculating point. The PET value in each neighbourhood is the average of the calculated points (Fig. 2).
3.5.2.2. Scoring PET
To score PET in a Csa, a scale from 0 to 1 was adopted according to the TSV defined in Tel Aviv, which is characterised by a Csa. The thermal comfort range that reflects a neutral sensation of the TSV classification is estimated at between 19°C and 25°C for winter, and between 20°C and 26°C in the summer [24]. For cold and hot and very hot the score of PET is 0; for cool and warm, 0.25; for slightly cool and slightly warm, 0.5; and for the neutral thermal sensation, 1 (see Tables 3 and 4).
16
Table 3. Thermal sensation and PET range for Tel Aviv (Csa) [77,89,90].
TSV Thermal sensation PET range for Tel Aviv
(°C)
Tel Aviv climatic zone (Köppen classification) –4 Very cold – Csa –3 Cold 8 –2 Cool 12 –1 Slightly cool 15 0 Neutral 19 1 Slightly warm 26 2 Warm 28 3 Hot 34 4 Very hot 40 a
Subtropical (Csa) ; TSV, thermal sensation vote scale.
Table 4. PET scores according to thermal sensation and PET range in a Csa.
PET range PET scores
8–12°C 0 12.1-15°C 0.25 15.1–19°C 0.5 19.1–26°C 1 26.1–28°C 0.5 28.1–34°C 0.25 34.1–40°C 0 3.6. Case study
The field study was conducted in the city of Annaba, Algeria (36°54N, 7°46E; +5 m above sea level) with a population of 640,050 (National Office of Statistics, 2008). Annaba is characterised by a hot-summer Mediterranean climate (Csa) according to the Köppen [91] classification. In the 2015–2019 period, the air temperature varied from 12°C to 22°C (maximum) and 4°C to 11°C (minimum) in winter, and the maximum summer air temperature varied from 26°C to 36.5°C. The minimum summer temperature varied from 15°C to 24°C. The Colonial Centre and the Old Town (Medina) are located in Annaba city centre, and they are rated as the most walkable neighbourhoods (66% and 64% walking scores, respectively, based on [92]). In addition, a dense commercial area means that the city centre plays a significant role.
17
PET calculation is based on representative segments of each neighbourhood according to the following criteria: street hierarchy, street width, standard sidewalks, slight slope, the height of buildings, street orientation, street length, and vegetative species and their distribution.
Source: PDAU Annaba, 2004
Fig 2 Selected streets at Colonial Center and Old Town in Annaba city centre.
4. Results
Distinct neighbourhoods regardless of their characteristics can be evaluated using the CWI model, as the indicators and standards are from leading models and current research. We studied two areas to test the CWI model; the PET values of each neighbourhood are taken from average PET values of selected streets.
18
4.1. Pedestrian comfort facility coefficients and scores
Table 5 shows the results of coefficients and scores at the neighbourhood micro scale. Each neighbourhood had four representative streets characterised by their length varying between 230 m and 510 m in the Colonial Centre, and between 116 m and 428 m in the Old Town along different orientations: North, South, East, West, North-west–South-east and North-east–South-west. The selected streets in each neighbourhood were used to get the neighbourhood representative PET based on street computing point. In total, 21 pedestrian facilities in addition to thermal comfort were tested at the neighbourhood micro scale.
According to the survey results, 95% of the indicators were considered very important and necessary, with coefficients of 0.80–0.93 and 0.67–0.77, respectively (e.g., landscaping and trees, footpath pavement ramps, pedestrian signals, footpath width, slope); the exception was one indicator (rubbish bins) that was viewed as less critical (coefficient of 0.32). The perception of participants varied from very good, good, some problems, many problems to awful, with respective scores of 0.79, 0.52–0.65, 0.4–0.47, 0.2–0.39 and 0.14–0.18. The scores for the Colonial Centre were higher than those for the Old Town (Fig. 3).
Most of the pedestrian facilities in the Colonial Centre scored highly, indicating their pleasant condition (0.60-0.79) (e.g., benches and seating areas, slope, social spaces, landscaping and trees, footpath pavements), although there were some exceptions (facilities such as lighting, ramps). In contrast, few indicators were estimated as good in the Old Town, with the highest score assigned to shade. Most pedestrian facilities received low scores of 0.18–0.23 (e.g., benches and seating areas, footpath width, landscaping and trees, ramps, parks, spaces for playing) reflecting their awful condition (Table 5).
Analysis of the comfort indicator scores in the Colonial Centre shows that PET values achieved both the maximum score of 1 and the lowest score of 0, compared with pedestrian comfort facilities where benches and seating areas earned the highest score of 0.79 versus
19
ramps, which were evaluated with the lowest score of 0.2 (Fig. 4). In the Old Town, PET values also achieved both the maximum score of 1 and the lowest score of 0, compared with shade, with a score of 0.54, and toilets, with a score of 0.14 (Fig. 5).
20 Table 5. Scores and coefficients of walkability comfort indicators in two selected areas. 1
N: North, S: South, E: East, W: West, NW/SE: North-west/South-east, NE/SW: North-east/South-west. 2
3 4
Colonial Centre neighbourhood Old Town neighbourhood
Street 1 Street 2 Street 3 Street 4 Street 5 Street 6 Street 7 Street 8
Orientation NE/SW E/W N/S NW/SE N/S E/W NE/SW NW/SE
Street length 510 m 435.43 m 410.26 m 230.46 m 427.66 m 239.21 m 115.84 m 163.96 m
Indicators Coefficient Average scores at Colonial Centre Average scores at Old Town
Landscaping and trees 0.93 0.62 0.23
Footpath pavement 0.92 0.6 0.25
Parks and spaces for playing 0.85 0.52 0.18
Shade/thermal comfort 0.85 0.59 0.54
Markings (crosswalk) 0.84 0.55 0.26
Benches and seating areas 0.84 0.79 0.39
Toilets 0.82 0.54 0.14
Buffer and barriers (kerbs and furnishing zone) 0.80 0.52 0.25
Social spaces (cafés) 0.80 0.62 0.47
Sidewalk on both sides 0.80 0.59 0.33
Ramps 0.77 0.2 0.18
Mid-block crossings 0.76 0.38 0.21
Pedestrian signals 0.76 0.59 0.43
Width of footpaths 0.75 0.47 0.25
Shorter crossing distances (kerb extension) 0.73 0.4 0.34
Slower traffic speed 0.72 0.23 0.24
Slope 0.71 0.65 0.41
Lighting 0.69 0.34 0.2
Fewer traffic lanes 0.68 0.46 0.28
Standard driveways 0.67 0.37 0.22
21 5
Fig. 3. Comparison of the pedestrian comfort indicators scores in the two selected neighbourhoods. 6
7
8
Fig. 4. Scores for pedestrian facilities and PET values in the Colonial Centre on two representative 9 summer days 10 11 12 0 0.1 0.2 0.3 0.4 0.5 0.6 0.7 0.8 0.9 L an d sca p in g a n d t re es F o o tp at h p av eme n t P ar k s an d sp ac es fo r p la y in g S h ad e M ar k in g s (c ro ssw al k ) B en ch es an d se at in g a re as T o il et s B u ff er a n d b ar ri er s (k er b s … S o ci al sp ac es (c af és) S id ew al k o n b o th si d es R amp s Mid -b lo ck c ro ssi n g s P ed est ri an si g n al s W id th o f fo o tp at h s S h o rt er cr o ss in g d ista n ce s … S lo w er t ra ff ic sp ee d S lo p e L ig h ti n g F ew er t ra ff ic l an es S ta n d ar d d ri v ew ay s F u rn it u re a n d f ac il it ie s …
Colonial center scores Old Town scores
Pesdestrian comfort indicators
C om parai son of pedest ri an com fort ind icat ors on sel ec ted are a 0 0.2 0.4 0.6 0.8 1 1.2 L an ds ca pi ng a n d tr ee s F ootpath pa v em ent P ar ks a n d spa ce s for pl ay ing S h ade M ar ki n g s (c ros swa lk) B en ch es a n d se ati n g a re as T oi le ts B u ff er a n d ba rr ie rs ( ke rbs a n d … S oc ia l spa ce s (c af és ) S ide wa lk on both s ide s R am ps M id -bl oc k cr os si n g s P ede str ia n s ig n al s W idth of f ootpath s S h or ter c ros si n g di stan ce s (ke rb … S lowe r tr af fi c spe ed S lope L ig h ti ng F ewe r tr af fi c la n es S tan da rd dr iv ewa y s F u rn it u re a n d fa ci li ties ( ru bbi sh … P E T 1 P E T 1 P E T 1 P E T 1 P E T 1 P E T 1 P E T 1 P E T 1 P E T 1 P E T 1 P E T 1 P E T 1 P E T 2 P E T 2 P E T 2 P E T 2 P E T 2 P E T 2 P E T 2 P E T 2 P E T 2 P E T 2 P E T 2 P E T 2 P E T 2 P E T 2
Colonial center scores
T he scor es of com fort i ndica tors at C ol oni al C ent er Comfort indicators
22 13
14
Fig. 5. Scores for pedestrian facilities and PET values in the Old Town on two representative summer 15
days 16
4.2. PET values and scores in the two neighbourhoods
17 18
PET1 and PET2 are the PET values in the Colonial Centre on 18 July and 8 August 19
2017, respectively; PET3 and PET4 are those in the Old Town on the same dates, 20
respectively. 21
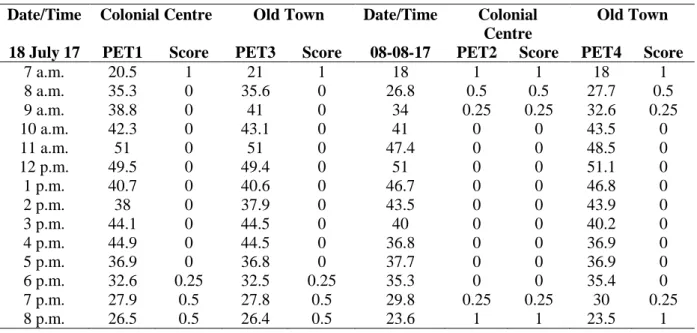
PET1–PET4 values indicate hourly differences. Table 6 summarises the PET values 22
for the representative summer days (7 a.m. – 8 a.m.) according to the TSV in a Csa. Figure 6 23
shows that PET1 and PET3 values are similar at the same hours of the day. The highest score 24
is 1 at 7 a.m., which means that the thermal sensation is neutral; from 8 a.m. to 5 p.m., the 25
score is 0, reflecting a thermal perception of hot or very hot; at 6 .p.m. the PET value is 0.25, 26
indicating a thermal perception of warm. Between 7 p.m. and 8 p.m., there is a slightly warm 27
thermal sensation, with a score of 0.5 (Table 6). 28
Figure 6 also shows that PET 2 and PET 4 scores are similar at the same hours of the 29
day. The highest score is 1 at 7 a.m., indicating a neutral thermal sensation. However, at 8 30 0 0.2 0.4 0.6 0.8 1 1.2 La n d sc ap in g an d t ree s Fo o tp at h p av em en t Pa rk s an d s p ac es f o r p la yi n g Sh ad e M ar ki n gs ( cr o ss w al k) B en ch es an d s ea ti n g ar ea s To ilet s B u ff er an d b ar ri ers ( kerb s an d … So ci al s p ac es ( ca fés ) Si d ew al k o n b o th s id es R am p s M id -b lo ck c ro ss in gs Ped es tr ia n s ig n al s W id th o f f o o tp at h s Sh o rt er cr o ss in g d is ta n ces ( kerb … Sl o w er tr af fi c sp ee d Sl o p e Li gh ti n g Few er tr af fi c la n es St an d ar d d ri vew ay s Fu rn it u re an d f ac ili ti es ( ru b b is h … PE T3 PE T3 PE T3 PE T3 PE T3 PE T3 PE T3 PE T3 PE T3 PE T3 PE T3 PE T3 PE T3 PE T3 PE T4 PE T4 PE T4 PE T4 PE T4 PE T4 PE T4 PE T4 PE T4 PE T4 PE T4 PE T4 PE T4 PE T4
Old Town scores
T h e sco res o f co m fo rt in d icato rs at Old T o w n Comfort indicators
23
a.m., there are two PET scores of 1 and 0.5, indicating differing thermal perceptions, one 31
neutral and the other slightly warm, respectively. At 9 a.m. and 7 p.m., the value of 0.25 32
indicates a warm thermal sensation. Between 10 a.m. and 6 p.m., the PET score is 0, 33
indicating a hot or very hot thermal perception (Table 6). 34
35
Fig. 6. Changes in PET values in the two selected areas on the two representative summer days.
36
Table 6.PET scores according to the TSV scale in a Csa. 37
Date/Time Colonial Centre Old Town Date/Time Colonial
Centre
Old Town
18 July 17 PET1 Score PET3 Score 08-08-17 PET2 Score PET4 Score
7 a.m. 20.5 1 21 1 18 1 1 18 1 8 a.m. 35.3 0 35.6 0 26.8 0.5 0.5 27.7 0.5 9 a.m. 38.8 0 41 0 34 0.25 0.25 32.6 0.25 10 a.m. 42.3 0 43.1 0 41 0 0 43.5 0 11 a.m. 51 0 51 0 47.4 0 0 48.5 0 12 p.m. 49.5 0 49.4 0 51 0 0 51.1 0 1 p.m. 40.7 0 40.6 0 46.7 0 0 46.8 0 2 p.m. 38 0 37.9 0 43.5 0 0 43.9 0 3 p.m. 44.1 0 44.5 0 40 0 0 40.2 0 4 p.m. 44.9 0 44.5 0 36.8 0 0 36.9 0 5 p.m. 36.9 0 36.8 0 37.7 0 0 36.9 0 6 p.m. 32.6 0.25 32.5 0.25 35.3 0 0 35.4 0 7 p.m. 27.9 0.5 27.8 0.5 29.8 0.25 0.25 30 0.25 8 p.m. 26.5 0.5 26.4 0.5 23.6 1 1 23.5 1 38 39 40 41 0 10 20 30 40 50 60
7 a.m. 8 a.m. 9 p.m. 10 a.m 11 a.m. 12 a.m. 1 a.m. 2 a.m. 3 a.m. 4 a.m. 5 a.m. 6 a.m. 7 p.m. 8 p.m.
PET1 PET2 PET3 PET4
Time(H)
P
E
24
4.3. The CWI
42 43
We used Equation (1) to calculate the CWI in the two selected areas on the two 44
representative summer days (18 July and 8 August 2017). Our estimated model explains the 45
contributions of thermal comfort and pedestrian facilities to a pleasant walking experience. 46
The highest CWI value was 40.95% in the Colonial Centre on both representative days 47
at 7 a.m. (Fig. 7), when the thermal sensation was neutral, defining a rarely acceptable 48
average comfort quality that necessitates improvements (Table 1). The minimum CWI value 49
was 37.09%, that is, a hot thermal sensation, which indicated an uncomfortable walking 50
experience. CWI reached new scores (38% and 39%) when the thermal perception was warm 51
and slightly warm, respectively, with a lower classification which reflected uncomfortable 52
conditions and low comfort quality (Fig. 7). 53
For the Old Town, the recorded scores were lower than for the Colonial Centre. The 54
highest CWI value was 25.23% at 7 a.m. when the thermal sensation was neutral, illustrating 55
uncomfortable comfort conditions and minimal pedestrian facilities. CWI reached its 56
minimum value (21.45%) when the thermal perception was hot, with increasing scores 57
(22.32% and 23.36%) with a warm and slightly warm thermal sensation (Fig. 8). Despite 58
these reported differences in thermal sensation, the CWI remained between 20% and 39%, 59
which indicates a low comfort quality level and needed improvements. 60
The results also showed that the CWI scores were almost identical over the two days, 61
although thermal perception differed marginally depending on the time of day. For example, 62
on 8 August, a neutral thermal sensation was recorded at 7 a.m. and 8 a.m., compared with 63
only at 7 a.m. on 18 July, giving the highest CWI value in both neighbourhoods (40.95% vs 64
25.23%). The minimum CWI ratings (37.09% and 21.36%) occurred from 10 a.m. and 65
remained constant until 6 p.m. on 8 August, compared with from 9 a.m. to 5 p.m. on 18 July, 66
with a hot thermal sensation (Fig. 9). 67
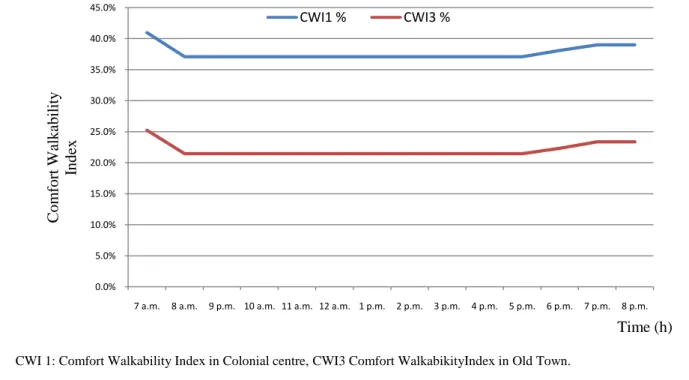
25 68
CWI 1: Comfort Walkability Index in Colonial centre, CWI3 Comfort WalkabikityIndex in Old Town.
69 70
Fig. 7. Changes in CWI in the two neighbourhoods on 18 July 2017.
71
72
CWI2: Comfort Walkability Index in Colonial centre,CWI4 Comfort WalkabikityIndex in Old Town.
73
Fig. 8. Changes in CWI in the two neighbourhoods on 8 August 2017.
74 75 76 77 0.0% 5.0% 10.0% 15.0% 20.0% 25.0% 30.0% 35.0% 40.0% 45.0%
7 a.m. 8 a.m. 9 p.m. 10 a.m. 11 a.m. 12 a.m. 1 p.m. 2 p.m. 3 p.m. 4 p.m. 5 p.m. 6 p.m. 7 p.m. 8 p.m.
CWI1 % CWI3 % C om for t Wal kabi li ty Index Time (h) 0.0% 5.0% 10.0% 15.0% 20.0% 25.0% 30.0% 35.0% 40.0% 45.0%
7 a.m. 8 a.m. 9 a.m. 10 a.m. 11 a.m. 12 a.m. 1 p.m. 2 p.m. 3 p.m. 4 p.m. 5 p.m. 6 p.m. 7 p.m. 8 p.m.
CWI2 % CWI4 % Time (h) C om for t Wal kabi li ty Index
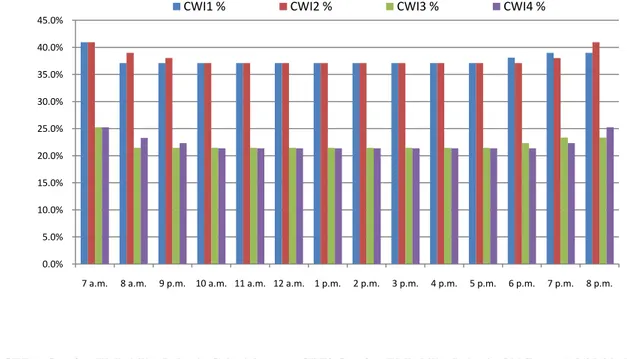
26 78
CWI 1: Comfort Walkability Index in Colonial centre, CWI3 Comfort Walkability Index in Old Town. (18/07/2017).
79
CWI2: Comfort Walkability Index in Colonial centre, CWI4 Comfort Walkability Index in Old Town. (08/08/2017).
80
Fig. 9. Changes in CWI in the two neighbourhoods on the two representative summer days.
81
5. Discussion
82
While most existing assessment tools evaluate sidewalks at the street level, few studies 83
have examined sidewalks at the neighbourhood scale. The proposed model presents an easy-84
to-follow method for the assessment of walkability comfort indicators on the neighbourhood 85
micro scale. 86
5.1. Coefficients and scores of pedestrian comfort facilities
87 88
As revealed by the survey, landscaping and trees were estimated as the most 89
significant indicator for respondents of the questionnaire (0.93), which highlighted their role 90
in providing pleasant and attractive streets [1,8], with a shady environment and landscaped 91
views [12], thereby promoting rain infiltration and improving the local microclimate [44], as 92
well as enhancing pedestrian safety [8,14,22,93]. Shade, parks and spaces for playing were 93
also rated as very important in providing relaxation areas for inhabitants. 94 0.0% 5.0% 10.0% 15.0% 20.0% 25.0% 30.0% 35.0% 40.0% 45.0%
7 a.m. 8 a.m. 9 p.m. 10 a.m. 11 a.m. 12 a.m. 1 p.m. 2 p.m. 3 p.m. 4 p.m. 5 p.m. 6 p.m. 7 p.m. 8 p.m.
27
Furthermore, these characteristics improve the attractiveness and security of walkways 95
[44,94–96], enhancing well-being, comfort and health. Our results are also consistent with 96
those of Aghaabbasi et al.[8], which emphasised the contribution of seating areas and benches 97
to the attractiveness of sidewalks, and the convenience and comfort for pedestrians [97], 98
especially for improved access for people with disabilities [48]. Moreover, these indicators 99
can be considered as fundamental factors that affect pedestrian safety [35,98]. Mid-block 100
crossings, slope and slower traffic speed are also considered important indicators because 101
their absence generates an unpleasant effect on comfort and safety. Pedestrian signals had a 102
weighting of 0.76, which shows that they are a principal comfort indicator that ensures 103
usability and safety [35]. 104
Another important walkability indicator is path width, with a weighting of 0.75; 105
clearly, path width can affect the comfort, attractiveness and safety of the walking experience 106
[7,8]. However, some sidewalk features, such as lighting, fewer traffic lanes and standard 107
driveways with a weighting of 0.67–0.71 drew less attention than other comfort indicators. 108
Rubbish bins had the lowest weighting of 0.32. 109
The scores for each neighbourhood are related to people’s perception of the area. 110
Notably, the obtained scores corroborate that these perceptions are in line with actual 111
conditions. For instance, in the Colonial Centre, furniture and facilities, rubbish bins, 112
footpaths, sidewalks on both sides and pedestrian signals have high scores because this area is 113
well maintained by the local authorities as a popular tourist location. The Colonial Centre also 114
has a sufficient number of sitting areas and benches, social spaces (cafés), landscaping and 115
trees, and shade (courts and squares), all of which are essential for the pedestrian comfort 116
level. The Old Town scores are lower than the Colonial Centre for all comfort indicators 117
except for slower traffic speed (Table 5). Owing to the layout of the medieval neighbourhood 118
of the Old Town, with its twisting, irregular streets, vehicles in the area tend to respect speed 119
28
limits. As presented in Table 3, the TSV considered in the summer period was varying 120
between neutral, slightly warm, warm, hot and very hot. 121
Our analysis shows that PET values vary depending mainly on the time of day on the 122
two representative days. The highest CWI values were neutral, for the lowest category of 123
thermal sensation, followed by slightly warm and warm. The lowest CWI values were hot and 124
very hot, for the highest category of thermal sensation. 125
The highest CWI values represent a neutral thermal sensation, which is considered an 126
acceptable thermal comfort satisfaction level [60] during the summer period. Moreover, a 127
neutral temperature is always related to a comfortable feeling [55]. The changes in the CWI 128
during the two representative days in each neighbourhood reflect their dependence on the 129
user’s thermal sensation and comfortable weather conditions. Our findings are supported by 130
those of Cohen et al. [89] and Givoni et al. [52], and confirm the importance of the climatic 131
conditions in outdoor urban spaces and highlight their impact on quality of life and well-being 132
in cities. Thus, a neutral thermal sensation characterises the recommended walking hours in 133
the summer season (18<PET<23.6), followed by a slightly warm (26.8<PET<27.9) and a 134
warm (29.8<PET<34) thermal sensation. In contrast, hot and very hot thermal sensations 135
(35.3<PET<51) can be taken as uncomfortable walking conditions. It is of note that urban 136
greening reduces daytime heat in the outdoor environment, and provides large areas of shade 137
from tree canopies [85], thereby promoting walking even in the hot hours of the day. 138
To our knowledge, this study is the first to evaluate the walkability comfort level by 139
including thermal comfort indices. The CWI tool has been developed to assess the standard 140
pedestrian comfort features in neighbourhoods together with PET in a Csa. Comfort facilities 141
and the thermal comfort of pedestrians encourage inhabitants to walk, thereby contributing to 142
a healthy life. Moreover, the CWI indicated a good match with the real-life conditions in the 143
two study areas. 144
29
6. Conclusion
145
Application of these comfort indicators can lead to enhancing comfort quality and may 146
allow people to have a more pleasant walking experience in an urban environment. The CWI 147
model would also help municipalities to improve the quality of life and contribute to 148
increasing sustainable development strategies and health promotion. Our assessment tool 149
indicated a strong correlation with the current real-life conditions of the two neighbourhoods 150
studied, thereby confirming its reliability and reflecting the model-based performance. The 151
model proposed in this study was applied to two different neighbourhoods in the city of 152
Annaba, Algeria, by considering their distinct types of streets beside the suitability of 153
considering PET as a thermal comfort indicator.PET was validated during different hours of 154
the day considering air temperature, wind speed and relative humidity.CWI model is a 155
relevant tool for the assessment of walkability including thermal comfort in different 156
neighbourhood microscale level. In its initial design, this tool included a number of comfort 157
indicators that were appropriate for all categories of users, such as slope, slower traffic speed, 158
shorter crossing distances (kerb extensions) and ramps. However, there were some specific 159
comfort indicators (e.g., drinking fountains, tactile pavements, skybridge lifts) that were not 160
appropriate for the selected neighbourhoods due to their rare presence. Including potential 161
thermal comfort indices such as the mean radiant temperature (Tmrt) at the street scale allowed
162
for enhanced precision with respect to PET values. Finally, using this model in other cities 163
characterised by Csa or other climatic contexts represents a potential direction for future 164
research. Exploring additional requirements on street level, such as microclimate 165
measurement, shade or the UTCI index may provide an interesting alternative to evaluate 166
thermal comfort effect on walkability as physical activity and provide additional comparative 167
analysis for future research. 168
30
Acknowledgements
170
I wish to thank all of those who have supported my research for their useful comments 171
during its completion. In particular, I would like to acknowledge the Local Environment 172
Management and Analysis (LEMA) group at the University of Liège. The funding for this 173
project was made possible through a research grant obtained from the Ministry of Higher 174
Education and Scientific Research Algeria under the Programme National Exceptionnel 175 (PNE). 176 177 References 178
[1] Z. Asadi-Shekari, M. Moeinaddini, M. Aghaabbasi, M. Cools, and M. Zaly Shah, ‘Exploring 179
effective micro-level items for evaluating inclusive walking facilities on urban streets (applied in 180
Johor Bahru, Malaysia)’, Sustainable Cities and Society, vol. 49, p. 101563, Aug. 2019, doi: 181
10.1016/j.scs.2019.101563. 182
[2] D. Burden, ‘Building Communities with Transportation’, Transportation Research Record, vol. 183
1773, no. 1, pp. 5–20, Jan. 2001, doi: 10.3141/1773-02. 184
[3] M. Moeinaddini, Z. Asadi-Shekari, and M. Zaly Shah, ‘An urban mobility index for evaluating and 185
reducing private motorized trips’, Measurement, vol. 63, pp. 30–40, Mar. 2015, doi: 186
10.1016/j.measurement.2014.11.026. 187
[4] A. Ruiz-Padillo, F. M. Pasqual, A. M. Larranaga Uriarte, and H. B. B. Cybis, ‘Application of multi-188
criteria decision analysis methods for assessing walkability: A case study in Porto Alegre, Brazil’, 189
Transportation Research Part D: Transport and Environment, vol. 63, pp. 855–871, Aug. 2018,
190
doi: 10.1016/j.trd.2018.07.016. 191
[5] H. Badland et al., ‘Using simple agent-based modeling to inform and enhance neighborhood 192
walkability’, Int J Health Geogr, vol. 12, no. 1, p. 58, 2013, doi: 10.1186/1476-072X-12-58. 193
[6] C. Boulange, C. Pettit, L. D. Gunn, B. Giles-Corti, and H. Badland, ‘Improving planning analysis 194
and decision making: The development and application of a Walkability Planning Support 195
System’, Journal of Transport Geography, vol. 69, pp. 129–137, May 2018, doi: 196
10.1016/j.jtrangeo.2018.04.017. 197
[7] M. Aghaabbasi, M. Moeinaddini, M. Zaly Shah, and Z. Asadi-Shekari, ‘A new assessment model 198
to evaluate the microscale sidewalk design factors at the neighbourhood level’, Journal of 199
Transport & Health, vol. 5, pp. 97–112, Jun. 2017, doi: 10.1016/j.jth.2016.08.012.
200
[8] M. Aghaabbasi, M. Moeinaddini, M. Zaly Shah, Z. Asadi-Shekari, and M. Arjomand Kermani, 201
‘Evaluating the capability of walkability audit tools for assessing sidewalks’, Sustainable Cities 202
and Society, vol. 37, pp. 475–484, Feb. 2018, doi: 10.1016/j.scs.2017.12.001.
203
[9] F. Moura, P. Cambra, and A. B. Gonçalves, ‘Measuring walkability for distinct pedestrian groups 204
with a participatory assessment method: A case study in Lisbon’, Landscape and Urban 205
Planning, vol. 157, pp. 282–296, Jan. 2017, doi: 10.1016/j.landurbplan.2016.07.002.
206
[10] M. Habibian and A. Hosseinzadeh, ‘Walkability index across trip purposes’, Sustainable Cities 207
and Society, vol. 42, pp. 216–225, Oct. 2018, doi: 10.1016/j.scs.2018.07.005.
31
[11] C. M. Hall and Y. Ram, ‘Walk score® and its potential contribution to the study of active 209
transport and walkability: A critical and systematic review’, Transportation Research Part D: 210
Transport and Environment, vol. 61, pp. 310–324, Jun. 2018, doi: 10.1016/j.trd.2017.12.018.
211
[12] M. Taleai and E. Taheri Amiri, ‘Spatial multi-criteria and multi-scale evaluation of walkability 212
potential at street segment level: A case study of tehran’, Sustainable Cities and Society, vol. 31, 213
pp. 37–50, May 2017, doi: 10.1016/j.scs.2017.02.011. 214
[13] H. Wang and Y. Yang, ‘Neighbourhood walkability: A review and bibliometric analysis’, Cities, 215
vol. 93, pp. 43–61, Oct. 2019, doi: 10.1016/j.cities.2019.04.015. 216
[14] B. W. Landis, V. R. Vattikuti, R. M. Ottenberg, D. S. McLeod, and M. Guttenplan, ‘Modeling the 217
Roadside Walking Environment: Pedestrian Level of Service’, Transportation Research Record, 218
vol. 1773, no. 1, pp. 82–88, Jan. 2001, doi: 10.3141/1773-10. 219
[15] E. N. Ussery et al., ‘Sampling methodology and reliability of a representative walkability audit’, 220
Journal of Transport & Health, vol. 12, pp. 75–85, Mar. 2019, doi: 10.1016/j.jth.2018.11.007.
221
[16] P. Cambra, ‘Pedestrian accessibility and attractiveness indicators for walkability assessment’, 222
Lisbon: Department of Civil Engineering and Architecture, Instituto Superior Técnico,
223
Universidade Técnica de Lisboa, 2012.
224
[17] Sarkar S., ‘Qualitative Evaluation of Comfort Needs in Urban Walkways in Major Activity 225
Centers’, Transportation Research Board, Washington, D.C, vol. 4, pp. 39–59, 2002. 226
[18] T. Akiyama and J. Kim, ‘Transportation Policies for the Elderly and Disabled in Japan’, 227
International Journal of Urban Sciences, vol. 9, no. 2, pp. 87–98, Oct. 2005, doi:
228
10.1080/12265934.2005.9693575. 229
[19] U. Architectural and T. B. C. Board, ‘Americans with Disabilities Act (ADA)’, Accessibility 230
Guidelines for Buildings and Facilities (ADAAG), 1992.
231
[20] K. J. Clifton, A. D. Livi Smith, and D. Rodriguez, ‘The development and testing of an audit for the 232
pedestrian environment’, Landscape and Urban Planning, vol. 80, no. 1–2, pp. 95–110, Mar. 233
2007, doi: 10.1016/j.landurbplan.2006.06.008. 234
[21] A. B. Jacobs, ‘Great streets’, ACCESS Magazine, vol. 1, no. 3, pp. 23–27, 1993. 235
[22] Q. Lamour, A. M. Morelli, and K. R. de C. Marins, ‘Improving walkability in a TOD context: 236
Spatial strategies that enhance walking in the Belém neighbourhood, in São Paulo, Brazil’, Case 237
Studies on Transport Policy, vol. 7, no. 2, pp. 280–292, Jun. 2019, doi:
238
10.1016/j.cstp.2019.03.005. 239
[23] C. C. Marcus and C. Francis, People places: design guidlines for urban open space. John Wiley & 240
Sons, 1997. 241
[24] P. Cohen, O. Potchter, and A. Matzarakis, ‘Human thermal perception of Coastal Mediterranean 242
outdoor urban environments’, Applied Geography, vol. 37, pp. 1–10, Feb. 2013, doi: 243
10.1016/j.apgeog.2012.11.001. 244
[25] M. Nikolopoulou and S. Lykoudis, ‘Thermal comfort in outdoor urban spaces: Analysis across 245
different European countries’, Building and Environment, vol. 41, no. 11, pp. 1455–1470, Nov. 246
2006, doi: 10.1016/j.buildenv.2005.05.031. 247
[26] O. Potchter, P. Cohen, T.-P. Lin, and A. Matzarakis, ‘Outdoor human thermal perception in 248
various climates: A comprehensive review of approaches, methods and quantification’, Science 249
of The Total Environment, vol. 631–632, pp. 390–406, Aug. 2018, doi:
250
10.1016/j.scitotenv.2018.02.276. 251
[27] E. Johansson, S. Thorsson, R. Emmanuel, and E. Krüger, ‘Instruments and methods in outdoor 252
thermal comfort studies – The need for standardization’, Urban Climate, vol. 10, pp. 346–366, 253
Dec. 2014, doi: 10.1016/j.uclim.2013.12.002. 254
[28] Á. Gulyás, J. Unger, and A. Matzarakis, ‘Assessment of the microclimatic and human comfort 255
conditions in a complex urban environment: Modelling and measurements’, Building and 256
Environment, vol. 41, no. 12, pp. 1713–1722, Dec. 2006, doi: 10.1016/j.buildenv.2005.07.001.
257
[29] A. H. A. Mahmoud, ‘Analysis of the microclimatic and human comfort conditions in an urban 258
park in hot and arid regions’, Building and Environment, vol. 46, no. 12, pp. 2641–2656, Dec. 259
2011, doi: 10.1016/j.buildenv.2011.06.025. 260
32
[30] A. Matzarakis, F. Rutz, and H. Mayer, ‘Modelling radiation fluxes in simple and complex 261
environments—application of the RayMan model’, Int J Biometeorol, vol. 51, no. 4, pp. 323– 262
334, Feb. 2007, doi: 10.1007/s00484-006-0061-8. 263
[31] S. Thorsson, T. Honjo, F. Lindberg, I. Eliasson, and E.-M. Lim, ‘Thermal Comfort and Outdoor 264
Activity in Japanese Urban Public Places’, Environment and Behavior, vol. 39, no. 5, pp. 660– 265
684, Sep. 2007, doi: 10.1177/0013916506294937. 266
[32] M. Nikolopoulou and S. Lykoudis, ‘Use of outdoor spaces and microclimate in a Mediterranean 267
urban area’, Building and Environment, vol. 42, no. 10, pp. 3691–3707, Oct. 2007, doi: 268
10.1016/j.buildenv.2006.09.008. 269
[33] M. Nikolopoulou, N. Baker, and K. Steemers, ‘Thermal comfort in outdoor urban spaces: 270
understanding the human parameter’, Solar Energy, vol. 70, no. 3, pp. 227–235, 2001, doi: 271
10.1016/S0038-092X(00)00093-1. 272
[34] F. Costamagna, R. Lind, and O. Stjernström, ‘Livability of Urban Public Spaces in Northern 273
Swedish Cities: The Case of Umeå’, Planning Practice & Research, vol. 34, no. 2, pp. 131–148, 274
Mar. 2019, doi: 10.1080/02697459.2018.1548215. 275
[35] M. Aghaabbasi, M. Moeinaddini, Z. Asadi-Shekari, and M. Z. Shah, ‘The equitable use concept in 276
sidewalk design’, Cities, vol. 88, pp. 181–190, May 2019, doi: 10.1016/j.cities.2018.10.010. 277
[36] Z. Asadi-Shekari, M. Moeinaddini, and M. Zaly Shah, ‘Pedestrian safety index for evaluating 278
street facilities in urban areas’, Safety Science, vol. 74, pp. 1–14, Apr. 2015, doi: 279
10.1016/j.ssci.2014.11.014. 280
[37] M. Kwon, C. Lee, and Y. Xiao, ‘Exploring the role of neighborhood walkability on community 281
currency activities: A case study of the crooked river alliance of TimeBanks’, Landscape and 282
Urban Planning, vol. 167, pp. 302–314, Nov. 2017, doi: 10.1016/j.landurbplan.2017.07.008.
283
[38] M. Nilles and I. Kaparias, ‘Investigating the relation of highway design standards with network-284
level walkability: The case study of Luxembourg’, International Journal of Transportation 285
Science and Technology, vol. 7, no. 4, pp. 254–263, Dec. 2018, doi: 10.1016/j.ijtst.2018.08.001.
286
[39] K. L. Cain et al., ‘Developing and validating an abbreviated version of the Microscale Audit for 287
Pedestrian Streetscapes (MAPS-Abbreviated)’, Journal of Transport & Health, vol. 5, pp. 84–96, 288
Jun. 2017, doi: 10.1016/j.jth.2017.05.004. 289
[40] B. E. Saelens and S. L. Handy, ‘Built Environment Correlates of Walking: A Review’, Medicine & 290
Science in Sports & Exercise, vol. 40, no. Supplement, pp. S550–S566, Jul. 2008, doi:
291
10.1249/MSS.0b013e31817c67a4. 292
[41] Z. Asadi-Shekari, M. Moeinaddini, and M. Zaly Shah, ‘Disabled Pedestrian Level of Service 293
Method for Evaluating and Promoting Inclusive Walking Facilities on Urban Streets’, J. Transp. 294
Eng., vol. 139, no. 2, pp. 181–192, Feb. 2013, doi: 10.1061/(ASCE)TE.1943-5436.0000492.
295
[42] K. R. Rahaman, J. M. Lourenço, and J. M. Viegas, ‘Perceptions of Pedestrians and Shopkeepers 296
in European Medium-Sized Cities: Study of Guimarães, Portugal’, J. Urban Plann. Dev., vol. 138, 297
no. 1, pp. 26–34, Mar. 2012, doi: 10.1061/(ASCE)UP.1943-5444.0000094. 298
[43] Z. Asadi-Shekari, M. Moeinaddini, and M. Zaly Shah, ‘A pedestrian level of service method for 299
evaluating and promoting walking facilities on campus streets’, Land Use Policy, vol. 38, pp. 300
175–193, May 2014, doi: 10.1016/j.landusepol.2013.11.007. 301
[44] G. A. Battista and K. Manaugh, ‘Stores and mores: Toward socializing walkability’, Journal of 302
Transport Geography, vol. 67, pp. 53–60, Feb. 2018, doi: 10.1016/j.jtrangeo.2018.01.004.
303
[45] L. B. Dixon, ‘Bicycle and Pedestrian Level-of-Service Performance Measures and Standards for 304
Congestion Management Systems’, Transportation Research Record, vol. 1538, no. 1, pp. 1–9, 305
Jan. 1996, doi: 10.1177/0361198196153800101. 306
[46] P. Grahn and U. A. Stigsdotter, ‘Landscape planning and stress’, Urban Forestry & Urban 307
Greening, vol. 2, no. 1, pp. 1–18, Jan. 2003, doi: 10.1078/1618-8667-00019.
308
[47] S. U. Jensen, ‘Pedestrian and Bicyclist Level of Service on Roadway Segments’, Transportation 309
Research Record, vol. 2031, no. 1, pp. 43–51, Jan. 2007, doi: 10.3141/2031-06.

![Table 3. Thermal sensation and PET range for Tel Aviv (Csa) [77,89,90].](https://thumb-eu.123doks.com/thumbv2/123doknet/5612052.135222/16.892.97.797.144.356/table-thermal-sensation-pet-range-tel-aviv-csa.webp)