An Analytical Cost Assessment Module for the Detailed Design Stage
1Jean-David Caprace, Philippe Rigo, Renaud Warnotte,
ANAST, University of Liege, Liège/Belgium, [email protected], [email protected] Sandrine Le Viol, Chantiers de l’Atlantique, Saint-Nazaire/France
Abstract
The main goal of the project is to implement a “real time” and automatic cost assessment model of the ship hull construction, which integrates the design criteria and production parameters. The presented method for short-term cost assessment promises to increase the productivity.
Nowadays, cost assessment is a key task of an integrated ship design. The various methods to estimate the production cost differs with the required information (input data). The less information is needed, the earlier this method can be used in the design process. The more information is used, the better we can assess the differences between design alternatives. This means:
− At the basic design stage: validate the budget and give a reliable bidding price, − At the detailed design stage:, plan the deadlines and establish the production schedule, − At the scheduling production stage: distribute the workload between the various production
workshops and assess the productivity.
A first prototype of cost assessment module reaches the validation stage at the Alstom Marine St Nazaire shipyard (Chantiers de l’Atlantique) within the framework of the European project InterSHIP which has partly financed the study. In the future, cost assessment will become increasing important. It is proposed to assist/help the designers by a “real time” follow-up of the cost, starting at the earliest conceptual design stage up to the latest detailed design stage. The development such a cost assessment tool requires considering simultaneously the design criteria and the production parameters. Designers will consequently be able to choose the least expensive options at each step of the design procedure (earlier is of course better).
1. Introduction
1.1 Why a hull cost assessment?
The shipbuilding activity requires a lot of labour. Indeed, for a passenger ship, the ship hull (steel part) represents approximately 20% of the cost of the ship and the cost of labour represents about 60% of the cost of the ship hull. For our western countries, this fact induces relocation of ship manufacturers towards regions having lower labour costs. Indeed, we can observe in the history that the leadership in shipbuilding moved from UK to Japan and latter to Korea, whereas today China is getting a bigger and bigger part of the market.
To avoid this delocalization and to remain profitable, Europeans decided to devote themselves only to the ships with high added value, like passenger ships, or with high technology, like the LNG carriers. To keep and increase their shipbuilding world market share, opposite to Asian competitors, the European shipyards are always obliged to increase their competitiveness significantly. Moreover, the nature of the European shipbuilding market prevents large production series; each ship is unique, and the installation of full automatic processes remains complex.
Even if significant efforts have already been achieved by the shipbuilding industry to reduce the costs of each individual stage of ship construction, the European objectives in this domain must still be achieved: reduction of the design and manufacturing cost (25 to 30%) as well as times of production cost (20 to 30%). Another important research field concerns the development of the best product by using multi-purpose optimization integrated design, quality, safety, environment and efficiency.
1
This paper results from part of the work performed in sub-project II.1 of InterSHIP, a European R&D project funded under the European Commission's Sixth Framework Programme for Research and Technological Development. (Project n° TIP3-CT-2004-506127)
Since the main part of the construction cost relates to the production and since the producibility of a ship is basically defined at the design stage, the main promising track of cost savings is to assess the production cost as soon as the options of construction are fixed ("Design for production/Design to cost").
The ability to assess ship construction costs is necessary for the commercial success of a shipyard; - overestimate the cost will place the shipyard out of the competitive range, and
- underestimate the cost will result in a financial loss and possible bankruptcy.
To answer at this request we implemented a “real time” and automatic cost assessment model of the ship hull construction, which integrates the design criteria and the production parameters.
1.2 Context and evolution
Whereas up to 1950, the drawing of the hull lines and the main ship elements was performed at full-scale on a floor, and thereafter projected via microfilm on sheets, today the CAD and more recently the CAM have completely replaced these old fashion methods.
Indeed, progress in these fields led to the improvement of the quality and the accuracy, which are two essential preliminaries for an effective production. Today, shipyards use various software dedicated for this purpose such as TRIBON, NAPA, CATIA and FORAN. Those integrate not only tools for drawing of smooth hull forms, structural details and piping, but also tools for structural analysis, stability calculation, resistance, propulsion and sea keeping. Moreover, such software are nowadays able to transfer the nomenclature parts to various production robot interfaces. Today, CATIA is even able with DELMIA to virtually simulate the production to increase the efficiency and the workshop productivity [2].
The objective of the present research consists in using nomenclature parts coming from CAD/CAM software for cost assessment at the "detailed design" stage.
1.3 Added Values
Today the design method used in the shipbuilding plays a primary function at the first stages of the project. According to a traditional approach, during these phases, the majority of the decisions are taken based on experiment and opinion of the designers. However, these decisions have a strong influence on the ship and also on its entire life cycle, production, maintenance, etc.
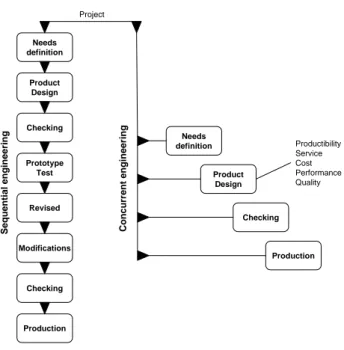
In order to compensate cost increases or quality decreases due to flexibility lost for modification of scantling (see Fig. 1) during the ship design, the shipbuilding tries to apply the concurrent engineering concept rather than a sequential engineering (see Fig. 1). The decisions of each stage are made by considering the constraints imposed by the other stages of the ship life cycle. Now, the problems that were only checked at the end of the project are now included in the design stage to reach a better solution. Each department does not wait any more until the precedent had finished but has to consider that a decision can occur in the course of project.[8]
As illustrated on Fig. 2, one of the effects of concurrent engineering is to move the information curve upstream because the effectiveness and the quality of the information on the ship are improved from the first stage of the project. This aspect is particularly strategic as the design process has a cost which varies from 5% to 15% of the total cost and moreover decisions taken during this initial stage determine about 60 to 95 % of the total cost.[9]
Methodology developed within the present research framework will increase and accurate the knowledge relating to the ship by the prediction the useful data to assess the cost before the full CAD/CAM model has been completed. Thus, the designer will know earlier more information and will be able to make the best decision from the design stage. The first errors of the project, the most expensive ones, could thus be avoided.
Needs definition Product Design Checking Prototype Test Revised Modifications Checking Production Needs definition Product Design Checking Production Productibility Service Cost Performance Quality Project Se quential enginee ring Concurr e nt engineer ing
Fig 1: Sequential engineering versus concurrent engineering
The challenge consists to create a leading assistance module for the designer during the ships design. Moreover, this prototype is optimized for the production especially for the first stage design. Indeed, it is at this stage that most profits can be made by avoiding errors in the design process which could be discovered only later. In fact, the modification costs grow with an exponential way during the progress of the project. In addition, arrived at a certain stage of project maturity, it is impossible to carry out modifications while keeping the same quality level.
100%
100% Time of the project
0% Design freedom Flexibility Information Product Increasing of model data Time reduction Basic Design Production Design Detailed Design Analytical method CAD/CAM data Cost assessment during the project Statistical method
With default value
100%
100% Time of the project
0% Design freedom Flexibility Information Product Increasing of model data Time reduction Basic Design Production Design Detailed Design Analytical method CAD/CAM data Cost assessment during the project Statistical method
With default value
Fig. 2: Evolution of the design information relating to the ship
2. Requirements of the cost assessment approach
2.1 Top-Down or Bottom-Up system
The basic idea of the project is to implement a real time and automatic cost assessment method of the ship hull production that integrates all the design criteria and the production parameters.
The methods for estimating production cost are classified into [3]:
- Top-Down (macro, cost-down or historical) approaches (empirical, statistical and close-form equations, ...), [4][5][6]
- Bottom-Up (micro, cost-up or engineering analysis) approaches (direct rational assessment) [7] Despite its popularity and frequent references in the literature, top-down approaches have serious disadvantages, which are often overlooked or concealed:
- The approach uses only global information and therefore it is not suitable to reflect local structural changes, neither to improve the producibility of structural details/parts.
- The approach is usually based on weight. Any changes that increase the weight will automatically increase the estimated cost regardless of the real effect on cost. Extreme lightweight designs may drastically increase the number of required hours, while large frame spacing may increase weight, but decreases necessary man-hours. This is often not reflected in such formulae!
- The approach is based on historical data, i.e. historical designs and historical production methods. In view of revolutionary changes in production technology over the last decade, the data and formulae may sometimes be 'prehistoric'. They do not consider the impacts of new approaches in structural design and production technology.
- The approaches were often based on inaccurate data even at the time they were derived. In the shipyards were traditionally poor sources of cost information. The data were frequently skewed reflecting pressures of the first-line managers and other factors.
- Not suitable for structure optimization as there is no link between the Cost and the Design Variables (scantlings).
We therefore choose a “bottom-up approach”. Indeed, the goal is to control the short-term cost and then to identify the main key factors of the cost. Subsequently, we generate the missing data to assess these factors starting from the matured elements available in basic design stage up to the final detailed engineering stage.
Our idea is, to build a methodology allowing the analytical cost assessment in the "detailed design" stage. The use of a cost module based on an analytical method is essential because the statistical analysis of the data appeared is questionable.
2.2 Hierarchical cost structure
The cost structure which was chosen is made up of five hierarchical levels as shown in Table 1. Several branches arise out of each node of the tree structure (Fig. 3) and they are themselves ramified. For example in the “prepremanufacturing” sector, we have several workshops; one of these workshops is entitled "PPR" and contains itself several cost stages, for example "Welding Robot". Finally, each stage consists of several cost operation such as "Flat Welding". At each cost operation corresponds several costs natures like welding, tracing, grinding, etc.
Fig.3: Tree structure of the cost
ÆCOST Æ SECTOR Æ PrePremanufacturing Æ WORKSHOP Æ PPR ÆSTAGE Æ Welding robot ÆOPERATION (NATURES) Æ Flat welding
Table 1 : List of components of the cost hierarchy
Level List of components
Sectors Assembly (block Æ ship), preAssembly (panel Æ block), premanufacturing (assembly Æ panel), prepremanufacturing (items Æ assembly), machining, forming, etc.
Workshops Dry Dock, Assembly Area, Panel Line, Plate Forming, Plate Machining, etc. Stages Automatic prepremanufacturing (standard elements/parts), flap stiffened plate
(called here “Sheet plate”), double bottom (fitting and welding of sub-elements), etc. Operations Junction of plates, fitting of the joints, tracing, oxycutting, fitting of the profile
members, welding of joints, continuous welding of members, etc.
Natures Sheet metal working, welding, tracing, grinding , straightening, modifications, handling, tools, etc.
2.3 Hierarchical ship structure
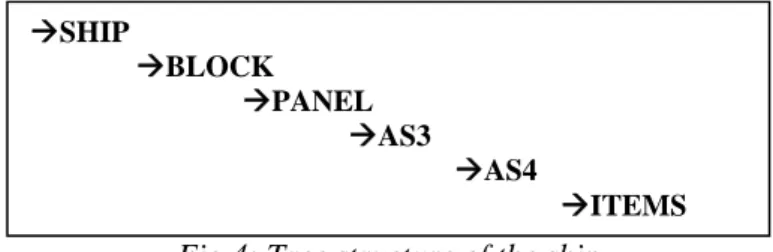
Fig. 4 shows the hierarchical structure of the ship. Each sub-assembly (entity) can be identified while clicking on one of the tree structure nodes.
Fig.4: Tree structure of the ship
2.4 Analytical form of the labour cost of an operation
Eq. (1) gives the expression of the labour cost for a cost operation:
Wc
Ac
S
Uc
Q
LabourCost
=
×
×
×
×
(1)LabourCost Labour cost of a given operation
Q Quantity relating to the operation. Example: length of the welding, number of plugs, etc.
Uc Unitary cost of the operation related to one or more design variables like (plate thickness, weld throat, weld type (butt or fillet), weld position, bevels, profile scantling, etc.).
For instance : Unitary Cost for flat fillet welding in the panel line workshop Weld Throat (mm) 3 3.5 4 4.5 5 Flat welding (hour/m) 1.3 1.4 1.5 1.7 1.9 Vertical welding (hour/m) 2.3 2.5 2.7 2.9 3.4
S Each cost nature has a splitting coefficient It is used:
• to be able to easily deactivate the calculation of a cost nature without erasing it. • to adjust the cost scale by raising it or by reducing it thanks to a constant percentage.
Ac Accessibility coefficient relating to the cost operation. This coefficient takes into account cost increases due to a accessibility for the welding of assemblies.
Wc Workshop coefficient relating to the operation..
ÆSHIP ÆBLOCK ÆPANEL ÆAS3 ÆAS4 ÆITEMS
3. Description of the cost assessment approach
The goal of this work is to establish a methodology and a tool to solve a very common problem in all shipyards: the cost assessment problem.
3.1 Description of the architecture
A first prototype tool has been developed in order to solve that problem. It contains a graphical encoding module (EncodeCost), a processing module (CostProcessing) and a graphical visualization module (ViewCost). Moreover, the data are stored in an Oracle Data Base (Cost DB).
3.1.1 Data flow for the software’s
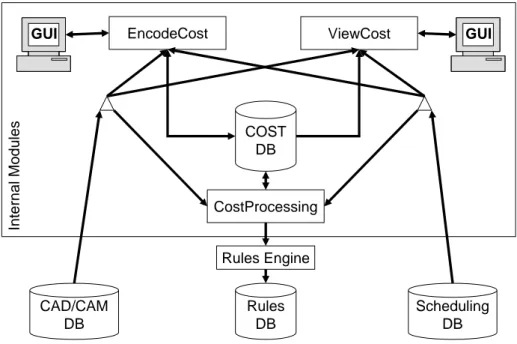
Fig. 5 represents the flows diagram of the developed software. The application will be articulated around three secondary sub-modules: EncodeCost, CostProcessing and ViewCost.
Fig.5: Data flow for software’s
3.1.2 Three different routines
The majority of the data which are necessary to the cost calculation are recorded in the relational CostDB data base. The Graphic User Interface EncodeCost, developed in java, is designed to introduce the data in a user friendly way. From there, we can reduce risks of encoding mistakes. On the one hand, the GUI proposes to the user to visualize the data stored in COSTDB data base and on the other hand it proposes to see a complete management tool. The GUI is reusable insofar as the graphic elements are built according to data's present in the tables of COSTDB. This method gives a great flexibility since a modification of the data base requires a small effort to update the software. The cost calculating unit CostProcessing is an independent module which consults the CAD/CAM DB and the scheduling DB. The CAD/CAM DB contains dimensional data (plate thickness, profile length, profile scantling, weld length, weld throat, etc), quantitative data (number of profile, number of holes, etc.) and finally the qualitative data (steel quality, surface quality, weld position, etc.). The scheduling DB contains various general data related to block splitting, dates, etc. And finally, the Rules DB contains some production rules peculiar to the shipyard. It carries out the requested calculation (according to the tree structure of the ship) and records this calculated cost in COST DB. This module will calculate the labour cost of the hull structure, see Eq. (1).
The display unit entitled ViewCost collect the data inserted in COST DB by the calculating unit. The sums of the elementary costs and the merging according to the user choices will be recomputed in real time during the interrogation of the data base.
COST DB ViewCost EncodeCost CostProcessing GUI GUI GUI GUI CAD/CAM DB Int e rnal Modu les Rules DB Rules Engine Scheduling DB
3.2 Three steps for cost assessment processing
3.2.1 Encoding and managing of persistent data (EncodeCost) We have several types of persistent data within the data base:
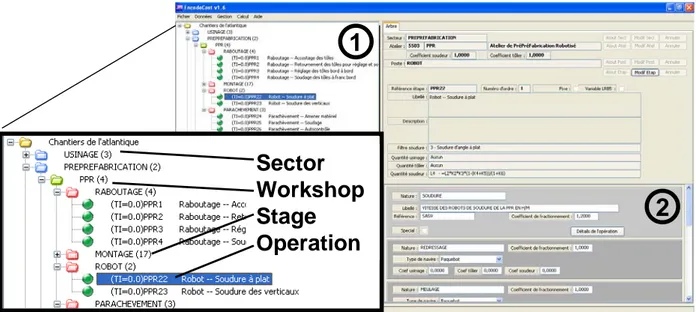
The data relating to the cost structure as defined above (see section 2.2) are organised in a hierarchical tree structure where each node will be ready to return a computation cost result. The example shown on Fig. 6 (1) gives the 4 levels which were defined, namely the SECTOR, the WORKSHOP, the STAGE and finally the elementary cost OPERATION. The fifth level related to cost natures is present on Fig. 6 (2). This tree structure is built in a dynamic way according to the data base that we have installed. It offers a great flexibility for the modification, for the addition and for the removal of the sectors, workshops, stages and operations. The aim of this process is to obtain an easy adaptation to each shipyard. The GUI will also propose a Drag&Drop management to move an operation within a stage, or possibly a workshop into another sector. The advantage of this method is that we are able to group the various data with a better flexibility.
Fig.6: Main frame of the EncodeCost Software (debug data)
3.2.2 Execution of the cost processing
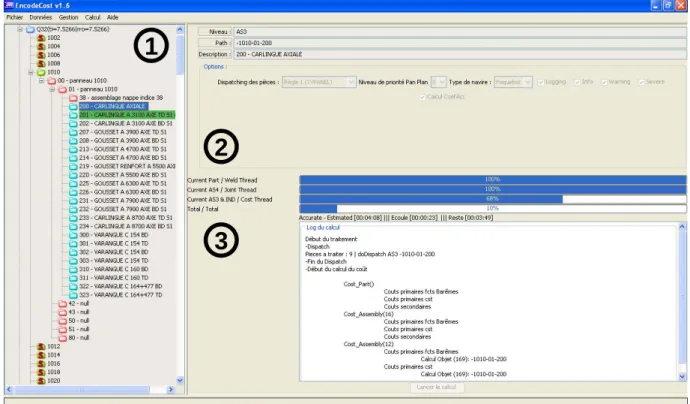
Fig. 7 is the window which gives access to the launching of the cost calculation. It is possible to select certain assemblies in the ship tree structure, Fig. 7 (1) and to modify certain process options, Fig. 7 (2). It is possible to launch calculation manually via this interface or in batch mode with a calculation server. During calculation the user can control the calculation progress by observing the log window, Fig. 7 (3).
3.2.3 Calculated costs visualization and quantities visualization (ViewCost)
The cost visualization application (ViewCost – see Fig. 8) is splitting in two great hierarchical structures. We will proceed to the display of the cost via a double tree diagram, the first one represents the ship hierarchy (1 – Fig. 8), the second one the cost structure (2 – Fig. 8). These two parts interact to show the data and the calculation results in a user friendly way. We note that Fig. 8 shows also the item list of given assembly (3).
Sector
Workshop
Stage
Operation
1
2
Fig. 8: Selection frame for cost calculation (debug data)
Fig.9: Main frame of the ViewCost software (debug data)
Nevertheless, the user will be able to choose two main options. The first (4) one permits to choose if the display of the cost takes into account the predicted efficiencies stocked in the data bases, in other words, if we display the indicated time (TI) or the predicted time (TP) (the difference between TI and TP is the workshop efficiency coefficient). The second option (4) simply permits to choose between displaying the sum of all the cost natures (by default) or displaying cost natures selected by the user. We will also note that it is possible to filter the data according the user selection (only one cost nature for example). We will be able to export results towards CSV files (5) to be read by Excel. Consequently our work focuses on the costs analysis and the productivity of the production system. In practice, after selection of a subset in the hierarchical ship structure (1 - Highlighted selection on Fig. 8), the user presses the button "refresh" and the cost structure calls the sums requests which show the cost according to the selected options.
1
2
3
1
2
3
4
5
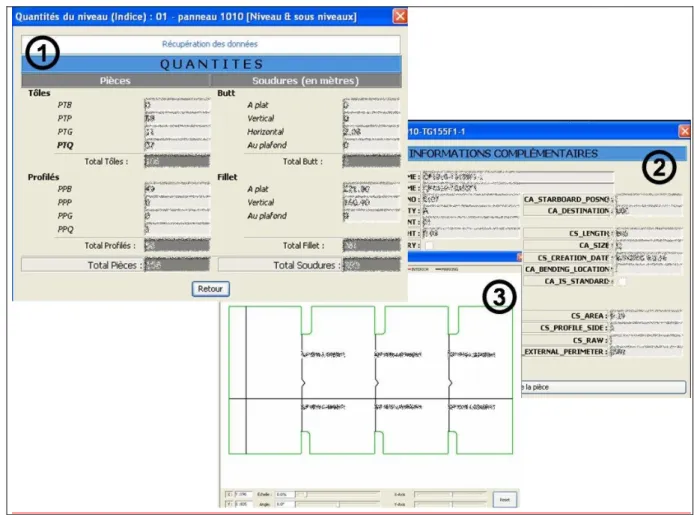
The cost tree structure (2 – Fig. 8) is shown with a percentage and a colour gradation so that it is very easy for the user to distinguish where the bigger costs are. We also show the absolute cost production in hour (TI or RRO). Thus, we can drive out the expensive designs and the lack of productivity. Thanks to the ship tree and with the data which can be consulted (quantities (1), characteristics of the sub-assemblies (2), parts outlines (3) – see Fig. 9) the user can more easily and more quickly identify which are the causes of an abnormal cost.
In addition to the cost shown in the vicinity of each node, at every click on a stage of the tree diagram, it will be possible to visualise which are the quantities used for the cost determination in this node. Two types of quantities will be described (1 – Fig. 9); the first relating to the number of entities classed by type (plates (PT) or profiles (PP)) and by size (Bucket, Small, Large). The second quantity corresponds to the measurement of welds classed by type (butt or fillet) and by the welding position (Flat, Horizontal, Overhead or Vertical).
A major innovation concerns the cost that can be calculated for any subassemblies of the ship, from the smallest up to the largest. We can thus compare the cost of the various assemblies’ of the ship. We can find new innovative designs which will reduce the cost production (design for production).
4. Conclusions and perspectives
The high complexity of the production of a ship, due to the interaction of a great number of different disciplines (hull construction, electricity, fluids, interior fitting, propulsion, etc) requires firstly an intensive design and secondly a detailed production planning where most of the tasks are carried out in parallel. In order to obtain the best quality, the lowest price and the shortest manufacturing lead time, it is necessary to increase the number of simultaneous tasks. So the management of the information flow becomes necessarily more and more complex, [10].
The current challenge for the European shipbuilding is to use these large and various information flows through the different stages: negotiation, design, production and maintenance, so that construction can be carried out with more effectiveness. In addition, it is expected that the design may be fully optimized for the production (design for production).
The objective of the presented method for short-term cost assessment is to increase the productivity: • The use of the design data and the cost model will lead to a more accurate approach compared to
the existing cost model;
• Improve the planning of the deadlines and establish the production schedule - at the detailed design stage;
• Improve the distribution of the workload between the various production workshops and assess the productivity - at the stage of design for production;
• Use the “design for production” concept by integrating the information about the cost production at each design stage;
• Analyzing the cost structure leads to a better knowledge of the most relevant and significant individual costs, on which the shipyard has to concentrate to reduce the global cost.
Today, the first prototype is tested at the ALSTOM shipbuilding (Chantiers de l’Atlantique) within the framework of the European project INTERSHIP which has partly inanced the study. Currently, the computing time can not be used in real time. But calculation can be made during the night and results are available at the following day.
4.1 Further improvements
It will be possible, while being based on the results of the analytical model, to build for the "basic design stage” a cost model based on default values possibly statistically based. Indeed, at this stage, the databases do not contain enough information. Then, for the later stages, when all the data are available, it is planned to reach a 100% rational cost assessment tool (Fig.2). It is thus planned to have a progressive and continuous feeding of the rational model.
Nevertheless, to lead at the "basic design" stage to a cost assessment model that already includes the design criteria and the production parameters, the pre-required data will be the development of a methodology to obtain all the information we do not have yet, like the sequence of the structural subassemblies, the cutting of the ship in blocks, etc.
In order to achieve this goal, we plan to apply Data Mining tools on the results from the analytical model. This means using analysis modules such as histograms, correlations analyse, dendrograms, decision trees, neurons networks, etc. These analyses will allow establishing a predictive mathematical relation of the cost at the "basic design" stage on the basis of most significant parameters of the ship by a neuronal network algorithm.
4.2 Industrial applications
Technologically and economically, the prospects for industrial applications of this research are based on the urgent need for some shipyards to develop for the European shipbuilding industry an integrated multi-objective tool for a high accuracy production cost assessment, which guarantees:
• a centralized management of the yard cost structure including the unitary costs of a whole shipyard;
• the simulation of updated production scenarios few weeks before the production;
• before investment, simulation and impact study of various improvements of the production facilities;
• “real time” advices for the designer based on production cost criterion (design for production); • a measurement of the production efficiency with respect to the predicted cost;
• a reliable assessment of the final total cost of the ship at a long-term stage. Acknowledgments
The authors thank University of Liege and “Chantiers de l’Atlantique”, ALSTOM Marine, Saint-Nazaire, France for the collaboration within sub-project II.1 of INTERSHIP.
References
[1] SASAKI, Y. (2003), Application of factory simulation to the shipyard, COMPIT’03, Hamburg, pp.362-376
[2] SHIN, J.G.; SOHN, S.J. (2000), Simulation-Based evaluation of productivity for the design of an
automated workshop in shipbuilding, J. Ship Production, pp.46-59
[3] BERTRAM,V.;CAPRACE, J.D.;RIGO,P.;MAISONNEUVE,J.J.(2005),Cost assessment in ship production, The Naval Architect, March, pp.6-8
[4] ROSS, J.M.; HAZEN, G.S. (2002), Forging a real-time link between initial ship design and
estimated costs,ICCAS
[5] ROSS, J.M. (2004), A practical approach for ship construction cost estimating, COMPIT’04, Siguenza, pp.98-110
[6] ROSS, J.M. (2005), Weight-based cost estimating during initial design, COMPIT’05, Hamburg, pp.221-229
[7] ENNIS, K.J.; DOUGHERTY, J.J.; LAMB, T.; GREENWELL, C.R.; ZIMMERMANN, R. (1998), Product-oriented design and construction cost model, J. Ship Production, pp.41-58 [8] BOCQUET, J.C. (1998), Ingénierie simultanée, conception intégrée, Conception de produits
mécaniques, Editions Hermes, pp.29-52
[9] SYAN, C.S.; MENNON, U. (1994), Concurrent engineering concepts, implementation and
practice, Chapman &Hall, London, UK
[10] HUGHES, O.F.;ET AL. (1994),Applied computer aided design, Report V.5 of Committee to