Difference P-value
Brown-Swiss 15.73 0.19
Dual Purpose Belgian Blue 11.67 0.26
Jersey 31.21 0.04
Montbeliarde 18.39 0.15
Non Holstein Red and White -20.11 0.09
Normande 14.4 0.13
Estimate SE Estimate SE Estimate SE Estimate SE
Milk (in kg/day) 18.8 2.2 30.6 0.7 8.1 1.9 42.3 0.2
Fat (%) 31.2 2.3 4.9 0.3 5.7 1.7 58.2 0.3 Protein (%) 28.2 2.5 11.6 0.4 9.3 1.9 50.8 0.3 PLTF (mg/l) 19.7 3.1 22.0 2.1 6.2 3.2 52.1 0.7 SCS 12.1 1.8 29.6 0.7 7.2 1.6 51.1 0.3 Genetic Trait
Within lactation Across lactations Residual Permanent environments
Variation of Lactoferrin Content Predicted by
Mid-Infrared Spectrometry (MIR)
H. Soyeurt
1,2, F. Colinet
3, V. Arnould
3, P. Dardenne
4, I. Misztal
5and N. Gengler
1,61 Gembloux Agricultural University, Animal Science Unit, Passage des Déportés 2, 5030 Gembloux, Belgium
2 F.R.I.A., Rue d’Egmont 5, 1000 Brussels, Belgium
3 Gembloux Agricultural University, Animal and Microbial Biology Unit, Avenue Maréchal Juin 6, 5030 Gembloux, Belgium
4 Walloon Agricultural Research Centre, Quality Department, Chaussée de Namur 24, 5030 Gembloux, Belgium
5 University of Georgia, Animal & Dairy Science Department, 425 River Road, 30605 Athens, USA
6 F.N.R.S., Rue d’Egmont 5, 1000 Brussels, Belgium
1. Aim and Objectives
Mastitis is the most frequent and costly disease in dairy cattle.
Advanced breeding tools require help to improve the mastitis resistance. Lactoferrin (LTF) could be an indicator trait for mastitis resistance.
Reference method (ELISA) is expensive and time consuming.
Î
New approach :
Used MIR
Spectrometry to predict the LTF content.
2. Material and methods
Calibration Equation
- 69 samples on a total of 1,609 milk samples taken between April 2005 and April 2006 analyzed by MilkoScan FT6000 and ELISA to measure LTF content (mg LTF/l of milk).
- Prediction equation by Partial Least Squares (RPD = 1,90).
Animal Population
- 7,690 samples in 25 herds and from 7 breeds were collected between April 2005 to May 2006.
Prediction of LTF (PLTF) by MIR Spectrometry
- Prediction equation applied to 7,690 spectra recorded between April 2005 to May 2006.
Quantitative Genetic Model
- Added 40,007 records on milk yields, %fat, %protein and somatic cell score (SCS).
- Multi-trait mixed model :
Fixed effects : herd*date of test*class of lactation
number; class of days in milk*class of lactation number; age*class of lactation number.
Random effects : residual effect, animal additive,
permanent environment within and across lactations.
4. Conclusion
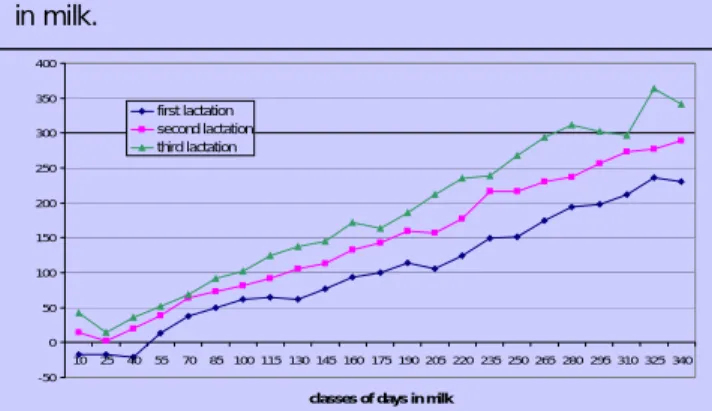
Stage and number of lactation influence PLTF content
in milk.
Figure 2 : Effect of the class of days in milk (represented by mid-point of the class) and the lactation number on PLTF content in bovine milk.
Heritability of PLTF close to 20 % : possibility to select
for increased LTF in milk.
Table 2 : Estimate of variances ratio (in % of phenotypic variance) and corresponding standard error (SE) for each random effects (genetic, 2 permanent environments, residual).
Close to zero genetic correlation between SCS and
PLTF indicates differences in metabolic processes for
these traits.
Positive phenotypic correlation between these same
traits (0.26) could suggest that the PLTF is also a
mastitis indicator.
Table 3 : Genetic (above the diagonal) and phenotypic (below the diagonal) correlations between milk yield, percentage of fat, protein content, PLTF and SCS.
-50 0 50 100 150 200 250 300 350 400 10 25 40 55 70 85 100 115 130 145 160 175 190 205 220 235 250 265 280 295 310 325 340
classes of days in milk
first lactation second lactation third lactation
Indirect selection for LTF is possible.
Next step :
Genomic selection
based on the PLTF
and solutions from the quantitative genetic models.
Gem
b
lo
ux
A
g
ric
u
lt
u
ral
Uni
v
ers
it
y
Session 10 – Abstract 1007 – Poster 82
3. Results and discussion
Table 1 : PLTF content in bovine milk for different breeds compared to Holstein breed.
Trait Milk Fat Protein PLTF SCS
Milk (kg/day) -0.33 -0.45 -0.36 -0.02
Fat (%) -0.18 0.6 0.33 0.06
Protein (%) -0.32 0.39 0.5 -0.08
PLTF (mg/l) -0.28 0.12 0.39 0.04