HAL Id: inria-00410216
https://hal.inria.fr/inria-00410216v2
Submitted on 24 Aug 2009
HAL is a multi-disciplinary open access
archive for the deposit and dissemination of
sci-entific research documents, whether they are
pub-lished or not. The documents may come from
teaching and research institutions in France or
abroad, or from public or private research centers.
L’archive ouverte pluridisciplinaire HAL, est
destinée au dépôt et à la diffusion de documents
scientifiques de niveau recherche, publiés ou non,
émanant des établissements d’enseignement et de
recherche français ou étrangers, des laboratoires
publics ou privés.
Monitoring the BlobSeer distributed data-management
platform using the MonALISA framework
Alexandra Carpen-Amarie, Jing Cai, Luc Bougé, Gabriel Antoniu, Alexandru
Costan
To cite this version:
Alexandra Carpen-Amarie, Jing Cai, Luc Bougé, Gabriel Antoniu, Alexandru Costan. Monitoring the
BlobSeer distributed data-management platform using the MonALISA framework. [Research Report]
RR-7018, INRIA. 2009, pp.15. �inria-00410216v2�
a p p o r t
d e r e c h e r c h e
ISSN 0249-6399 ISRN INRIA/RR--7018--FR+ENGINSTITUT NATIONAL DE RECHERCHE EN INFORMATIQUE ET EN AUTOMATIQUE
Monitoring the BlobSeer distributed
data-management platform using the MonALISA
framework
Alexandra Carpen-Amarie — Jing Cai — Luc Bougé —
Gabriel Antoniu — Alexandru Costan
N° 7018
Centre de recherche INRIA Rennes – Bretagne Atlantique IRISA, Campus universitaire de Beaulieu, 35042 Rennes Cedex
Téléphone : +33 2 99 84 71 00 — Télécopie : +33 2 99 84 71 71
Monitoring the BlobSeer distributed
data-management platform using the MonALISA
framework
Alexandra Carpen-Amarie
∗, Jing Cai
†, Luc Bougé
‡,
Gabriel Antoniu
∗, Alexandru Costan
§Thème : Calcul distribué et applications à très haute performance Équipe-Projet KerData
Rapport de recherche n° 7018 — Août 2009 — 15 pages
Abstract: Grid monitoring is an active research area, targeting both grid re-sources monitoring and application monitoring. Most monitoring systems aim at providing general information. However, distributed applications can ben-efit from a monitoring and visualization tool specifically tuned to their specific needs. This paper discusses the case of BlobSeer, a large-scale distributed stor-age system.
The work relies on the MonALISA framework to collect the general and specific monitoring data. In order to meet BlobSeer requirements, the visu-alization tool has to deal with its large-scale design, while still being able to deliver a detailed and meaningful image of the data stored.
Key-words: Distributed system, storage management, large-scale system, monitoring, visualization.
∗ INRIA, Centre Rennes - Bretagne Atlantique, IRISA, France, {Alexandra.Carpen-Amarie,
Gabriel.Antoniu}@inria.fr
† Department of Computer Science, City University of Hong Kong, [email protected].
edu.hk
‡ENS Cachan/Brittany, IRISA, Rennes, France, [email protected] §University Politehnica of Bucharest, [email protected]
Comment utiliser MonALISA pour surveiller la
plate-forme de gestion de données réparties
BlobSeer
Résumé :La surveillance des grilles est un domaine actif de la recherche, visant à la fois la surveillance des ressources et la surveillance des applications sur les grilles. La cible de la plupart des systèmes de surveillance est de produire des informations génériques. Toutefois, les applications réparties peuvent béné-ficier d’un outil de surveillance et visualisation adapté à leurs besoins par-ticuliers. Cet article étudie BlobSeer, un système de stockage réparti à large échelle.
Ce travail repose sur le système MonALISA pour collecter les données génériques et spécifiques. Afin de répondre aux défis de BlobSeer, l’outil de visualisation doit être capable de passer à l’échelle, tout en étant en mésure de fournir une image détaillée et significative des données stockées.
Mots-clés : Systèmes repartis, gestion des données, système à large échelle, surveillance, visualisation.
Monitoring BlobSeer using the MonALISA framework 3
1
Introduction
Data-intensive scientific applications need to manage huge amounts of data and to handle read and write accesses to them. In order to address this chal-lenge, several systems that deal with the management of large datasets have been designed. The distributed data storage systems need to cope with data striping across many storage providers and with the overhead of keeping track of the placement of the stored information. BlobSeer [5] is a system that deals with the storage of large, unstructured data and manages fine-grained read and write accesses to them under heavy concurrency.
Monitoring systems are designed to assist the users in overcoming the chal-lenges raised by the behavior of their distributed systems. Their goal is to pro-vide the users with the feedback necessary for identifying the state of their application and of the infrastructure where the application is running on, at a particular moment in time. Existing grid monitoring applications are mainly based on tools for monitoring the physical nodes and they mostly focus on the mechanisms of gathering and storing monitored data in a scalable and non-intrusive manner [11].
The various types of grid applications have different monitoring needs, ranging from knowing the state of the physical nodes where the application runs on, to the individual states of the jobs and the progress of file transfer operations. Even though many grid monitoring applications have been devel-oped to address general needs [9] [2], there is little work done when it comes to defining specific parameters for data storage applications. For instance, the distribution of the stored files over the nodes is a crucial parameter in this case. MonALISA [4] is the system selected in this paper to fulfill the monitor-ing tasks, as it is designed for large-scale environments and it enables the user to collect application-specific information. It also allows the user to define his own data aggregation rules and to visualize the monitored information using predefined or external graphical libraries.
This paper addresses the needs of a storage system from the point of view of a monitoring system. It discusses the useful data that should be collected by the monitoring tools in order to present the user with a a detailed and meaningful image of the storage system and of the data that it is storing. A key point is to identify the graphical representations that best suit this purpose. The paper also examines the monitoring challenges raised by a large-scale storage system, such as the large number of nodes, the fine-grained striping of the data over the storage nodes and the heavy concurrent access to data, as it is the case with BlobSeer. The MonALISA system is a monitoring framework able to meet these challenges and a visualization tool tuned for BlobSeer can rely on it for gathering the required monitoring information.
The remainder of the paper consists of the following sections. Section 2 provides a brief description of BlobSeer and Section 3 presents MonALISA, the monitoring system on which our visualization tool relies. Section 4 presents the specific parameters that can be useful in observing a storage system and reports on the obtained experimental results. It identifies the visual representations suited for BlobSeer that offer the user a detailed view of the system state and can scale with the huge amount of stored data. Section 5 draws conclusions and directions for future development.
4 Carpen-Amarie & Cai & Bougé & Antoniu & Costan
2
BlobSeer – a grid data-sharing service
2.1
Design
BlobSeer is a data-sharing system that manages the storage of large and un-structured data blocks called binary large objects, referred to asBLOBs further in this paper. The blobs are striped into small chunks that have the same size, called pages.
BlobSeer addresses the problem of efficiently storing massive BLOBs in large-scale distributed environments. It provides an efficient fine-grained ac-cess to the pages belonging to eachBLOB, as well as the possibility to modify them, in a distributed, multi-user environment.
One of the entities involved in the architecture of BlobSeer is the client, which initiates allBLOB operations: CREATE, READ, WRITE and APPEND. There can be many concurrent clients accessing the sameBLOB or different BLOBs in the same time. The support for concurrent operations is enhanced by storing the pages belonging to the sameBLOB on multiple storage providers. The system has to keep track of the pages distribution across providers. Therefore, it associates some metadata to eachBLOB. For each BLOB, the meta-data is organized as a distributed segment tree [12], where each node corresponds to a version and to a page range within that version. Each leaf covers just one page, recording the information about the data provider where the page is physically stored. The metadata trees are stored on the metadata providers, which are processes organized as a Distributed Hash Table.
BlobSeer provides versioning support, so as to prevent pages from being overwritten and to be able to handle highly concurrentWRITE and APPEND operations. For each of them, only a patch composed of the range of written pages is added to the system, and a new metadata tree is created. The new metadata tree corresponds to a new version and points to the newly added pages and to the pages from the previous versions that were not overlapped by the added page range.
The system comprises two more entities: the version manager that deals with the serialization of the concurrentWRITE/APPEND requests and with the as-signment of version numbers for each newWRITE/APPEND operation; the provider manager, the one that keeps track of all the storage providers in the system.
As far as this paper is concerned, anAPPEND operation is only a special case ofWRITE. Therefore, we disregard this aspect in the rest of the paper. Everything stated about WRITEs is also true for APPENDs, unless explicitly specified.
A typical setting of the BlobSeer system involves the deployment of a few hundreds of provider nodes, each of them storing data in the order of GB, and even tens of GB in the case of the use of the disk storage for each node. This implies that sizes within the order of TB can be easily reached for theBLOBs stored in the system. Furthermore, the typical size for a page within a blob can be smaller that 1 MB, whence the need to deal with hundreds of thousands of pages belonging to just oneBLOB.
Monitoring BlobSeer using the MonALISA framework 5
2.2
Specific monitoring issues
A monitoring tool designed to provide a visual representation of the BlobSeer system has to tackle several challenges. Firstly, it has to be able to monitor the physical resources for each storage provider, in order to detect overloaded providers. Secondly, it has to provide, in a comprehensible manner, not only a visual representation of theBLOB as a whole, but also of the pages that the BLOB is striped into and of the way the pages are stored on the providers.
An important feature of BlobSeer is the versioning support that enables the creation of a newBLOB version each time a WRITE operation is performed. Thus, the visualization tool has to keep track of the different versions belong-ing to aBLOB and to take them into account when providing a graphical rep-resentation of theBLOBs.
Another challenge for a visualization tool designed to run on top of a large-scale system is to deal with a large number of storage provider nodes and therefore with a huge number ofBLOB pages, versions and with huge BLOB sizes. To address this problem, the system has to switch between an exhaustive graphical representation of all the entities in the system and a more compact, partial representation. The latter has to be capable of displaying the trends in the evolution of the system or just the entities that are the most representative for it.
3
MonALISA
BlobSeer is a storage system that deals with massive data, which are striped into a huge number of pages scattered across numerous storage providers. A monitoring tool tuned for presenting the state of a system like BlobSeer has to cope with two major challenges. On one side, it has to accommodate the immense number of pages that the system comprises once it stores several BLOBs. On the other side, the monitoring system has to be able to deal with a huge amount of monitoring information generated when an application ac-cesses the nodes that make up the storage service. It is the case when multiple clients simultaneously access various parts of the storedBLOBs, as they gener-ate a piece of monitoring information for each page accessed on each provider. MonALISA is suitable for this task, as it is a system designed to run in grid environments and it proved to be a scalable and reliable system.
3.1
Architecture
The MonALISA (Monitoring Agents in a Large Integrated Services Architec-ture) [10] system is a JINI-based [8], scalable framework of distributed services, which provides the necessary tools for collecting and processing monitoring information.
Its architecture is based on four layers of services, as presented in Figure 1. It complies with the Grid Monitoring Architecture (GMA) [7] proposed by the Global Grid Forum (GGF) [1], which includes three components: consumers, producers and a directory service.
6 Carpen-Amarie & Cai & Bougé & Antoniu & Costan
Figure 1: The MonALISA architecture
The first layer corresponds to a network of Lookup Discovery Services that provide discovery and notification mechanisms for all the other services.
The second layer is composed of MonALISA services, the components that perform the data collection tasks. Each MonALISA service is part of a group and registers itself with a set of Lookup Services, together with several describ-ing attributes.
The interaction between clients and services is made available through transparent Proxy services, which represent the third layer in the MonALISA architecture. Every MonALISA service discovers the Proxy Services by using the discovery mechanism implemented into the Lookup Services layer, and permanently keeps a TCP connection with each of them.
The top-level layer is represented by the MonALISA clients, which offer an intuitive graphical interface of the states of the monitored systems. It allows users to subscribe to and to visualize global parameters gathered from multiple MonALISA services. It also provides detailed tracking of parameters for any individual MonALISA service or component in the entire system. The
Mon-ALISA repositoryis a "pseudo-client" for the MonALISA services, developed as a Web server. It is able to store the monitoring data and to present histori-cal and real-time values, statistics and graphihistori-cal charts for a specific group of MonALISA services. Each type of MonALISA client has to connect to the layer of Lookup services in order to request access to data gathered by one or more specified groups of MonALISA services. It is then transparently connected to the nearest and less loaded proxy service, which will forward the data that the client has subscribed to, from all the MonALISA services.
3.2
Customization
The MonALISA system is a well-suited choice for monitoring a distributed storage system, thanks to several features that it provides. First of all, it can monitor both a set of predefined parameters and various user-defined param-eters. This is due to an application instrumentation library, called ApMon, that enables any application to send monitoring information to one or more Mon-ALISA services.
Monitoring BlobSeer using the MonALISA framework 7
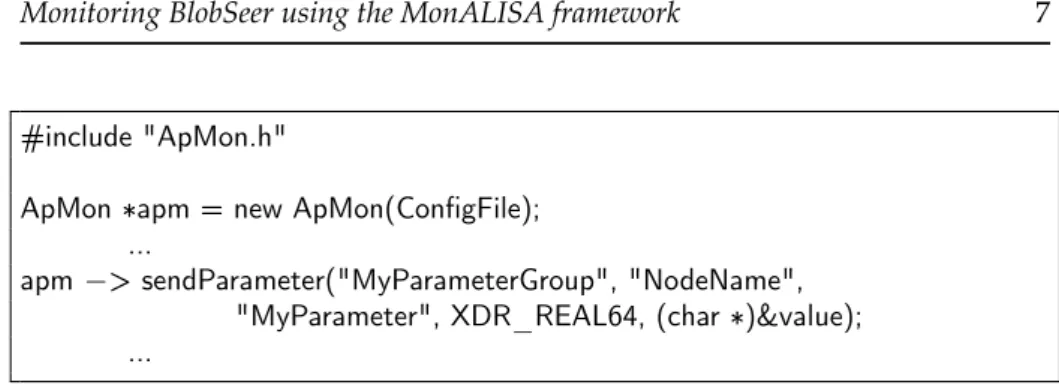
#include "ApMon.h"
ApMon ∗apm = new ApMon(ConfigFile); ...
apm−> sendParameter("MyParameterGroup", "NodeName",
"MyParameter", XDR_REAL64, (char ∗)&value); ...
Figure 2: Instrumenting a code with the ApMon Library.
BlobSeer is instrumented using the ApMon library, requiring each provider to report to the monitoring system each time a page is written or read, by send-ing a parameter and its value to a predefined MonALISA service, as described in Figure 2.
The version manager is monitored in the same way. An ApMon-based dae-mon parses its log file each time it is updated, in order to report the written page ranges and their associated versions. The state of the physical resources on each node is monitored through an ApMon thread that periodically sends the data to the monitoring service.
The MonALISA system also enables the user to create new data from the collected values, through the use of filters. In this way, new or aggregated val-ues can be dynamically created within independent threads while the MonAL-ISA service or repository receives the monitoring information. Since by default the repository can accommodate only time series in its database, all the spe-cific data monitored from BlobSeer go through a filter that stores them into the corresponding database tables.
Another element is essential for defining a visualization tool tuned for a particular storage system. It is the possibility of having customized graphi-cal charts, appropriate to the collected parameters. The MonALISA repository supports the integration of external graphical libraries, thus opening the way to the generation of any type of chart for any type of user-defined parameters.
4
Monitoring BlobSeer using the MonALISA
framework
This paper proposes a visualization tool designed to provide a comprehensive image of the BlobSeer system, able to extract useful information from the huge number of entities and monitoring parameters that account for a typical Blob-Seer instance. It relies on the MonALISA monitoring system to address the challenges raised by the data-gathering tasks. Our contribution lies in the fact that the proposed visualization tool can handle the huge bursts of monitoring data generated when countless pages are simultaneously read from or writ-ten into the storedBLOBs. It is designed to adapt to the various sizes of the datasets and to provide appropriate graphical representations for the different aspects of the system.
8 Carpen-Amarie & Cai & Bougé & Antoniu & Costan
4.1
Experimental plan
The visualization tool we developed has been evaluated on the Grid’5000 [3] [6] testbed, a large-scale experimental grid platform, with reconfiguration and control capabilities. The Grid’5000 platform covers 9 sites geographically dis-tributed in France, built as a network of dedicated clusters.
For the experiments, we used 127 nodes belonging to a single cluster in Rennes. The nodes are equipped with x86_64 CPUs and at least 4 GB of RAM. They are interconnected through a Gigabit Ethernet network.
We deployed each BlobSeer entity on a dedicated node, as follows: two nodes were used for the version manager and the provider manager, 10 nodes for the metadata providers, 100 nodes for the storage providers and 10 nodes acted as BlobSeer clients, writing data to the BlobSeer system. Four nodes hosted MonALISA services, which were responsible for gathering the moni-toring data for all the provider nodes. A MonALISA repository was deployed outside Grid’5000, as there are no direct connections between the MonALISA services and the repository. All the monitoring traffic goes from the monitored nodes to the MonALISA services. Each MonALISA service keeps permanent connections with the proxy services and it forwards the monitoring data that the repository has subscribed to through these connections.
The experiment assesses the conformity of the obtained charts with the real state of the system and the ability to produce scalable results regardless of the size of the stored data, of the number ofBLOB pages, or of the number of accesses.
In this experiment, we used 10BLOBs, each of them having the page size of 1 MB and a total size larger than 20 GB. We started the 10 clients, each of them being required to create aBLOB and to write 10 data blocks of 2 GB each on the createdBLOBs. Each data block overlaps the previous one by 10%. Next, we started the clients in parallel and each of them performed a number ofWRITE operations on a randomly selectedBLOB. The blocks were written on the BLOB at random offsets and they consisted of a random number of pages, ranging between 512 MB and 2 GB in size.
This experiment lasted for a dozen of minutes. All the figures below are real snapshots of the final state of this experiment.
4.2
General resource monitoring
Every grid monitoring tool is able to collect resource information. A monitor-ing system tuned for BlobSeer has to tackle this task as well, so as to be able to characterize the overall usage of the resources involved in the system. The physical resources that need to be monitored include regular monitoring pa-rameters like computing cycles, CPU usage, network traffic, disk usage, stor-age space or memory.
The most important resources for a storage system are the storage space and the memory. A visualization tool has to provide information about both the state of the entire system and the distribution of the storage capabilities across the providers which this system consists of. For each provider, the in-formation that has to be collected is represented by the used/available memory and used/available storage space.
Monitoring BlobSeer using the MonALISA framework 9
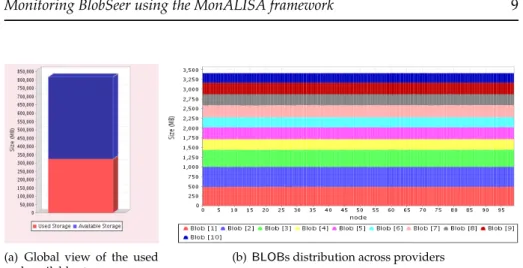
(a) Global view of the used and available storage space
(b) BLOBs distribution across providers
Figure 3: Storage space monitoring
The visualization system has to be able to adapt the granularity of the sys-tem views to the needs of the client, thus proposing two different approaches that deal with the representation of the storage space or the memory. The graphical representations that follow only refer to the storage space, as the ones related to the memory are similar.
The global view It depicts the current values of the available and used stor-age space for the entire system. These values represent the sum of all the most recent free and used space amounts reported by the storage providers, merged in an intuitive view (Figure 3(a)).
This is a real-time measure of the system load. In the future BlobSeer re-leases, it will be a crucial information to modify the number of running stor-age providers dynamically, as the available storstor-age space decreases. In our experiment, the chart in Figure 3(a) reveals the fact that the system was not overloaded, thus indicating a stable and safe state of the system.
The detailed view If the global view of the storage space reflects the system load, the detailed view informs the user of the occupied and available space at each storage provider.
Each provider reports the value of the used storage space each time new data are written to it, enabling the monitoring tool to keep track of the states of all the entities that make up the storage system. The visual representations of these collected data can vary from displaying the values of the used and free storage space across the providers, to the list of the most loaded providers in the system.
Note that both these approaches scale well with the number of providers. In the first case, the used storage space can be displayed as a set of averaged values for the adjoining providers, instead of individual values for each of them. In the case of the list of overloaded providers, the number of displayed providers can be selected by the user, so as to highlight the providers that re-quire the system to trigger an action meant to decrease their load.
10 Carpen-Amarie & Cai & Bougé & Antoniu & Costan
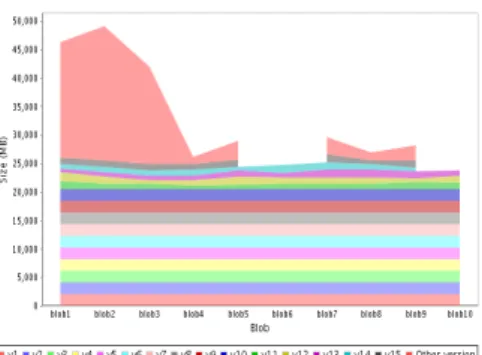
(a) Comparison between BLOB versions and sizes
(b) BLOB versions and sizes for a large number of BLOBs
Figure 4:BLOB versions and sizes
4.3
Global BlobSeer monitoring
In order to have an overview of all the data currently stored in the BlobSeer system, theBLOBs and their configuration can be presented from several dif-ferent points of view.
The distribution of the BLOBs across providers The visualization system has to offer a complete image of the storage system and of the way the data is stored. It has to be able to handle TB-sizedBLOBs scattered on hundreds of storage providers.
This general image exposes the total sizes of the storedBLOBs, as well as the the way they are stored on the providers, providing the user with a comprehen-sive understanding of how the system manages the stored data (Figure 3(b)). The chart draws attention to the variations of the loads across providers and it can scale with respect to the number of providers or to theBLOB size. In case the number ofBLOBs is too large and the chart cannot accommodate it, or the load variations are experienced only between a fewBLOBs, the user can have a closer look to a specified range ofBLOBs, by selecting an interval of BLOBs to be shown and group all the others in a single representation of their total size. The chart in Figure 3(b) reveals the balanced storage-space usage among the providers deployed in our experiment. This behavior is a consequence of the fact that they are allocated in a round-robin manner and that our experimental environment, Grid’5000, provides a low latency network between all the used nodes.
However, the displayed information is a deciding factor in dynamically adapting the provider allocation policy, when the monitoring system reveals high variations between the loads reported by the providers. On the other hand, the chart provides a means to visually compare the sizes of the different BLOBs in the system, on the same chart that exposes the total size of the stored data. In this case, due to the well-balanced providers, the total size can be eas-ily interpreted as being the number of providers, 100, multiplied by the size stored by each provider, which is about 3 GB.
Monitoring BlobSeer using the MonALISA framework 11
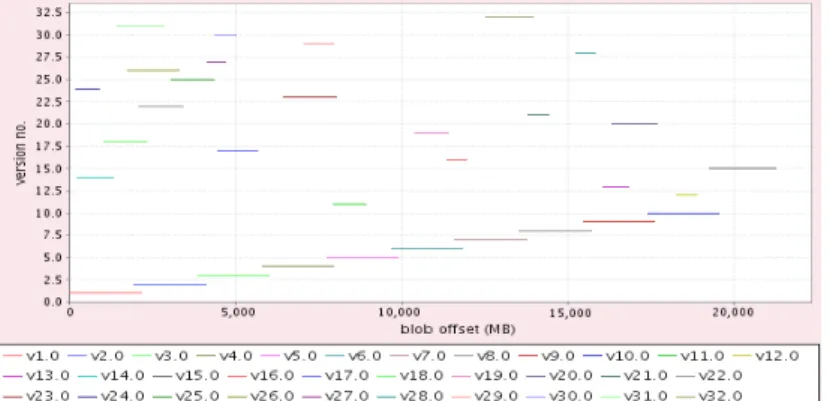
Figure 5: The structure of aBLOB
The structure of all the stored BLOBs They are depicted in Figure 4(a), where the user can compare the sizes of the versions within aBLOB and the sizes of the ones corresponding to differentBLOBs. The size of the versions is given in the total size of the pages that compose the versions. For the first ver-sion the size is the whole size of the written data. For the next verver-sions, the size is just the size of the pages added or modified when the version was created, so the user can also compare the storage space occupied by variousBLOBs.
This representation of the whole system can only cope with a limited num-ber ofBLOBs and BLOB versions. When the number of BLOBs grows over a fixed value, the user can no longer see the details associated with eachBLOB. In this case, the chart automatically switches to a more compact representation that does not expose all the details, but instead it allows the user to detect the trends of theBLOBs’ structure across the system, as presented in Figure 4(b). If some of the versions have particularly small sizes that cannot be visually dis-tinguished, their sizes are summed up and represented as another series that contains them all (the Other versions series in Figure 4(b)).
Figure 4(a) confirms the creation of the first equally-sized 10 versions for each BLOB, as we stated in the description of the experiment. This chart is updated in a real-time manner, after eachWRITE operation ends. It is a useful tool that shows the dynamic growth of theBLOBs and an intuitive image of their sizes and, furthermore, of the distribution of the size among versions.
This chart can be correlated with one that emphasizes the number of write operations performed on eachBLOB, which is equivalent with the number of versions. It exposes theBLOBs that have a high rate of change or growth, as opposed to theBLOBs that contain data that is seldom modified.
4.4
Individual BLOB monitoring
4.4.1 The structure of a BLOBThe structure of aBLOB, i.e., the page ranges occupied by each version, can be a convenient information for the client. Figure 5 displays all the versions for a specifiedBLOB as lines covering a range of pages. This chart can accommodate a large number of versions, thus being suitable for describingBLOBs that are
12 Carpen-Amarie & Cai & Bougé & Antoniu & Costan
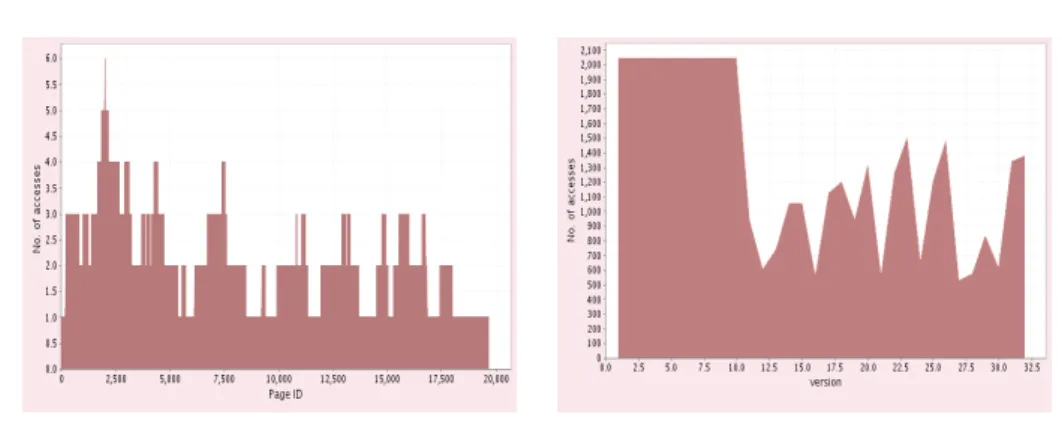
(a) Number of write accesses on the logical ad-dress pages for a BLOB
(b) Version access patterns
Figure 6:BLOB accesses visualization
subject to many WRITE operations. It scales to any number of BLOB pages stored in the system, as the versions are depicted as ranges and, consequently, the chart scales well even for theBLOBs that are composed of a huge number of pages.
Figure 5 corresponds to the third BLOB, one of the largest BLOBs in our experiment (as shown in Figure 4). The figure emphasizes the placement of the versions within aBLOB. For instance, the structure of the BLOB after the first series of 10WRITE operations reveals the first 10 versions, each of them having a size of 2 GB and overlapping the previous one by 10%.
The information provided by this chart allows the user to verify that the WRITE operations he initiated generated new versions in the requested posi-tions within the BLOB. The chart is also a visual depiction of the ranges of pages that are overlapped by newer versions and that are no longer needed for the accesses to recent versions.
4.4.2 Read/Write accesses monitoring
The number of times a provider,BLOB, version, or page were accessed is a significant parameter that the monitoring system has to be aware of. It is the criterion used to find access patterns for the data stored and, together with the information about the memory and the CPU load, the number of accesses can be a valuable input for a provider allocation algorithm.
The visualization of the read/write accesses It is represented by a chart that illustrates the access patterns for aBLOB, as displayed in Figure 6(a). The chart is drawn either starting from the number of read accesses for each page that theBLOB version consists of, or starting from the number of write op-erations performed on theBLOB for each page. Since each WRITE or READ operation consists in accessing a range of consecutive pages, it is expected that some ranges of pages will have the same number of accesses, thus revealing an access pattern through this visual representation. The chart can aggregate data comprising a huge number ofBLOB pages, enabling the user to identify
Monitoring BlobSeer using the MonALISA framework 13
the regions of theBLOB composed of pages with the same number of accesses in a scalable way.
The distribution of the read/write accesses across the BLOB versions Blob-Seer provides a versioning system that creates a new version for aBLOB ev-ery time a write operation is performed on thatBLOB. The versions can be weighted by counting the number of read accesses or of physical memory pages for each of them, as shown in Figure 6(b). This chart can accommodate a huge number of versions associated with a massiveBLOB, by displaying only a set of averaged values between the consecutive versions, when their total number is too large to be shown on a single chart. It depicts the tendencies of theREAD operations over the versions or the various sizes of the WRITE op-erations, as the number of write accesses for a specified version is equivalent with the number of pages written.
5
Conclusion
This paper addressed the challenges that have to be tackled by a visualization tool that aims to provide an extensive and intuitive image of a large-scale stor-age system that deals with TB-sized data, such as BlobSeer. The goals of the paper were to select a set of specific monitoring data that can be collected from BlobSeer and to map the stored data onto a graphical representation that can scale with the huge number ofBLOBs and pages stored. It has to be both an easily understandable and an in-depth depiction of the state and the structure of the system. This paper presented an experiment that shows the advantages of having a monitoring system tuned for BlobSeer. Even though it did not deal with the huge amounts of data that are typical for BlobSeer, we argue that it demonstrates the scalability of the monitoring approach.
The massive number of monitoring parameters generated for each page written imposed the use of multiple MonALISA services that share the load of collecting the data from the providers, whereas the initial experimental plan required just the use of a single MonALISA service. We decided to use an on-line processing of the monitoring data, so as to provide an almost real-time image of the system, by correlating the high-level data operations with the numerous low-level page storage ones.
The gathered data can be the starting point towards an online interactive or self-steering mechanism for BlobSeer. The collected data facilitate the design of a provider allocation mechanism that takes into account the various attributes of the storage providers, such as their load, the number of accesses performed on them or the number of pages orBLOBs they store. The number of deployed providers can also be automatically managed, due to the monitoring informa-tion that draws atteninforma-tion to the percentage of overloaded providers, the global load of the system or to the number of providers under heavy concurrent ac-cesses. Another BlobSeer feature that can benefit from the monitoring infor-mation is the replication strategy, as the replication factor of oneBLOB or page can be modified according to the previously collected data that emphasize the number of read accesses or the load of the system.
14 Carpen-Amarie & Cai & Bougé & Antoniu & Costan
Acknowledgments
The authors thank Bogdan Nicolae for his crucial technical support regarding BlobSeer.
The experiments reported in this paper were carried out using the Grid 5000 experimental testbed, an initiative from the French Ministry of Research through the ACI GRID incentive action, INRIA, CNRS and RENATER and other contributing partners (seehttp://www.grid5000.fr/).
References
[1] Global Grid Forum. http://www.ggf.org/.
[2] Dan Gunter, Brian Tierney, Brian Crowley, Mason Holding, and Jason Lee. Netlogger: A toolkit for distributed system performance analysis. Model-ing, Analysis, and Simulation of Computer Systems, International Symposium on, 0:267, 2000.
[3] Yvon Jégou, Stephane Lantéri, Julien Leduc, Melab Noredine, Guillaume Mornet, Raymond Namyst, Pascale Primet, Benjamin Quetier, Olivier Richard, El-Ghazali Talbi, and Touche Iréa. Grid’5000: a large scale and highly reconfigurable experimental grid testbed. International Journal of High Performance Computing Applications, 20(4):481–494, November 2006. [4] I. Legrand, H. Newman, R. Voicu, C. Cristoiu, C. Grigoras, M. Toarta,
and C. Dobre. MonALISA: An agent based, dynamic service system to monitor, control and optimize grid based applications. In Computing for High Energy Physics, Interlaken, Switzerland, 2004.
[5] Bogdan Nicolae, Gabriel Antoniu, and Luc Bougé. BlobSeer: How to en-able efficient versioning for large object storage under heavy access con-currency. In Data Management in Peer-to-Peer Systems, St-Petersburg, Rus-sian Federation, 2009.
[6] The Grid’5000 Project.http://www.grid5000.org/.
[7] B. Tierney, R. Aydt, D. Gunter, W. Smith, V. Taylor, R. Wolski, and M. Swany. A grid monitoring architecture. Grid Working Draft GWD-PERF-16-3, August 2002.http://www.gridforum.org/.
[8] Jim Waldo. The Jini architecture for network-centric computing. Commu-nications of the ACM, 42(7):76–82, 1999.
[9] The Ganglia Website.http://www.ganglia.info/. [10] The MonALISA Website.http://monalisa.cern.ch/.
[11] Serafeim Zanikolas and Rizos Sakellariou. A taxonomy of grid monitoring systems. Future Gener. Comput. Syst., 21(1):163–188, 2005.
Monitoring BlobSeer using the MonALISA framework 15
[12] Changxi Zheng, Guobin Shen, Shipeng Li, and Scott Shenker. Distributed segment tree: Support of range query and cover query over DHT. In 5th Intl. Workshop on Peer-to-Peer Systems (IPTPS-2006), Santa Barbara, USA, February 2006. Electronic proceedings.
Centre de recherche INRIA Rennes – Bretagne Atlantique IRISA, Campus universitaire de Beaulieu - 35042 Rennes Cedex (France)
Centre de recherche INRIA Bordeaux – Sud Ouest : Domaine Universitaire - 351, cours de la Libération - 33405 Talence Cedex Centre de recherche INRIA Grenoble – Rhône-Alpes : 655, avenue de l’Europe - 38334 Montbonnot Saint-Ismier Centre de recherche INRIA Lille – Nord Europe : Parc Scientifique de la Haute Borne - 40, avenue Halley - 59650 Villeneuve d’Ascq
Centre de recherche INRIA Nancy – Grand Est : LORIA, Technopôle de Nancy-Brabois - Campus scientifique 615, rue du Jardin Botanique - BP 101 - 54602 Villers-lès-Nancy Cedex
Centre de recherche INRIA Paris – Rocquencourt : Domaine de Voluceau - Rocquencourt - BP 105 - 78153 Le Chesnay Cedex Centre de recherche INRIA Saclay – Île-de-France : Parc Orsay Université - ZAC des Vignes : 4, rue Jacques Monod - 91893 Orsay Cedex
Centre de recherche INRIA Sophia Antipolis – Méditerranée : 2004, route des Lucioles - BP 93 - 06902 Sophia Antipolis Cedex
Éditeur
INRIA - Domaine de Voluceau - Rocquencourt, BP 105 - 78153 Le Chesnay Cedex (France)
http://www.inria.fr ISSN 0249-6399