HAL Id: hal-02345635
https://hal.archives-ouvertes.fr/hal-02345635
Submitted on 4 Nov 2019
HAL is a multi-disciplinary open access
archive for the deposit and dissemination of
sci-entific research documents, whether they are
pub-lished or not. The documents may come from
teaching and research institutions in France or
abroad, or from public or private research centers.
L’archive ouverte pluridisciplinaire HAL, est
destinée au dépôt et à la diffusion de documents
scientifiques de niveau recherche, publiés ou non,
émanant des établissements d’enseignement et de
recherche français ou étrangers, des laboratoires
publics ou privés.
Temporal characterization of an urban horizontal
atmospheric telecom channel
Chloé Sauvage, Clélia Robert, Béatrice Sorrente, Didier Erasme
To cite this version:
Chloé Sauvage, Clélia Robert, Béatrice Sorrente, Didier Erasme. Temporal characterization of an
urban horizontal atmospheric telecom channel. OSA Imaging and Applied Optics Congress, Jun
2019, MUNICH, Germany. pp.PW4C.5, �10.1364/PCAOP.2019.PW4C.5�. �hal-02345635�
Temporal characterization of an urban
horizontal atmospheric telecom channel
Chlo´e Sauvage1,2, Cl´elia Robert1, B´eatrice Sorrente1, Didier Erasme2
1DOTA, ONERA, Universit´e Paris Saclay, F-92320 Chatillon - France 2LTCI, T´el´ecom ParisTech, Universit´e Paris-Saclay, F-75013 Paris - France
chloe.sauvage@onera.fr
Abstract: Free Space Optics (FSO) are breakable under some climatic conditions. How-ever characterization of the propagation channel by studying wavelength transmisttance and data coming from a wavefront experiment could improve FSO’s performance. © 2019 The Author(s)
OCIS codes: 010.7350, 060.2605, 290.5930.
1. Introduction
Many applications are opening to the FSO, therefore this technology is booming because it holds many advantages, like a faster deployment than fiber optics or a lack of spectrum regulation unlike radio frequencies [1]. However the atmosperic telecom channel suffers from weather (fog, haze, rain) and physical phenomena like turbulence and scattering effects (Rayleigh and Mie [2]), which damage the optical link and reduce the communication’s performances [3].
2. Atmospheric transmittance depending on wavelength
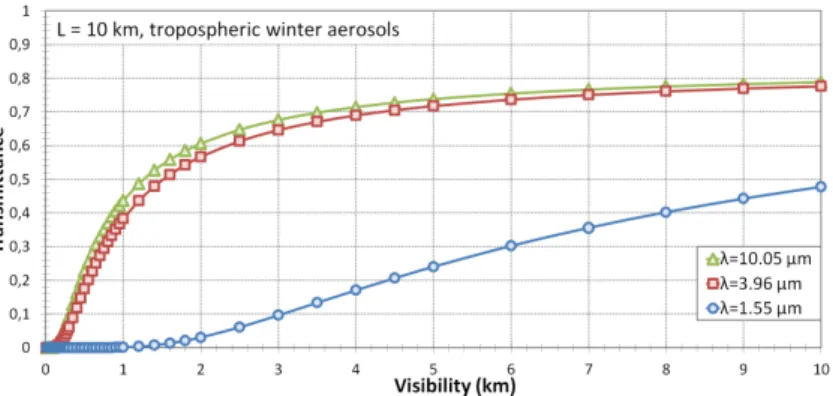
Laser beam transmission through the atmopshere depends on several parameters such as weather, aerosols compo-sition or wavelength. Environmental parameters cannot be controlled but the wavelength can be selected in order to optimize the photometric budget. Thank to a radiative transfer software (MATISSE [4]), three wavelengths of the infrared atmospherical window are compared (1.55 µm, 3.96 µm and 10.05 µm) with a focus on low visibility situations. Figure1shows the transmittance as fonction of visibility for a 10 km-long horizontal path. For low visibilities, transmisttance at 3.96 µm and 10.05 µm is better than 1.55 µm. For instance, transmitance through a 200 m-visibility atmosphre (thick fog) is null for 1.55 µm but at 3.96 µm and 10.05 µm the transmission ratio are -17 dB and -15 dB, respectively. Although transmitance is better at 10.05 µm than at 3.96 µm, the availability, the cost and the user-friendlyness of components are more interesting at 3.96 µm.
Fig. 1. Transmittance as a function of visibility for three wavelengths.
3. Description of the SCINDAR experiment and its available database
The SCINDAR (SCINtillation Detection And Ranging) experiment uses an infrared Shack-Hartmann analyser (λ = 3.4 to 4.2 µm) which aims at two halogen lamps 1 m-apart and that are located at 4.2 km of the receiver. On average the horizontal line of sight is about 40 m above ground [5]. A 5×5 array of sub-apertures, 20 of which are effectively operative, samples the wavefront. Thus 2×20 = 40 channels, collected by the 20 sub-apertures imaging the 2 sources, are characterizated in form of temporal intensity series. Concretely the SCINDAR experiment gathers intensity, phase and Cn2profiles series in a big data base for several weather conditions.
4. Coherence time and fading duration
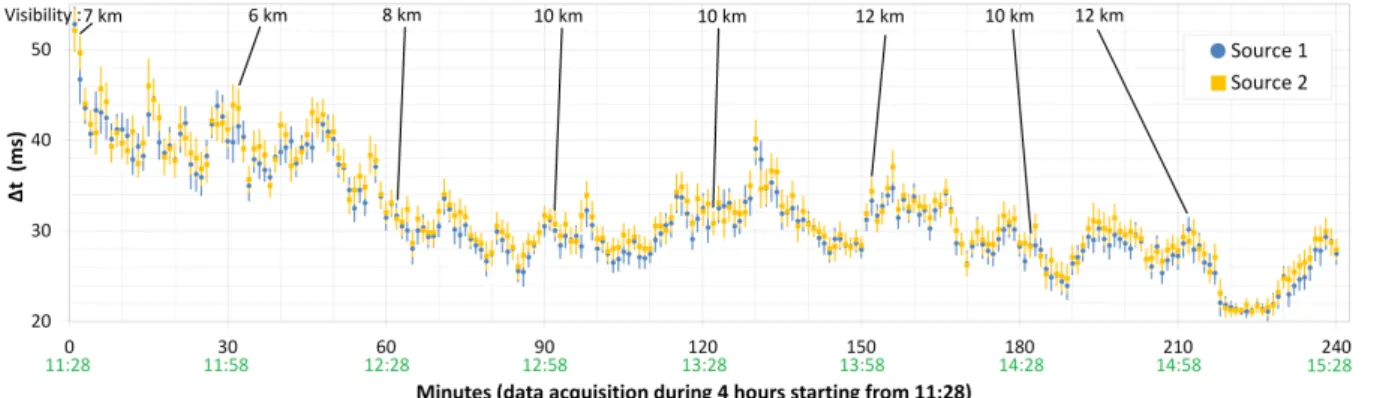
Two time slots that had been recorded during a past SCINDAR experiment are analysed here. The first one corre-sponds to a 4 hour recording done in the October 19, 2015, when the sky was overcast and the visibilities ranging between 6 km and 12 km. During this period the wind was low, 2.5 m/s in average, and perpendicular to the line of sight. The second period was recorded on the October 30, 2015, during 5 hours, there were sunny spells, better visibities, from 16 km to 40 km and the wind speed was 3.1 m/s in average, and parallel to the sight line. Then the temporal intensity series are used for computing the intensity sub-channel’s coherence time (∆t), i.e. the full width at half maximum of the normalised autocorelation of intensity. For each source, we compute the mean of ∆t and its standard deviation for the 20 sub-apertures. For the first period, shown on figure2, the computed ∆t varies between 20 ms and 55 ms, and for the second period it varies between 30 ms to 65 ms. The values obtained reveal a coherence time for an horizontal propagation channel slower than in astronomy, a typical value of which is 5 ms and that is derived from an analytical formula using a “one layer” equivalent turbulence profile [6].
Fig. 2. Temporal evolution of coherence time (∆t) for each source with its standard deviation.
With the same temporal series, a statistical study of fading duration is performed. By fixing the threshold at 5% of the maximun we compute the cumulative density fonction (CDF) of the fadings. We derive a mean fade time of 24 ms and of 38 ms respectively for the first and the second period. As expected, these values are ranging in the interval of the coherence time. Notice that [7] simulated median fading durations in an adaptive optics GEO scenario showing comparable values. So our data base could be usefull to predict horizontal FSO performance, by using our experimental CDF of fadings, which is necessary to design a time interleaver coupled with error correcting codes.
5. Conclusion and perspectives
This study shows the good transmittance of 3.96 µm communication channel for a 10 km range even in the case of low visibility just below 1 km. The richness of our data base comes from its capability of considering various weather conditions such as rain or strong turbulence. It allows us to link the FSO performance to some temporal characteristics of the propagation channel (as coherence time and CDF of fadings). The next step requires to focus on a physical explanation of the difference of order of magnitude between the coherence time for horizontal and slant path despite comparable fading values. Some specificities of such urban horizontal propapation channel could be involved : we need first to revist the analytical formula of the coherence time applied to near ground turbulence profiles (Cn2and wind), second, envisage a possible interaction between dust and turbulence.
References
1. Khalighi, M. A. and Uysal, M.,“Survey on Free Space Optical Communication: A Communication Theory Perspective,” IEEE Communications Surveys Tutorials,vol. 16, no. 4, pp. 22312258, 2014.
2. J. M. Wallace et P. V. Hobbs,“Atmospheric Science - An Introductory Survey”, Elsevier, 2006.
3. M. A. Esmail, H. Fathallah, and M. S. Alouini, “Outdoor FSO Communications Under Fog : Attenuation Modeling and Performance Evaluation”, IEEE Photonics Journal, vol. 8, no. 4, pp. 122, Aug. 2016. 4. ONERA, “MATISSE v2.1, ”https://matisse.onera.fr/.
5. K.-L. Nguyen, C. Robert, et al, “Measurement of the spatial distribution of atmospheric turbulence with SCINDAR on a mosaic of urban surfaces,” vol. 10425. SPIE - Remote Sensing Warsaw, 2017, p. 104250L. 6. B. Garcia-Lorenzo, et al,“ Adaptive Optics Parameters connection to wind speed at the Teide Observatory”,
Monthly Notices of the Royal Astronomical Society, vol. 397, no. 3, pp. 16331646, Aug. 2009.
7. L. Canuet, et al,“Statistical properties of single-mode fiber coupling of satellite-to-ground laser links par-tially corrected by adaptive optics”, JOSA A, vol.35, no.1, p.148, Jan. 2018