HAL Id: hal-01280238
https://hal.inria.fr/hal-01280238
Submitted on 1 Mar 2016
HAL is a multi-disciplinary open access
archive for the deposit and dissemination of
sci-entific research documents, whether they are
pub-lished or not. The documents may come from
teaching and research institutions in France or
abroad, or from public or private research centers.
L’archive ouverte pluridisciplinaire HAL, est
destinée au dépôt et à la diffusion de documents
scientifiques de niveau recherche, publiés ou non,
émanant des établissements d’enseignement et de
recherche français ou étrangers, des laboratoires
publics ou privés.
Yvan Le Bras, Olivier Collin, Cyril Monjeaud, Vincent Lacroix, Eric Rivals,
Claire Lemaitre, Vincent Miele, Gustavo Sacomoto, Camille Marchet, Bastien
Cazaux, et al.
To cite this version:
Yvan Le Bras, Olivier Collin, Cyril Monjeaud, Vincent Lacroix, Eric Rivals, et al.. Colib’read on
galaxy: a tools suite dedicated to biological information extraction from raw NGS reads. GigaScience,
BioMed Central, 2016, 5 (1), �10.1186/s13742-015-0105-2�. �hal-01280238�
T E C H N I C A L N O T E
Open Access
Colib’read on galaxy: a tools suite dedicated
to biological information extraction from raw
NGS reads
Yvan Le Bras
1*, Olivier Collin
1, Cyril Monjeaud
1, Vincent Lacroix
2, Éric Rivals
3, Claire Lemaitre
4,
Vincent Miele
2, Gustavo Sacomoto
2, Camille Marchet
2, Bastien Cazaux
3, Amal Zine El Aabidine
3,
Leena Salmela
5, Susete Alves-Carvalho
4, Alexan Andrieux
4, Raluca Uricaru
6,7and Pierre Peterlongo
4Abstract
Background: With next-generation sequencing (NGS) technologies, the life sciences face a deluge of raw data.
Classical analysis processes for such data often begin with an assembly step, needing large amounts of computing resources, and potentially removing or modifying parts of the biological information contained in the data. Our approach proposes to focus directly on biological questions, by considering raw unassembled NGS data, through a suite of six command-line tools.
Findings: Dedicated to ‘whole-genome assembly-free’ treatments, the Colib’read tools suite uses optimized
algorithms for various analyses of NGS datasets, such as variant calling or read set comparisons. Based on the use of a de Bruijn graph and bloom filter, such analyses can be performed in a few hours, using small amounts of memory. Applications using real data demonstrate the good accuracy of these tools compared to classical approaches. To facilitate data analysis and tools dissemination, we developed Galaxy tools and tool shed repositories.
Conclusions: With the Colib’read Galaxy tools suite, we enable a broad range of life scientists to analyze raw NGS
data. More importantly, our approach allows the maximum biological information to be retained in the data, and uses a very low memory footprint.
Keywords: NGS, Metagenomics, RNA-seq, Variant calling, Whole-genome assembly-less treatment, De Bruijn graph,
Bloom filter, long read correction
Findings Background
For some years now, owing to the impact of high-throughput sequencing, also known as next-generation sequencing (NGS), genomics is witnessing profound changes. NGS technologies generate huge volumes of data, up to terabyte scale, and new types of raw and pro-cessed data. Usually, a generic assembly (preprocessing) is first applied to the raw sequences, and then, in a sec-ond step, the information of interest is extracted. This protocol may lead to a significant loss of information, or
*Correspondence: yvan.le_bras@irisa.fr
1GenOuest Core Facility, UMR6074 IRISA CNRS/INRIA/Université de Rennes 1, Campus de Beaulieu, 35042, Rennes Cedex, France
Full list of author information is available at the end of the article
may generate chimerical results because of the heuris-tics used in the assembly. To circumvent this problem, we developed a set of innovative methods for extract-ing information of biological interest directly from NGS data, which allows the user to bypass a costly and often inaccurate assembly phase. Notably, the approaches devel-oped do not require the availability of a reference genome. This considerably broadens the spectrum of applications. In this paper we present our approach, which relies on a tools suite born from the Colib’read [1] project and is dedicated to whole-genome assembly-free treatments. A set of six tools based on this framework, KISSPLICE
[2], MAPSEMBLER2 [3],DISCOSNP[4], TAKEABREAK[5], COMMET [6], and LORDEC [7], are described below. To facilitate the use and the dissemination of our approach, we have developed Galaxy [8–11] tools and created
© 2016 Le Bras et al. Open Access This article is distributed under the terms of the Creative Commons Attribution 4.0 International License (http://creativecommons.org/licenses/by/4.0/), which permits unrestricted use, distribution, and reproduction in any medium, provided you give appropriate credit to the original author(s) and the source, provide a link to the Creative Commons license, and indicate if changes were made. The Creative Commons Public Domain Dedication waiver (http://creativecommons.org/publicdomain/zero/1.0/) applies to the data made available in this article, unless otherwise stated.
repositories on GUGGO Tool Shed [12, 13]. We first highlight the fundamental computational concepts shared by the tools, and this is followed by the algorithmic developments and tool descriptions. Next, several appli-cations using biological data are described and the Galaxy integration and dissemination processes are then detailed. Finally, the Galaxy integration and processes are described.
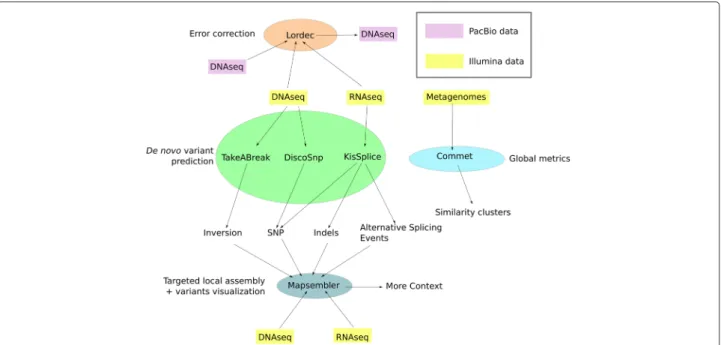
Overview
The common denominator of all the tools presented is the fact that they are all dedicated to the analysis of NGS datasets without the need for any reference genome. An overview of these six tools is presented graphically in Fig. 1. Table 1 summarizes the inputs and outputs of each tool. In short, KISSPLICE,DISCOSNP, and TAKEABREAK
perform de novo variant identification and quantification. For these tools the general approach is: 1) define a model for the elements sought; 2) detect in one or several NGS datasets those elements that fit the model; 3) output these together with a score and their genomic neighborhood. MAPSEMBLER2 generates a targeted assembly surround-ing sequences of interest provided by the user. MAPSEM
-BLER2 can provide the assembly as a graph and proposes a tool for visualizing it.
LORDEC uses short reads for correcting
third-generation long reads, and finally COMMET (COmpare Multiple METagenomes) is dedicated to the comparison of numerous metagenomic read sets. Special care was given to limit both the memory and time requirements of all tools. Thus, five of the six tools are based on the
usage of a compact representation of a de Bruijn graph, as explained in the next section.
Note that all the algorithms presented here were devel-oped bearing in mind the need for simple and user-friendly tools. They can be applied on raw sequenced short reads, without requiring any pretreatment. How-ever, if users are aware of bias such as contaminants or systematic sequencing errors, they can be used on prepro-cessed datasets and this can give better results.
A common kernel: the de Bruijn graph
From a computational viewpoint, with the exception of COMMET(which has no need of such a graph, and only uses a bloom filter), all the algorithms presented are based on the use of a de Bruijn graph (dBG). A dBG is a directed graph whose vertices are the k-long words contained in the reads, i.e. k-mers, and whose arcs represent all k-1 overlaps between these k-mers (vertices). See Figs. 2 and 3 for examples of dBGs.
Through the last decade, dBGs have been used exten-sively in the short read assembly framework. Indeed, the construction of such graphs is fast as it avoids any alignment computation, and it is memory efficient, as it compresses the read redundancy. In addition, since every nucleotide is explicitly present in this structure, sequence variants correspond to recognizable patterns. Therefore dBGs are well tailored for developing methods for detect-ing sequence polymorphism. DISCOSNPdetects patterns generated by single-nucleotide polymorphisms (SNPs); KISSPLICE deals with RNA-seq data and finds patterns
generated by SNPs, indels, and alternative splicing (AS)
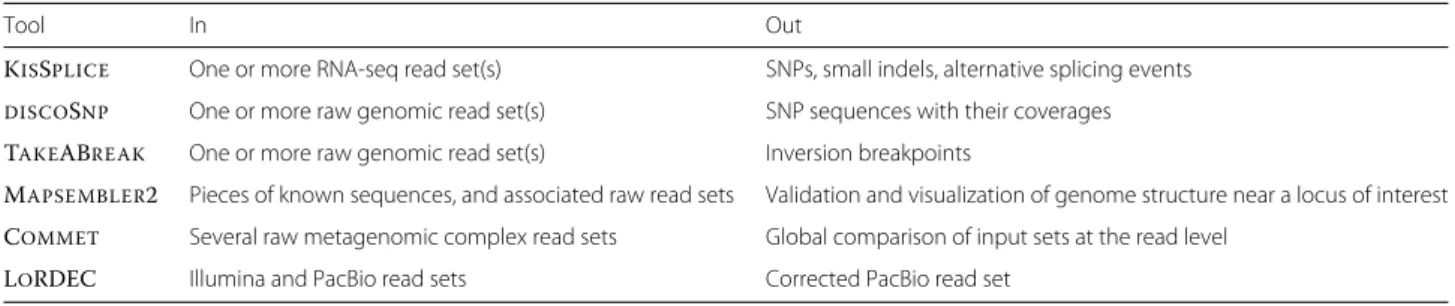
Table 1 Summary of the Colib’read tools inputs and outputs
Tool In Out
KISSPLICE One or more RNA-seq read set(s) SNPs, small indels, alternative splicing events DISCOSNP One or more raw genomic read set(s) SNP sequences with their coverages TAKEABREAK One or more raw genomic read set(s) Inversion breakpoints
MAPSEMBLER2 Pieces of known sequences, and associated raw read sets Validation and visualization of genome structure near a locus of interest COMMET Several raw metagenomic complex read sets Global comparison of input sets at the read level
LORDEC Illumina and PacBio read sets Corrected PacBio read set
events; and TAKEABREAKdetects patterns generated by inversions.
MAPSEMBLER2 and LORDEC are also based on a dBG, respectively for building a targeted assembly and as a reference for correcting third-generation long reads.
With the exception of KISSPLICEand COMMET, all the algorithms presented are based on an efficient represen-tation of the de Bruijn graph with optimized bloom filters, implemented in the GATB C++ library [14], as used for the first time in theMINIA[15, 16] assembler.
A bloom filter is a probabilistic data structure that stores the presence/absence of items. It consists of a simple bit vector, initially all set to ‘0’. Any item is associated with a set of a few addresses in this vector (typically seven addresses). While adding an item, the corresponding bits are set to ‘1’. Note that a bit may be set to ‘1’ from several distinct items. While querying an item, if all its bits are equal to ‘1’ then the item is considered as indexed in the bloom filter. Conversely, if any of its bits are equal to ‘0’, the item is absent from the indexed data. The main advan-tage of the bloom filter is its simplicity and its low memory footprint. Its main disadvantage is that it is probabilistic: if the bloom filter answers ‘yes’ while querying the presence of an item, this answer may be wrong (with a controlled percentage).
Thus, the bloom filter representation has the main advantage of a very low memory footprint. For instance, nearly 3 billion reads (100 bp) were analyzed by DISCO -SNP, using at most 5.7 GB of memory. Moreover, the
low memory footprint does not imply a degradation in the running time. The COMMET tool, being a heuris-tic based only on a bloom filter, is also fast and has an extremely low memory footprint. Unfortunately
the GATB [14] data structure does not yet allow the assignment of additional information to dBG nodes. In the KISSPLICE case, as presented in more detail in the following section, the nodes of the graph need to be tagged, thus requiring the use of an explicit dBG representation. Even if this representation is more resource intensive, it scales up perfectly in RNA-seq data problems.
Description of tools
DISCOSNP
DISCOSNP [4] is a reference-free SNP calling program that focuses on the detection of both heterozygous and homozygous isolated SNPs, from any number of sequenc-ing datasets.
TheDISCOSNPmethod rests on the following
observa-tion: in the dBG, a SNP generates a pair of paths composed of k vertices, which represent 2k-1 length sequences that are polymorphic on one position. This corresponds to a so-called bubble in the dBG, as depicted in Fig. 2. The model formalism can be found in [4].
DISCOSNP is composed of two modules: KISSNP2, fol-lowed by KISSREADS. The tool takes as input any number (potentially one) of read sets, i.e. samples. It processes all read sets together (creating the dBG and detecting the SNP-specific motifs) and outputs all isolated SNPs (for a given k) shared by any number of samples. The KISSNP2 output is a multi-FASTA file in which every consecutive pair of sequences corresponds to the two paths of a SNP (2k-1 sequences) together with their left and right con-tigs, which are reconstructed with the MINIA assembler
[15]. The KISSREADSmodule maps back input reads on
the sequences of the predicted SNPs in order to validate
Fig. 2 Toy example of a ‘bubble’ in the de Bruijn graph (k= 4). The bubble is generated by an SNP present in two polymorphic sequences,
Fig. 3 de Bruijn graph with k= 3 for the sequences:ACTGGAGCG(awb) andACTGCG(ab). The pattern in the sequence generates an(s, t)-bubble, fromCTGtoGCG. In this case, b=GCGand w= GGA have their first letterGin common, so the path corresponding to the junction ab has
k− 1 − 1 = 1 vertex
them and to provide per allele coverage and per read set information. The coverage is then used to compute a phi score, i.e. a normalized chi-squared statistic varying between 0 and 1, which ranks best those SNPs that are dis-criminant between the samples. Finally, SNPs are sorted according to the phi score.
DISCOSNP outperforms, mostly in terms of time and memory resources, state-of-the-art de novo or reference-based SNP discovery methods [4]. Indeed, DISCOSNP
scales remarkably well on big data studies as illustrated in Table 2.
KISSPLICE
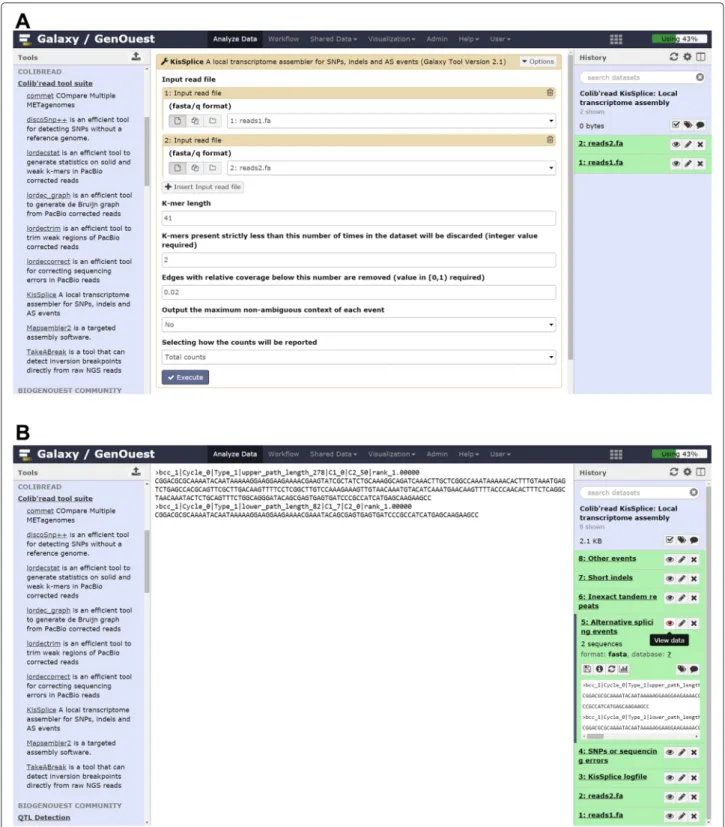
KISSPLICE[2] (Fig. 4) is a program that enables the
anal-ysis of RNA-seq data with or without a reference genome or transcriptome. It is an exact local transcriptome assem-bler that allows identification of SNPs, indels, and AS events. The software can deal with an arbitrary num-ber of biological factors, and it is able to quantify each variant in each condition. KISSPLICEhas been tested on Illumina datasets of up to 1 billion reads. The mem-ory consumption is around 5 Gb for 100 million reads. The local aspect of KISSPLICE allows it to scale better to larger datasets than traditional global assemblers, for example Trinity [17]. However, it does not reconstruct full-length transcripts, but only the variable regions. For instance, in an exon skipping event only the sequence of the skipped exon (plus some fixed-length context) is computed.
Variations in a transcriptome (including AS events) correspond to recognizable patterns in the dBG [2],
known as ‘bubbles’ as briefly described in theDISCOSNP
section above.
An example of such a bubble is given in Fig. 3.
The KISSPLICEprogram is composed of four steps: (i) de Bruijn graph construction, (ii) biconnected components decomposition, (iii) bubble enumeration, and (iv) event classification and quantification. In the first step, common to other Colib’read tools, the dBG is built from the set of reads using the GATB structure.
The second step in KISSPLICEdecomposes the dBG into biconnected components (see [2] for formal definitions). This step requires marking the nodes and cannot be per-formed with the current version of the GATB structure, explaining why an explicit representation of the dBG is required. This decomposition has the advantage of not splitting the searched motifs while offering the possibility of performing the motif search in each component inde-pendently, and possibly in parallel. With RNA-seq data, this lossless graph decomposition is very efficient for split-ting the dBG. For DNA-seq data, this decomposition is not efficient as most of the graph is made of a single biconnected component.
The third step, bubble enumeration, is the core of the KISSPLICE program. In this step the goal is to find all motifs (bubbles) satisfying the model constraints. This step is implemented using the enumeration algorithm given in [18].
Finally, in the fourth step each bubble is classified into four categories (indels, SNPs, AS events, and repeats) and quantified in each condition, independently. The quan-tification is done with KISSREADS, where we obtain the
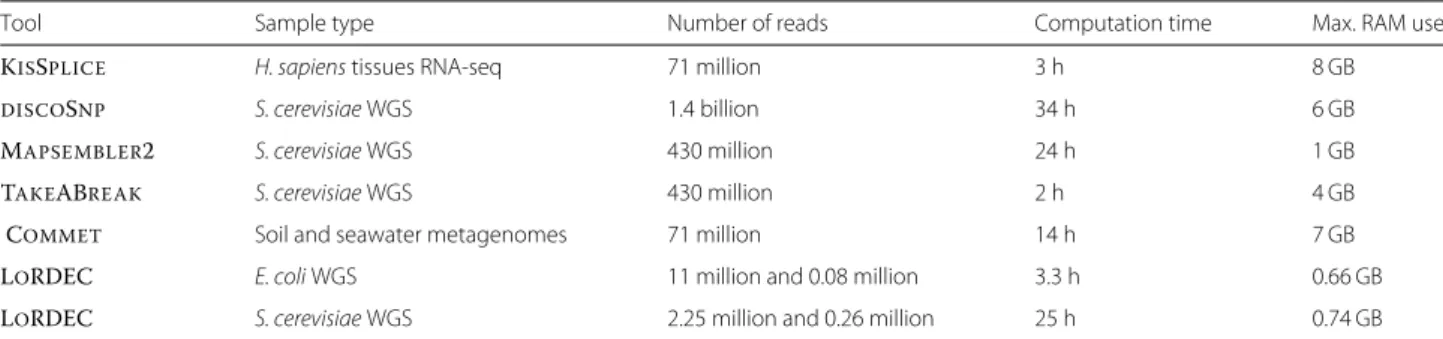
Table 2 Time and memory consumption examples
Tool Sample type Number of reads Computation time Max. RAM use
KISSPLICE H. sapiens tissues RNA-seq 71 million 3 h 8 GB
DISCOSNP S. cerevisiae WGS 1.4 billion 34 h 6 GB
MAPSEMBLER2 S. cerevisiae WGS 430 million 24 h 1 GB
TAKEABREAK S. cerevisiae WGS 430 million 2 h 4 GB
COMMET Soil and seawater metagenomes 71 million 14 h 7 GB
LORDEC E. coli WGS 11 million and 0.08 million 3.3 h 0.66 GB
Fig. 4 Running KisSplice on Galaxy. a KisSplice tool form allowing selection of input datasets and tool parameters. b KisSplice outputs
number of reads for each condition mapping to each variant. The final result, i.e. for each event the sequence of the variable part plus some sequence context and the quantification, is then output in a FASTA format.
TAKEABREAK
TAKEABREAK[5] is a method of detecting inversion vari-ants from one or several sets of reads without any refer-ence genome. The rationale behind it is similar to that of
DISCOSNP: inversion variants generate particular topolog-ical motifs in the dBG.
Inversion variants are defined as follows: a sequence I is said to be an inversion variant between two genomes if we can find the sequence aIb in one genome and aI’b in the other, with a and b being two k-mers and I’ being the reverse complement of I. We define the k-mers u and v as the first and last k-mers of I respectively. The occurrence in the data of the four breakpoint sequences au, vb, av’, and u’b (each of size 2k) generate a particular motif in the dBG that we call the inversion pattern. This motif is com-posed of two k-forks (a k-fork can be defined by two paths of size k joined at one extremity by a common branching node) joining together in a pseudo-cycle the four k-mers a, u, v, and b. An efficient algorithm was implemented in the software TAKEABREAKto find such inversion break-points in the dBG while avoiding numerous false positives due to repeated sequences. The implementation has very limited memory impact and runtimes (Illumina reads sim-ulated at 2× 40x coverage from human chromosome 22 can be treated in less than 10 min, with less than 1 GB of memory).
MAPSEMBLER2
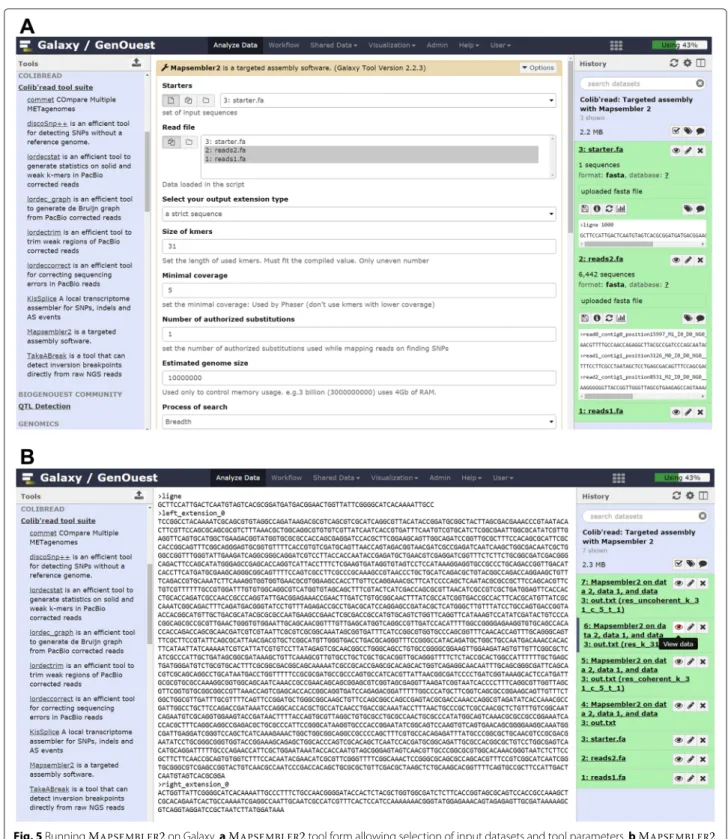
MAPSEMBLER2 [3] is a targeted assembly program. It takes as input one or more set(s) of NGS raw reads (FASTA or FASTQ, gzipped or not) and a set of input sequences, called the ‘starters’. All the input read sets are used together to assemble the neighbors of each of the starters provided. These neighbors are output either as simple sequences (a sequence is cut as soon as two choices occur during the assembly) or as a graph in which polymorphisms are shown.
MAPSEMBLER2 may be used, for instance, for under-standing the third-party assembly failures or chimeric assemblies, or for validating and visualizing the presence or absence of assumed polymorphism near one or several sequence(s) of interest (Fig. 5).
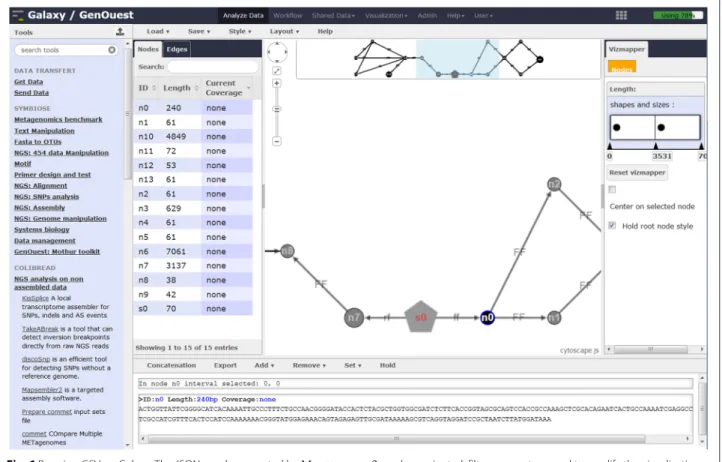
A special tool, called the ‘Graph of Sequence Viewer’ (GSV), was developed for visualizing and manipulating
the graphs produced by MAPSEMBLER2, as shown in
Fig. 6. Such graphs are in JSON format.
The visualization framework was designed to facili-tate the interpretation of MAPSEMBLER2 outputs.
Cur-rently, this visualizer is compatible only with JSON format MAPSEMBLER2 outputs and with any dBG graph respect-ing the specific JSON characteristics. Further work will make GSV compatible with semantic web or systems biol-ogy tools to visualize, for example, RDF files or biological networks.
COMMET
COMMET [6] provides a global similarity overview between all datasets of a large metagenomic project.
Directly from non-assembled reads, all-against-all com-parisons are performed through an efficient indexing strategy. The results are stored as bit vectors, i.e. a com-pressed representation of read files, which can be used to further combine read subsets by common logical opera-tions. Finally, COMMETcomputes a clusterization of the metagenomic datasets, which is visualized through den-drograms and heatmaps.
LORDEC
LORDEC [7] is a tool to correct sequencing errors in long reads obtained from third-generation high-throughput sequencing technologies [7]. Third-generation sequenc-ing machines, especially PacBio, offer the advantage of delivering much longer reads than previous technologies (up to 20 Kb), often at the expense of sequence preci-sion. Current estimates show that sequencing errors in PacBio reads average around 15 %, while traditional Illu-mina short reads exhibit an average error rate around 1 %. Moreover, PacBio sequencing suffers from a major-ity of insertion/deletion errors. It is thus necessary to correct these long reads before analysis, or at least dur-ing assembly, and different solutions have been proposed [19–22], but these approaches “require high computa-tional resources and long running times on a supercom-puter even for bacterial genome datasets”. [22].
In summary, LORDEC adopts a hybrid approach that takes advantage of the low error rate of short reads to correct the long ones. To avoid the computational bottleneck of all-against-all alignments, LORDEC builds
the dBG of the short reads, and aligns long reads to the paths of the dBG. LORDEC exploits the fact that the dBG summarizes in a single structure the layout of short reads along the target DNA/RNA sequence. Hence, aligning a long read to the dBG allows the correction of erroneous sequence positions much more efficiently, and in a scalable manner. The dBG implementation of GATB allows LORDEC to process huge short reads libraries and to scale up to vertebrate or plant genome cases.
The LORDEC software offers several programs: the main one for correcting the long reads, and others for trimming and splitting corrected reads into corrected regions if needed. The output distinguishes these with lower vs upper cases. The value of k can be optimized by trying different values as low as possible around log4(genome-length) (see [23] for an explanation).
Note that unlike the other tools, LORDEC addresses sequencing errors (which can be seen as technical arti-facts) rather than biological events (such as variants, AS, etc.). Hence, LORDEC fulfills a need for preprocessing the read data before further analyses can extract biological information from it, as illustrated by the application to genome assembly described below.
Fig. 5 Running MAPSEMBLER2 on Galaxy. a MAPSEMBLER2 tool form allowing selection of input datasets and tool parameters. b MAPSEMBLER2 FASTA output
Applications
Table 2 presents several time and memory footprint results, showing how the tools presented scale up on large raw datasets.
De novo identification of alternative splicing events in human RNA-seq data with KISSPLICE
KISSPLICEwas applied to a human dataset that consists of 32 million reads from human brain and 39 million reads
Fig. 6 Running GSV on Galaxy. The JSON graph generated by MAPSEMBLER2 can be navigated, filter parameters used to modify the visualization aspect, and results exported
from liver from the Illumina Body Map 2.0 Project (down-loaded from the Sequence Read Archive, study acces-sion number ERP000546, brain read accesacces-sion numbers ERR030882 and ERR030890, liver read accession numbers
ERR030887 and ERR030895). Even though KISSPLICE
does not require a reference genome, we applied it to a case where an annotated reference genome is indeed avail-able in order to be avail-able to assess whether our predictions are correct.
KISSPLICEran in three hours using less than 8 GB RAM and was able to identify 2,336 bubbles corresponding to AS events.
To assess whether these predictions were correct, we aligned both paths of each bubble to the human refer-ence genome (version hg19) using STAR [24] with default parameters.
We found that for 132 bubbles (5.7 %), the two paths did not map to the same genomic location, suggesting that the bubbles were false positives. A manual inspection of these cases revealed that most of them were due to repeats.
Among the bubbles where both paths mapped to the same location, we found that 1,714 (81 %) corresponded to annotated AS events, according to Ensembl v75 annota-tion [25]. In contrast, 398 (19 %) corresponded to putative
novel AS events, with at least one splice site not annotated before. Out of those 398 cases, 78 % (vs 97 % of them for the annotated splice sites) were canonical (GT-AG), and 22 % were non-canonical. An issue common to all tran-scriptome assemblers is that genomic indels, when located in transcribed regions, can be confused with AS events since they also generate bubbles in the dBG. In the pres-ence of a referpres-ence genome, we can tell them apart easily as one path will map in two blocks and the other in one block. Using this criterion, we found that half of the non-canonical novel AS events were indeed indels (49 %). The remaining 51 % were composed of GC-AG, novel splice sites, and some mapping or assembly errors.
To summarize, we find that out of 2,336 bubbles reported by KISSPLICE, 76 % are AS events annotated in
Ensembl, 14 % are AS events, not annotated but canoni-cal, 2 % are AS events, not annotated and not canonicanoni-cal, 2 % are genomic indels, and 5 % are repeat-associated false positives.
Furthermore, we reported in [2] that KISSPLICE is more sensitive than Trinity, a widely used full-length tran-scriptome assembler, for calling AS events. The recent developments [18] in KISSPLICEshow a particular sensi-tivity enhancement compared to Trinity in the case where
there is still some pre-mRNA in the sample to be ana-lyzed. The presence of pre-mRNA can in practice vary from 5 – 15 % depending on the protocol to isolate mRNA (total RNA vs nuclear, polyA+ vs polyA-). This can have a large impact on the assembly since introns are usually repeat-rich and the repeats are currently poorly handled by transcriptome assemblers.
AssessingDISCOSNPrecall on real read sets from Saccharomyces cerevisiae
DISCOSNP was applied to a set of biologically validated SNPs predicted from an artificial evolution study on S. cerevisiae [26]. Twenty-four read sets (correspond-ing to three populations) were downloaded from the NCBI Sequence Read Archive (with the accession num-ber SRA054922) and processed to remove barcode and adapter sequences as in the initial study. DISCOSNP was run independently on the three populations studied. For each population,DISCOSNPwas applied to the eight read sets corresponding to eight time points, with the default parameters and c = 11. In this framework, DISCOSNP
recall could be evaluated on real read datasets. As shown Table 3, among the 29 reference-validated isolated SNPs, 27 were predicted byDISCOSNP, thus giving an estimated recall of 93.1 %. Overall, this experiment demonstrates the good performance ofDISCOSNPat discovering SNPs from pooled samples, even those with low allelic frequencies: most of the reference SNPs were reported in the initial study with a minor allele frequency (MAF) lower than 20 %. Note that no SNP with a MAF lower than 10 % was experimentally validated, so we could not assess the recall on these very low frequency SNPs.
Targeted assembly of S. cerevisiae using MAPSEMBLER2
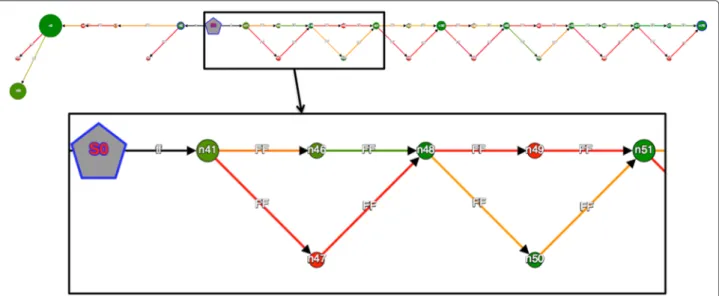
MAPSEMBLER2 was applied to the S. cerevisiae dataset previously described in theDISCOSNPsection. Biological validation of several identified SNPs is presented in a recent study [26]. As a starter, we selected a sequence fragment of length 63 bp, occurring at posi-tion 1,014,600 on chromosome 4. This starter, GGGG TTTTTCAACTGAATGTTCTTCAATAAAGCCTTTTT CAGAAGCGATTTTGTTTCTGTGCT, occurs near a set of SNPs validated in the [26] study. The graph pro-duced (Fig. 7) enables the retrieval of these validated SNPs, and also allows a check of the coverages of their two alleles in each of the 16 input read sets. Additionally, this graph also enables the detection of three SNPs and an indel that were not detected in the mapping pipeline used in [26].
Metagenomics global similarity overview of five gut metagenomes with COMMET
The MetaSoil study focuses on untreated soils of the Park Grass Experiment, Rothamsted Research, Hertfordshire,
Table 3 Isolated SNPs found in S. cerevisiae and validated in [26]
First population studied (5 found among 6)
Chromosome Position Ref Alt Predicted byDISCOSNP
1 39425 A G Yes 3 235882 C A Yes 4 1014740 G C Yes 6 71386 G C Yes 12 200286 C T Yes 15 438512 A C No
Second population studied (9 found among 9)
Chromosome Position Ref Alt Predicted byDISCOSNP
1 39261 G A Yes 4 1014763 T G Yes 4 1014850 T A Yes 6 71813 A C Yes 7 146779 T C Yes 10 179074 C A Yes 12 162304 A T Yes 14 681026 T G Yes 15 412148 G T Yes
Third population studied (13 found among 14)
Chromosome Position Ref Alt Predicted byDISCOSNP
1 191184 A G No 2 521881 C T Yes 4 1014981 A T Yes 4 1015077 G T Yes 6 70913 C T Yes 9 401526 G A Yes 10 250988 G A Yes 10 619870 G T Yes 11 64697 T C Yes 11 434707 A G Yes 12 404866 G T Yes 15 174575 T G Yes 15 1013813 C A Yes 16 79761 T G Yes
chr16:581589 mutation in experiment E2, originally presented in [26], is not reported in this table, as it could not be validated
UK. One of the goals of this study is to assess the influ-ence of depth, seasons, and extraction procedure on the sequencing [27]. To achieve this, the 13 metagenomes from MetaSoil, two additional soil metagenomes, and a seawater metagenome were compared at the func-tional level using MG-RAST [28]. This approach iden-tified 835 functional subsystems present in at least
Fig. 7 MAPSEMBLER2 output graph obtained from the Saccharomyces cerevisiae dataset visualized using GSV. A zoom is proposed for visualizing first nodes. The grey node is the starter. Node size depicts the length of the sequence stored by the node. The node and edge colors depict the read coverage (here for one among all datasets) of the sequence stored by the node. The ‘bubbles’ seen on the right of the starter witness the presence of SNPs and small indels in the datasets. Note that by changing the choice of the read set selected for visualizing the coverage (node and edge colors), one can deduce the heterozygous or homozygous nature of these variants
one of the metagenomes that were used for clustering samples.
This study was reproduced with COMMETon all
avail-able metagenomes. The generated bit vectors total 68 MB, while the explicit representation of the FASTA results requires 6.4 GB. The storage footprint is thus divided by a factor of 100. This ratio is even higher if using FASTQ format or if dealing with larger read files. The COMMET
computation time was 828 min.
Although COMMET uses another metric, the dendro-gram produced is highly similar to the MetaSoil one (see Fig. 8), and enables us to reach the conclusion that two metagenomic samples processed with the same extrac-tion procedure share more similarities at the funcextrac-tional level than two samples processed with different extraction procedures [29].
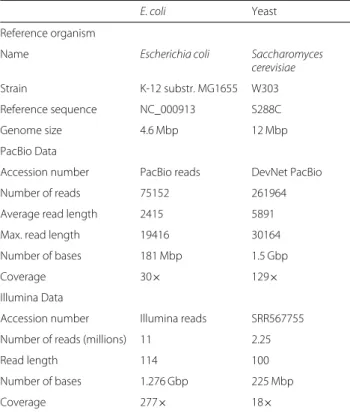
LORDEC: impact of read correction on genome assembly
To summarize, experiments on real data taken from bac-terial and yeast species, up to the case of a vertebrate genome, show that LORDEC achieves a quality at least as high as that of available state-of-the-art methods, while usually being an order of magnitude faster. Exploiting the GATB implementation of the dBG makes it by far the most scalable and economical option in terms of memory usage: LORDEC can process large datasets on a standard computer.
To assess the impact on the assembly quality of the PacBio reads correction performed with LoRDEC, we compared the assemblies obtained from corrected reads
to those computed from uncorrected reads. For this purpose, we used public datasets from the Escherichia coli and S. cerevisiae genomes (see Table 4). For each genome, we corrected with LoRDEC the PacBio reads using a set of short reads (with parameters k = 19 and s = 3, and default values for the other parameters). We then sepa-rately assembled corrected and uncorrected PacBio reads using the ABySS assembler with different values of k [30] (see the details in Additional file 1). The results are given in Table 5.
With uncorrected reads, and whatever the value of k, ABySS (v1.3.2) yields an assembly whose N50 value is close to k on both genomes, and with the longest contig below 400 bp. With PacBio reads corrected using LoRDEC, ABySS assemblies cover respectively 98 and 91 % of E. coli and S. cerevisiae genomes with respec-tively 321 and 1,657 contigs larger than 1 kbp (k= 64 and k = 51). Their N50 values reach 23 and 6.9 kbp respec-tively, while the largest contigs are 93 and 52 kbp long. Moreover, when aligning (using BLASTN, NCBI-BLAST-2.2.29+, with a reward of 1 and a penalty of−3) the contigs longer than 1 kbp against the reference genome, only 2.6 % of yeast contigs lack similarity, while all contigs of E. coli could be aligned.
The genome coverage and N50 values show that ABySS did not succeed in assembling any of the uncorrected PacBio datasets, while it yields satisfactory assemblies (i.e. sets of contigs) with the same PacBio reads that were cor-rected with LoRDEC [7]. Without correction, an assembly obtained from a traditional program is useless; clearly,
Fig. 8 Dendrograms from MetaSoil study. a Fig. from [29] showing the cluster tree, constructed using Euclidean distances, confronting 13 samples
others soil metagenomes (Puerto Rican Forest soil and Italian Forest Soil) and a metagenome from Sargasso Sea (SargassoSea). DNA extraction methods are indicated. Thus, “MP BIO 101” means Fast prep MP Bio101 Biomedical, Eschwege, Germany, “In plugs” means indirect lysis in plug, “DNA Tissue” means Nucleospin Tissue kit, “MoBio” means MoBio Powersoil DNA Isolation Kit (Carlsbad, CA, USA) and finally “Gram positive” for the Gram-positive kit b COMMETanalyses, comparing the same 15 samples
LoRDEC correction has a strong impact on the assembly quality of PacBio reads. Moreover, the correction is faster than the assembly and simplifies the latter. Importantly,
the results suggest that hybrid correction using LoRDEC makes PacBio reads amenable to a classical de Bruijn graph assembly approach. LoRDEC has also been applied
Table 4 Datasets used to evaluate the efficiency and impact of
LoRDEC read correction on the assembly
E. coli Yeast
Reference organism
Name Escherichia coli Saccharomyces
cerevisiae
Strain K-12 substr. MG1655 W303 Reference sequence NC_000913 S288C
Genome size 4.6 Mbp 12 Mbp
PacBio Data
Accession number PacBio reads DevNet PacBio
Number of reads 75152 261964
Average read length 2415 5891
Max. read length 19416 30164
Number of bases 181 Mbp 1.5 Gbp
Coverage 30× 129×
Illumina Data
Accession number Illumina reads SRR567755 Number of reads (millions) 11 2.25
Read length 114 100
Number of bases 1.276 Gbp 225 Mbp
Coverage 277× 18×
For the short read data of yeast, we used only half of the available reads. The reference yeast genome is available from [40]
to MinION reads obtained with Oxford Nanopore tech-nology and we observed a strong improvement in the mapability of the reads once corrected. More precisely, mapping the reads of an E. coli dataset on the reference genome with NucMer/Quast [31], we found that, while none of the raw MinION reads could be fully aligned, 2383 out of 2749 corrected reads were fully aligned on the genome, thereby covering 96 % of the genome. In Table 5 Comparison of the assemblies obtained for E. coli and S.
cerevisiae from either uncorrected or corrected PacBio reads
E. coli (k= 64) S. cerevisiae (k= 51)
Statistical metrics Corrected Uncorrected Corrected Uncorrected Number of contigs 2349 1721 61496 39127 Number of contigs≥1 kbp 321 0 1657 0 Genome coverage (%) 98 0 91 0 Total length (Mbp) 4.71 0.12 15.00 2.39 Largest contig (bp) 93000 127 52444 378 GC (%) 50.19 3.77 38.75 40.00 N50 23473 69 6943 57
The genome coverage accounts only for contigs longer than 1 kbp. With uncorrected reads, the N50 remains close to the k-mer length (whatever the value of k); this strongly suggests that ABySS fails to assemble uncorrected reads. On the contrary, the metrics with corrected PacBio reads indicate that it yields satisfactory assemblies for both genomes
addition, corrected reads could also be assembled with a de Bruijn-based approach.
Galaxy integration
Tools integration was made following Galaxy [8–11] team recommendations on tool configuration syntax [32] as well as on tool shed administration and use [33]. For each Galaxy tool repository, two packages are defined, one for dependencies, the other for descriptor and wrap-per if required. We used the GenOuest Galaxy devel-opment tool shed and develdevel-opment Galaxy instance to create and test the tools. GSV was originally a standalone web tool for MAPSEMBLER2 output graph visualization. Adding this tool as a visualization tool on Galaxy [34] was done following Galaxy [8–11] team instructions. Briefly, an XML configuration file is first created for the visu-alizer to define a link between a dataset and GSV. This GSV.xml file calls a Python GSV.mako template allow-ing dynamic generation of HTML and javascript codes. Finally, a GSV.js script is called to manage Galaxy file dependencies, objects, and visualization library.
Tool suite sharing
GUGGO Tool Shed [12, 13] was used to disseminate Colib’read Galaxy repositories. Corresponding tools are installed on our production Galaxy instance [35, 36], allowing scientists to use Colib’read tools freely after reg-istration on the GenOuest core facility [37]. As we join a dependencies package to our tools, Galaxy instance administrators can easily install either Galaxy tools (i.e. description files and wrappers) or Colib’read binaries and dependencies without any command line typing.
Conclusion
We propose bioinformatics tools dedicated to raw NGS data analyses for DNA-seq, RNA-seq and metagenomics studies. Thanks to the Galaxy platform, we easily made this tools suite available to life scientists, regardless their level of programming skills. Colib’read tools thus inherit reproducibility and accessibility support from Galaxy. Moreover, with the growing number of bioinformatics core facilities hosting Galaxy servers, tool shed usage enhances tools descriptors, binaries and dependencies sharing. This tools suite allows life scientists to find can-didates that cannot be found with classical assembly-based approaches. Moreover, the algorithm developments described in this paper enhance the optimization and the management of the use of computing resources, in a time where these resources can not match the pace imposed by the NGS data deluge. Applications presented in this paper illustrate the low memory footprint of the six tools devel-oped within the Colib’read framework, as well as their scalability. In replacement or combination with classical approaches, we thus propose to deal with higher amounts
of information by using efficient computation strategies for NGS data.
Availability and requirements Project name:Colib’read project Project home page:[38]
Operating system(s):Platform independent Programming language:C++
Other requirements:GATB core License:A-GPL and CeCILL
Any restrictions to use by non-academics:None Availability of supporting data
All data sets supporting the analyses are available from the GigaScience GigaDB repository [39].
Additional file
Additional file 1: Evaluation of the efficiency and the impact of the LoRDEC correction on E. coli and S. cerevisiae genome public data.
(PDF 131 kb)
Competing interests
The authors declare that they have no competing interests.
Authors’ contributions
The project was designed by PP, with guidance from ER and VL. The Galaxy tools were written, installed, and documented by YLB, CMo, VM, and CMa. The paper was written by YLB and PP with sections contributed by all authors. All authors read and approved the final manuscript.
Acknowledgements
This work is supported by ANR Colib’read; ANR-12-BS02-0008). ER, AZEA, BC acknowledge the support of Défi MASTODONS SePhHaDe from CNRS, Labex NUMev, and Projet Investissements d’Avenir France Génomique. LS is supported by the Academy of Finland (grant number 267591). GS was partially supported by the ERC program FP7/2007-2013 / ERC grant agreement no. [247073]10. YLB and OC were supported by the Brittany and Pays de la Loire regions through the Biogenouest network. We also acknowledge the use of the GenOuest bioinformatics platform at the University of Rennes 1.
Author details
1GenOuest Core Facility, UMR6074 IRISA CNRS/INRIA/Université de Rennes 1,
Campus de Beaulieu, 35042, Rennes Cedex, France.2BAMBOO team, INRIA
Grenoble Rhône-Alpes & Laboratoire Biométrie et Biologie Évolutive, UMR5558 CNRS, Université Claude Bernard (Lyon 1), Campus de la Doua, 43 Boulevard du 11 Novembre 1918, 69622, Villeurbanne Cedex, France.3MAB team, UMR5506 CNRS, Université Montpellier II, Sciences et techniques, Université Montpellier 2 LIRMM UMR 5506 CC477 161 rue Ada, 34095 Montpellier Cedex 5, France.4INRIA/IRISA, Genscale team, UMR6074 IRISA CNRS/INRIA/Université
de Rennes 1, Campus de Beaulieu, 35042, Rennes Cedex, France.5Department of Computer Science and Helsinki Institute for Information Technology HIIT, University of Helsinki, FI-00014 Helsinki, Finland.6University of Bordeaux, LaBRI/CNRS, F-33405 Talence, France.7University of Bordeaux, CBiB, F-33000
Bordeaux, France.
Received: 25 November 2014 Accepted: 7 December 2015
References
1. Colib’read Web Site. http://colibread.inria.fr/. Accessed date 23 Nov 2015. 2. Sacomoto G, Kielbassa J, Chikhi R, Uricaru R, Antoniou P, Sagot M, et al. KISSPLICE: de-novo calling alternative splicing events from rna-seq data. BMC Bioinforma. 2012;13(S-6):5.
3. Peterlongo P, Chikhi R. BMC Bioinforma. 2012;13(1):48. doi:10.1186/1471-2105-13-48.
4. Uricaru R, Rizk G, Lacroix V, Quillery E, Plantard O, Chikhi R, et al. Reference-free detection of isolated snps. Nucleic Acids Res. 2014. doi:10.1093/nar/gku1187, http://nar.oxfordjournals.org/content/early/ 2014/11/16/nar.gku1187.full.pdf+html. Accessed date 23 Nov 2015. 5. Lemaitre C, Ciortuz L, Peterlongo P. Mapping-free and assembly-free
discovery of inversion breakpoints from raw NGS reads In: Dediu A-H, Martín-Vide C, Truthe B, editors. Algorithms for Computational Biology. Tarragona, Spain; 2014. p. 119–30. doi:10.1007/978-3-319-07953-0_10. https://hal.inria.fr/hal-01063157. Accessed date 23 Nov 2015. 6. Maillet N, Collet G, Vannier T, Lavenier D, Peterlongo P. COMMET :
comparing and combining multiple metagenomic datasets. In: BIBM; 2014.
7. Salmela L, Rivals E. Lordec: accurate and efficient long read error correction. Bioinformatics. 2014. doi:10.1093/bioinformatics/btu538 http://bioinformatics.oxfordjournals.org/content/early/2014/08/27/ bioinformatics.btu538.full.pdf+html.
8. Galaxy Web Site. http://usegalaxy.org. Accessed date 23 Nov 2015. 9. Giardine B, Riemer C, Hardison RC, Burhans R, Elnitski L, Shah P, et al.
Galaxy: a platform for interactive large-scale genome analysis. Genome Res. 2005;15(10):1451–1455.
10. Goecks J, Nekrutenko A, Taylor J, Team TG. Galaxy: a comprehensive approach for supporting accessible, reproducible, and transparent computational research in the life sciences. Genome Biol. 2010;11(8):86. 11. Blankenberg D, Kuster GV, Coraor N, Ananda G, Lazarus R, Mangan M, et al. Galaxy: A web-based genome analysis tool for experimentalists. Curr Protoc Mol Biol. 201019–10.
12. GUGGO Web Site. https://www.e-biogenouest.org/groups/guggo. Accessed date 23 Nov 2015.
13. GUGGO Galaxy Tool Shed. http://toolshed.genouest.org/. Accessed date 23 Nov 2015.
14. Drezen E, Rizk G, Chikhi R, Deltel C, Lemaitre C, Peterlongo P, et al. Gatb: Genome assembly & analysis tool box. Bioinformatics. 2014;30(20): 2959–961.
15. Chikhi R, Rizk G. Space-efficient and exact de bruijn graph representation based on a bloom filter. Algorithm Mol Biol. 2013;8:22.
16. Salikhov K, Sacomoto G, Kucherov G. Using cascading bloom filters to improve the memory usage for de brujin graphs. Algorithm Mol Biol. 2014;9:2.
17. Grabherr MG, Haas BJ, Yassour M, Levin JZ, Thompson DA, Amit I, et al. Full-length transcriptome assembly from RNA-Seq data without a reference genome. Nat Biotechnol. 2011;29:644–52. doi:10.1038/nbt.1883. 18. Sacomoto G, Sinaimeri B, Marchet C, Miele V, Sagot M, Lacroix V.
Navigating in a sea of repeats in rna-seq without drowning. In: 14th International Workshop on Algorithms in Bioinformatics (WABI); 2014. p. 82–96.
19. Koren S, Schatz MC, Walenz BP, Martin J, Howard JT, Ganapathy G, et al. Hybrid error correction and de novo assembly of single-molecule sequencing reads. Nat Biotechnol. 2012;30(7):693–700.
20. Bashir A, Klammer AA, Robins WP, Chin CS, Webster D, Paxinos E, et al. A hybrid approach for the automated finishing of bacterial genomes. Nat Biotechnol. 2012;30(7):701–7.
21. Au KF, Underwood JG, Lee L, Wong WH. Improving pacbio long read accuracy by short read alignment. PLoS ONE. 2012;7(10):46679. 22. Deshpande V, Fung EDK, Pham S, Bafna V. Cerulean: A hybrid assembly
using high throughput short and long reads. In: WABI. Springer; 2013. p. 349–63. LNCS.
23. Philippe N, Boureux A, Tarhio J, Bréhélin L, Commes T, Rivals E. Using reads to annotate the genome: influence of length, background distribution, and sequence errors on prediction capacity. Nucleic Acids Res. 2009;37(15):104.
24. Dobin A, Davis CA, Schlesinger F, Drenkow J, Zaleski C, Jha S, et al. Star: ultrafast universal rna-seq aligner. Bioinformatics. 2013;29(1):15–21. doi:10.1093/bioinformatics/bts635.
25. Flicek P, Amode MR, Barrell D, Beal K, Billis K, Brent S, et al. Ensembl 2014. Nucleic Acids Res. 2014;42(D1):749–55. doi:10.1093/nar/gkt1196. http://nar.oxfordjournals.org/content/42/D1/D749.full.pdf+html. 26. Kvitek DJ, Sherlock G. Whole genome, whole population sequencing
constant environment. PLoS Genet. 2013;9(11):1003972. doi:10.1371/journal.pgen.1003972.
27. Delmont TO, Robe P, Cecillon S, Clark IM, Constancias F, Simonet P, et al. Accessing the soil metagenome for studies of microbial diversity. Appl Environ Microbiol. 2011;77(4):1315–1324.
28. Meyer F, Paarmann D, D’Souza M, Olson R, Glass E, Kubal M, et al. The metagenomics RAST server – a public resource for the automatic phylogenetic and functional analysis of metagenomes. BMC Bioinforma. 2008;9(1):386. doi:10.1186/1471-2105-9-386.
29. Delmont TO, Prestat E, Keegan KP, Faubladier M, Robe P, Clark IM, et al. Structure, fluctuation and magnitude of a natural grassland soil metagenome. ISME J. 2012;6(9):1677–1687. doi:10.1038/ismej.2011.197. 30. Simpson JT, Wong K, Jackman SD, Schein JE, Jones SJM, Birol I. Abyss: A
parallel assembler for short read sequence data. Genome Res. 2009;19(6): 1117–1123.
31. Gurevich A, Saveliev V, Vyahhi N, Tesler G. Quast: quality assessment tool for genome assemblies. Bioinformatics. 2013;29(8):1072–1075.
doi:10.1093/bioinformatics/btt086, http://bioinformatics.oxfordjournals. org/content/29/8/1072.full.pdf+html.
32. Galaxy Wiki. https://wiki.galaxyproject.org. Accessed date 23 Nov 2015. 33. Galaxy Tool Shed. https://wiki.galaxyproject.org/ToolShed. Accessed date
23 Nov 2015.
34. Andrieux A, Peterlongo P, Le Bras Y, Monjeaud C, Deltel C. Integrating new visualization tool in galaxy. In: Galaxy Community Conference 2014 (GCC2014); 2014.
35. GenOuest Galaxy Platform. http://galaxy.genouest.org/. Accessed date 23 Nov 2015.
36. Le Bras Y, Roult A, Monjeaud C, Bahin M, Quenez O, Heriveau C, et al. Towards a life sciences virtual research environment: An e-science initiative in western france. In: JOBIM 2013 Proceedings; 2013. p. 97–106. https://www.e-biogenouest.org/resources/128.
37. GenOuest Web Site. http://www.genouest.org/. Accessed date 23 Nov 2015.
38. Colib’read on Galaxy Web Site. http://colibread.inria.fr/colibread-on-galaxy/. Accessed date 23 Nov 2015.
39. Bras YL, Collin O, Monjeaud C, Lacroix V, Rivals E, Lemaitre C, et al. Software and supporting data for Colib’read on Galaxy. GigaScience Database. 2016. doi:10.5524/100170.
40. Yeast Genome Download Link. http://downloads.yeastgenome.org/ sequence/S288C_reference/genome_releases. Accessed date 23 Nov 2015.
• We accept pre-submission inquiries
• Our selector tool helps you to find the most relevant journal • We provide round the clock customer support
• Convenient online submission • Thorough peer review
• Inclusion in PubMed and all major indexing services • Maximum visibility for your research
Submit your manuscript at www.biomedcentral.com/submit
![Table 3 Isolated SNPs found in S. cerevisiae and validated in [26]](https://thumb-eu.123doks.com/thumbv2/123doknet/12148740.311633/10.892.464.810.150.939/table-isolated-snps-s-cerevisiae-validated.webp)
![Fig. 8 Dendrograms from MetaSoil study. a Fig. from [29] showing the cluster tree, constructed using Euclidean distances, confronting 13 samples others soil metagenomes (Puerto Rican Forest soil and Italian Forest Soil) and a metagenome from Sargasso Sea (](https://thumb-eu.123doks.com/thumbv2/123doknet/12148740.311633/12.892.90.806.128.933/dendrograms-metasoil-constructed-euclidean-distances-confronting-metagenomes-metagenome.webp)