CHEMICAL DIVERSITY IN THE
ULTRA-FAINT DWARF GALAXY TUCANA II
The MIT Faculty has made this article openly available. Please share
how this access benefits you. Your story matters.
Citation
Ji, Alexander P.; Frebel, Anna; Ezzeddine, Rana and Casey, Andrew
R. “CHEMICAL DIVERSITY IN THE ULTRA-FAINT DWARF GALAXY
TUCANA II.” The Astrophysical Journal Letters 832, no. 1 (November
2016): L3. © 2016 The American Astronomical Society
As Published
http://dx.doi.org/10.3847/2041-8205/832/1/l3
Publisher
IOP Publishing
Version
Final published version
Citable link
http://hdl.handle.net/1721.1/110101
Terms of Use
Article is made available in accordance with the publisher's
policy and may be subject to US copyright law. Please refer to the
publisher's site for terms of use.
CHEMICAL DIVERSITY IN THE ULTRA-FAINT DWARF GALAXY TUCANA II
* Alexander P. Ji1,2, Anna Frebel1,2, Rana Ezzeddine1,2, and Andrew R. Casey31
Department of Physics and Kavli Institute for Astrophysics and Space Research, Massachusetts Institute of Technology, Cambridge, MA 02139, USA; alexji@mit.edu
2
Joint Institute for Nuclear Astrophysics—Center for Evolution of the Elements, East Lansing, MI 48824, USA
3
Institute of Astronomy, University of Cambridge, Madingley Road, Cambridge, CB3 0HA, UK Received 2016 September 8; revised 2016 October 28; accepted 2016 October 29; published 2016 November 11
ABSTRACT
We present the first detailed chemical abundance study of the ultra-faint dwarf galaxy TucanaII, based on high-resolution Magellan/MIKE spectra of four red giant stars. The metallicities of these stars range from [Fe/H] =−3.2 to −2.6, and all stars are low in neutron-capture abundances ([Sr/Fe] and [Ba/Fe]<−1). However, a number of anomalous chemical signatures are present. One star is relatively metal-rich([Fe/H]=−2.6) and shows [Na, α, Sc/Fe]<0, suggesting an extended star formation history with contributions from AGB stars and SNeIa. Two stars with[Fe/H]<−3 are mildly carbon-enhanced ([C/Fe]∼0.7) and may be consistent with enrichment by faint supernovae, if such supernovae can produce neutron-capture elements. A fourth star with [Fe/H]=−3 is normal, and exhibits distinct light element abundance ratios from the enhanced stars. This carbon-normal star implies that at least two distinct nucleosynthesis sources, both possibly associated with PopulationIII stars, contributed to the early chemical enrichment of this galaxy. Despite its very low luminosity, TucanaII shows a diversity of chemical signatures that preclude it from being a simple“one-shot” first galaxy yet still provide a window into star and galaxy formation in the early universe.
Key words: galaxies: dwarf – galaxies: individual (Tuc II) – Local Group – stars: abundances 1. INTRODUCTION
Ultra-faint dwarf galaxies (UFDs) are old, metal-poor galaxies with large mass-to-light ratios (Simon & Geha2007; Brown et al. 2014). These galaxies are >30 kpc away, but detailed chemical abundances can be derived for the brightest stars in UFDs through high-resolution spectroscopy on 10 m class telescopes. The abundances of these metal-poor stars likely trace the nucleosynthetic output of thefirst PopulationIII (Pop III) stars that enriched their host galaxy. Since UFDs have relatively simple star formation histories, they are a particularly powerful probe for dwarf galaxy archaeology, as all their stars formed from the same galactic environment (e.g., Frebel & Bromm 2012; Karlsson et al. 2013; Ji et al. 2015). This provides valuable constraints on the nature and site of thefirst nucleosynthesis events that cannot be derived for field stars from the chemical signatures alone(e.g., Ji et al.2016a).
High-resolution spectroscopy has led to elemental abun-dance measurements of stars in 10 different UFDs. The overarching message is that, in most respects, stars in UFDs are chemically similar to ordinary metal-poor halo stars. Consider-ing the population of 10 UFDs, the lowest-metallicity stars tend to be carbon-enhanced, a likely signature of thefirst stars (e.g., Cooke & Madau2014; Placco et al.2014; Ji et al.2015; Yoon et al. 2016). Most UFDs show evidence for somewhat sustained star formation and chemical evolution, with [α/Fe] ratios that decline over the range[Fe/H]=−3 to −2, with the notable exception of Segue1 (Vargas et al. 2013; Frebel et al.2014).4The overall duration of star formation is expected to be very short(Brown et al.2014; Webster et al.2015), and these galaxies appear to completely lack stars with [Fe/H]−1.5. However, the heavy element abundances of
UFD stars differ significantly from those of halo stars. Most UFDs display the by now typical extremely low neutron-capture element abundances (e.g., Koch et al. 2013; Frebel et al.2014; Ji et al.2016c). But some UFDs deviate and contain distinctly different chemical signatures: ReticulumII shows the clear signature of a prolific r-process event (Ji et al. 2016a, 2016b; Roederer et al. 2016); and CanesVenaticiII contains a star that may have an abnormally high[Sr/Ba] ratio (François et al.2016). The diversity of neutron-capture element abundances in UFDs can be interpreted as resulting from highly stochastic production of neutron-capture elements at low [Fe/H] (e.g., Lee et al.2013).
The UFD TucanaII (henceforth Tuc II) was recently discovered in the Dark Energy Survey (Bechtol et al. 2015; Koposov et al. 2015). It was confirmed to be a galaxy by Walker et al. (2016), since it displays a significant velocity dispersion(8.6-+2.7
4.4
km s−1) and its stars span a range of up to 1 dex in metallicity. The low luminosity (MV∼−3.8) and overall metallicity(á[Fe H/ ]ñ ~ -2.2) suggest that TucII stars may contain clues regarding early nucleosynthesis and the nature of thefirst stars.
2. OBSERVATIONS AND ABUNDANCE ANALYSIS We selected four of the brightest high-probability members of TucII from Walker et al. (2016): TucII-006, TucII-011, TucII-033, and TucII-052(Figure1). On 2016 August 29–30, we used the Magellan Inamori Kyocera Echelle (MIKE) spectrograph (Bernstein et al. 2003) on the Magellan-Clay telescope with a 1 0 slit to obtain spectra of these stars (R∼22,000 and 28,000 on the red and blue chips, respec-tively) covering ∼4000–9000 Å. The seeing was poor on August 29 (1 0–3 0) and good on August 30 (∼0 7). Individual exposures were 50–55 minutes, with 2–5 exposures per star. The resulting signal-to-noise ratios are modest yet
The Astrophysical Journal Letters, 832:L3 (7pp), 2016 November 20 doi:10.3847/2041-8205/832/1/L3
© 2016. The American Astronomical Society. All rights reserved.
* This paper includes data gathered with the 6.5 m Magellan Telescopes located at Las Campanas Observatory, Chile.
4 / =
-
N N N N
X Y log10 X Y log10 X Y
comparable to previous UFD star observations (e.g., Ji et al.2016c). Table1details our observations.
Spectra were reduced with the CarPy MIKE pipeline (Kelson 2003).5 We normalized the spectra and determined radial velocity by cross-correlation with the Mg triplet near 5200Å using the SMH analysis software (Casey 2014). Heliocentric velocity corrections were determined with rvcor in IRAF. Our results match the velocities reported by Walker et al.(2016) within 2 km s−1, showing no clear evidence for binaries. Selected spectral regions are shown in Figure2.
We perform a standard abundance analysis of these stars (details given in Frebel et al. 2013; Ji et al. 2016b). The analysis is performed exactly the same way as in Ji et al. (2016b), but here we summarize key points. We used SMH to measure equivalent widths and run the MOOG abfind and synth drivers for stellar parameters and abundances (Sne-den 1973). We use the 2011 MOOG version that accounts for scattering (Sobeck et al. 2011). Stellar parameters are determined spectroscopically through excitation, ionization, and reduced equivalent width balance(e.g., Frebel et al.2013). Stellar parameter uncertainties are determined assuming systematic uncertainties of 150 K, 0.3 dex, and 0.2 km s−1 for Teff, log , andg νmicr respectively. TucII-006 has no reliable FeIIline detections, so we use its Teffto determineloggfrom a [Fe/H]=−3, 12 Gyr isochrone (Kim et al. 2002), and we adopt a conservative uncertainty of 0.4 dex. We use spectral synthesis to determine the abundance of C, Sc, Mn, Sr, Ba, and some lines of Al and Si. Abundances of other elements are determined from equivalent width fitting, where the typical uncertainties are 6%–12% (10%–17% for TucII-006, which has a noisier spectrum). Table1reports our stellar parameters and abundances.
One-dimensional models invoking the LTE assumption can produce biased metallicities at low [Fe/H]. We thus also
determine NLTE stellar parameters using a complete iron model atom introduced in Ezzeddine et al.(2016). For inelastic hydrogen collisions, we use quantum-based rates inspired by fitting quantum rates of Na, Mg, Al, and Si and applying them to Fe (R. Ezzeddine et al. 2016, in preparation). This leads to more accurate abundances and avoids the Drawin (Drawin 1969) approximation that overestimates collisional rates by orders of magnitude. Using line-by-line NLTE corrections, we rebalance the Fe abundance with respect to excitation, ionization, and reduced equivalent width. These NLTE stellar parameters are given in Table 1. Teffvalues are 100 K lower than those derived in LTE, and the three stars with available FeII line measurements have slightly higher
g
log values (0.3 dex). All four stars have higher final Fe abundance in NLTE, with differences of Δ[Fe/H] = [Fe/H]NLTE− [Fe/H]LTEon the order of 0.25 dex. Increases of this magnitude are expected at these low metallicities and are in accordance with other NLTE-LTE Fe corrections(Lind et al. 2012). Since nearly all literature studies use LTE, our subsequent discussion focuses on the LTE stellar parameters. We consider the NLTE parameters when they could affect our conclusions. We have not used NLTE corrections for elements other than Fe. Future work should make a concerted effort to address this and other topics with full NLTE-derived abundances.
Walker et al.(2016) also determined the stellar parameters and metallicities of these stars from their M2FS data, using a grid of spectra from the Segue Stellar Parameter Pipeline (SSPP; Lee et al.2008). They cover a 50 Å region around the Mg b triplet. In this region, the MIKE and M2FS spectra have comparable signal-to-noise ratios and spectral resolution. Given the limited wavelength range, their stellar parameters are strongly influenced by a prior from photometry (Koposov et al. 2015). They determine stellar parameters independently for their repeat 2015 July and September spectra. Our results agree well with at least one of these two stellar parameter determinations.
At first, it appears that our metallicities are significantly lower than those determined by Walker et al.(2016). However, they calibrate their model against twilight spectra of the Sun. They apply a −0.3 offset to logg and a −0.32 dex offset to [Fe/H] to match the solar values. When we use their stellar parameters and increase our metallicities by +0.32 dex, the [Fe/H] abundances agree to within <0.15 dex for TucII-006, TucII-033, and TucII-052, well within the statistical uncertain-ties. However, our metallicities are systematically∼0.3 dex less for TucII-011, which is a cooler star. We verify with the online M2FS spectra6that the differences are not due to noise in the data. This star is somewhat Mg enhanced ([Mg/Fe] = 0.73), which may explain the difference, as the SSPP grid assumes [Mg/Fe] = 0.4. Otherwise, a difference between the SSPP spectral grid(which was synthesized with turbospectrum) and MOOG for cooler stars may be responsible for the discrepancy.
Given our data quality, we consider most absorption lines below 4000Å to be unreliable, although we have used a few strong and well-detected iron lines. This restricts our ability to determine the abundances of some elements. In particular, Al abundances are derived from only two lines at ∼3950 Å, and have very large uncertainties. The Si 3905Å line is entirely
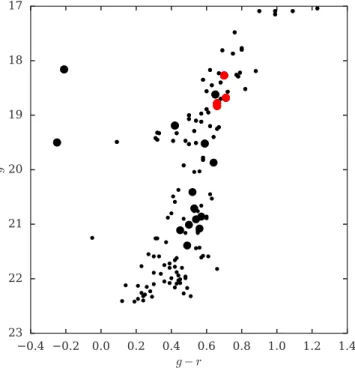
Figure 1. Color–magnitude diagram of stars with photometry from Walker et al.(2016). Stars with >80% membership probability are denoted by large black circles, while observed stars are indicated by red circles.
5
http://code.obs.carnegiescience.edu/mike 6 http://dx.doi.org/10.5281/zenodo.37476
2
Table 1
Observed Stars and Abundances
TucII-006 TucII-011 TucII-033 TucII-052
R.A.(hms) 22 51 43.06 22 51 50.28 22 51 08.32 22 50 51.63 Decl.(dms) −58 32 33.7 −58 37 40.2 −58 33 08.1 −58 34 32.5 Va 18.5 17.9 18.4 18.5 texp(min) b 55, 2×50 3×55, 2×50 2×50 2×50 S/Nc 10, 20 16, 31 17, 31 15, 27 vhel(km s−1) −125.3±0.1 −126.1±0.1 −126.8±0.1 −121.4±0.1
LTE NLTE LTE NLTE LTE NLTE LTE NLTE
Teff(K) 4945±215 4900±200 4675±162 4670±150 4855±166 4800±100 4900±256 4800±180
g
log (cgs) 1.90±0.40 1.90±0.40 1.00±0.36 1.30±0.20 1.45±0.34 1.60±0.20 1.96±0.42 2.10±0.40 νmicr(km s−1) 2.20±0.26 2.40±0.30 1.96±0.22 2.20±0.20 2.28±0.23 2.20±0.20 2.00±0.30 2.20±0.30
[Fe/H] (dex) −3.18±0.21 −2.93±0.14 −3.00±0.19 −2.78±0.15 −2.59±0.22 −2.52±0.17 −3.25±0.25 −3.08±0.16
N logò(X) σ [X/Fe] N logò(X) σ [X/Fe] N logò(X) σ [X/Fe] N logò(X) σ [X/Fe]
Cd 2 5.90 0.22 0.65 2 5.03 0.30 −0.40 2 6.06 0.21 0.23 2 5.88 0.17 0.70 NaI 2 3.21 0.17 0.15 2 3.87 0.29 0.62 2 3.37 0.04 −0.28 2 3.15 0.27 0.16 MgI 3 4.80 0.17 0.38 5 5.33 0.11 0.73 4 4.97 0.34 −0.03 2 4.80 0.11 0.45 AlI 1 <4.17 K <0.90 2 2.79 0.65 −0.66 2 2.96 0.73 −0.90 2 2.75 0.73 −0.45 SiI 1 <6.03 K <1.70 1 5.09 0.30 0.58 1 5.14 0.23 0.22 1 <6.26 K <2.00 CaI 4 3.48 0.17 0.33 8 3.89 0.16 0.54 6 4.05 0.25 0.31 3 3.37 0.13 0.28 ScII 4 −0.13 0.31 −0.10 5 0.23 0.19 0.08 5 0.14 0.21 −0.42 5 −0.05 0.31 0.05 TiII 9 1.97 0.23 0.21 19 2.02 0.23 0.06 18 2.23 0.21 −0.13 10 2.03 0.16 0.33 CrI 1 1.94 0.33 −0.52 4 2.32 0.31 −0.32 7 3.03 0.35 −0.02 5 2.26 0.06 −0.13 MnI 2 1.40 0.72 −0.85 3 1.41 0.44 −1.02 3 2.14 0.62 −0.70 3 1.25 0.76 −0.93 FeI 32 4.32 0.21 0.00 88 4.50 0.19 0.00 101 4.91 0.22 0.00 37 4.25 0.25 0.00 FeII 0 K K K 10 4.47 0.19 −0.04 15 4.94 0.20 0.03 2 4.25 0.28 0.00 CoI 1 <4.16 K <2.35 1 1.98 0.37 −0.01 4 2.41 0.29 0.01 1 <3.99 K <2.25 NiI 1 <3.83 K <0.79 1 3.23 0.17 0.01 1 3.60 0.33 −0.03 1 <3.55 K <0.58 SrII 2 −1.51 0.47 −1.20 2 −2.18 0.43 −2.05 2 −0.62 0.61 −0.90 2 −1.63 0.50 −1.25 SrIIe <−0.76 K <−0.45 <−1.43 K <−1.30 K K K <−0.98 K <−0.60 BaII 2 −1.85 0.26 −0.85 1 −2.62 0.30 −1.80 2 −1.56 0.36 −1.15 2 −2.02 0.29 −0.95 BaIIe <−1.60 K <−0.60 <−2.42 K <−1.60 K K K <−1.87 K <−0.80 EuII 1 <−1.06 K <1.60 1 <−1.93 K <0.55 1 <−1.87 K <0.20 1 <−1.53 K <1.20
Notes. Detailed chemical abundances calculated in LTE with LTE stellar parameters.
a
Converted from Walker et al.(2016) with a formula from Bechtol et al. (2015).
b
Exposure times for TucII-006 and TucII-011 are listed separately for each night. The seeing was poor on thefirst night.
c
S/N per pixel (∼0.1 Å) at 5200 and 6000 Å.
d
Carbon not corrected for evolutionary status; see the text.
e 3σ upper limit. 3 Astrophysical Journal Letters, 832:L3 (7pp ), 2016 November 20 Ji et al.
unreliable, so we only use the 4102Å line when available. Mn abundances should be regarded with caution, as they are derived from the 4030, 4033, and 4034Å lines. The Sr 4077 Å line is clearly detected but has large abundance uncertainties. We place Eu limits with the 4129Å line.
We correct the carbon abundances for the stars’ evolutionary status(Placco et al.2014) by assuming [N/Fe]=0.5, although the corrections differ by<0.05 dex for −0.5<[N/Fe]<1.0. The[C/Fe] corrections are +0.05 dex (TucII-006), +0.74 dex 011), +0.47 dex 033), and +0.01 dex (TucII-052). We use the LTE stellar parameters, as Placco et al. (2014) empirically adjusted the carbon corrections to match data derived with pure LTE. Even after applying the large correction, TucII-011 is not carbon-enhanced. The other three stars are just past the threshold of the carbon-enhanced metal-poor(CEMP) definition ([C/Fe] 0.7, Aoki et al.2007). The corrections for TucII-033 are particularly sensitive to differ-ences in log . Given itsg logg uncertainty, we thus do not consider this star to clearly be a carbon-enhanced star.
The lines of neutron-capture elements Sr and Ba are visually detected in all stars, although in some stars the line depths are only somewhat larger than the noise level. In Table1, we list the abundances measured from all detected features, as well as 3σ upper limits. All four stars clearly have [Sr, Ba/Fe]<0, making three of them CEMP-no stars.
Figure 3 shows the abundances of our four TucII stars compared to those of halo stars and stars in other UFDs. Overall, the TucII stars have similar abundances as other UFD stars, with typical halo-like abundances of elements up to Ni, and low neutron-capture element abundances. Nevertheless, there are several interesting abundance differences between these four TucII stars that we now consider.
3. POPIII SIGNATURES IN TUCANAII
Wefirst focus on the three extremely metal-poor (EMP) stars TucII-006, TucII-011, and TucII-052, with [Fe/H]−3. These are the stars that are more likely to trace unique PopIII nucleosynthesis signatures.
TucII-006 and TucII-052 are CEMP-no stars([C/Fe]=0.7, [Sr, Ba/Fe]<0). They are only just past the CEMP threshold, but the C, Fe, Na, and Mg abundances place these stars squarely as GroupII CEMP-no stars, according to the classification of Yoon et al. (2016). All elemental abundances of TucII-006 and TucII-052 are consistent with being identical given the uncertainties, as might be expected if both stars formed from the same star cluster (e.g., Bland-Hawthorn et al.2010). The high abundance precision required to test the cluster hypothesis likely requires much higher S/N data that could be obtained with 30 m class telescopes(e.g., G-CLEF on the Giant Magellan Telescope; Szentgyorgyi et al.2014).
TucII-011 is an EMP star([Fe/H]=−3) but is not carbon-enhanced([C/Fe]=+0.34 after positive correction). It is just the third EMP star known in a UFD that is not carbon-enhanced (of 18 total EMP stars in 11 UFDs). The other two non-CEMP stars in UFDs are DES J033531–540148 in RetII (Ji et al. 2016b; Roederer et al.2016) and Boo-980 in BootesI (Frebel et al. 2016). This CEMP fraction (83%) is somewhat higher than the halo (Placco et al. 2014) but is consistent with expectations for UFDs(Salvadori et al.2015). Besides carbon, TucII-011 differs from the TucII CEMP-no stars in having especially low neutron-capture element abundances ([Sr, Ba/Fe]∼−2) as well as somewhat enhanced [Na/Fe]∼0.6, [Mg/Fe]∼0.7, and [Ca/Fe]∼0.55. The abundances of 011 are thus qualitatively different from those of TucII-006 and TucII-052, likely requiring at least two different types of metal sources as an explanation. As all three stars have
Figure 2. Spectral regions around the CH band, Ba line, and Mg triplet. HD 122563 is shown for comparison. The best-fit CH synthesis is shown. Around the Ba 4554Å line, we show our best-fit synthesis in solid red, and the limits of [Ba/Fe] = 0, −1, and −0.5 for TucII-006, TucII-011, and TucII-052 with dotted red lines (Table1). The dashed red lines around TucII-033 indicate ±0.3 dex.
4
[Fe/H]−3, this could suggest that PopIII stars produce at least two distinct types of yields(e.g., Cooke & Madau2014; Ji et al.2015; and in contrast to, e.g., Salvadori et al.2015). An interesting alternate scenario is if different metals created from a single source were to mix differently into the surrounding gas (Sluder et al. 2016). We note that high Na and Mg are also found in DES J033531–540148 (a non-r-process star in Reticulum II), but not in Boo-980.
[Sr/Ba] can in principle provide insight into the origin of the neutron-capture elements in TucII. We caution against over-interpreting this ratio for our stars, as Sr and Ba have significant abundance uncertainties. But at face value, the three EMP stars all appear to have Sr and Ba detections with[Sr/Ba]∼−0.3. Empirically, from metal-poor halo stars, the r-process produces [Sr/Ba]∼−0.3 and the metal-poor s-process produces [Sr/Ba]−1 (computed from r-II and CEMP-s stars in
Figure 3. Abundances of elements in TucII (large red points; this work), other UFDs (colored points; see the references in Ji et al. (2016b), Sr and Ba for one star from Roederer et al.2016), and halo stars (gray points; Frebel2010). The open points with arrows indicate upper limits. Carbon abundances have been corrected for evolutionary status(Placco et al.2014). From low to high [Fe/H], the TucII stars are TucII-052, TucII-006, TucII-011, and TucII-033. TucII-052 and TucII-006 have similar overall abundances corresponding to GroupII CEMP-no stars. TucII-011 is not carbon-enhanced and appears to have different Na, Mg, Ca, Sr, and Ba than the two CEMP-no stars. The higher metallicity star TucII-033 shows evidence of extended chemical enrichment in TucII.
Frebel2010). The [Sr/Ba] ratios of stars in TucII thus appear to disfavor the s-process as the source of these elements. However, the lowest-metallicity spinstar models (15–40 Me, Z∼10−5Ze) can also produce [Sr/Ba]∼−0.5 (Frischknecht et al.2016).
In a UFD, it is possible to place loose constraints on the neutron-capture element yields, as the galactic environment restricts gas dilution masses to the range MH∼106±1Me(Ji et al.2016a). For core-collapse supernova models producing Sr in neutrino-driven winds(e.g., Wanajo2013), the overall yield of MSr∼10−6Meresults in[Sr/H]∼−5±1, consistent with the [Sr/H] ratios observed in TucII.7 In contrast, a single 15–40 MeZ∼10−3Ze spinstar produces MSr~10- 8 1M,
resulting in[Sr/H]∼−7±2, lower than what is found in our TucII stars. A 10−5Zespinstar should produce even less(see Frischknecht et al. 2016, Figure 15).
Yoon et al. (2016) hypothesize that the GroupII CEMP-no stars (i.e., TucII-006, TucII-052) formed out of gas enriched only by faint, low-energy Pop III supernovae (e.g., Heger & Woosley 2010; Nomoto et al. 2013; Cooke & Madau 2014). However, if faint supernovae must be invoked to produce enhanced [C/Fe] seen in some TucII stars, it seems unlikely that any neutron-capture material produced deep in the core of the massive star will be able to escape. The neutron-capture elements found in the CEMP-no stars would then have to be synthesized in other ways, either elsewhere in the star or from a completely different source. A possible alternative is if core material escapes through jets, as some jet supernovae may also produce carbon-enhanced metal yields(Tominaga et al.2007). We note that the apparent ubiquity of neutron-capture elements in metal-poor stars(Roederer2013) suggests that there should be a mechanism capable of producing these elements early on, even if only in very small amounts.
4. EXTENDED STAR FORMATION IN TUCANAII One of our four stars (TucII-033) is relatively metal-rich ([Fe/H]=−2.6). Because of the higher Fe content, simple homogeneous chemical evolution models would imply that this star formed later than the other three stars. Inhomogeneous metal mixing is an alternate possibility to produce this star (Frebel & Bromm 2012; Karlsson et al. 2013; Webster et al. 2015). This star has similar [Sr, Ba/Fe] ratios to the CEMP-no stars and similar or slightly lower[C/Fe] (depending on the carbon correction), but much lower [Na, α, Sc/Fe]0. The abundance uncertainties are large, but if these differences are all true then one explanation is that this star has formed from gas additionally enriched both by SNeIa (decreasing [X/Fe] for most elements) and from AGB stars (increasing [C, Sr, Ba/Fe]). TucII-033 thus provides evidence for more extended chemical enrichment in TucII, in contrast to the smallest UFDs like Segue1 (MV=−3.8 and −1.5 for TucII and Segue1, respectively, Simon et al. 2011; Koposov et al. 2015). More detailed investigations into the galaxy formation history require either very accurate photometry (e.g., Brown et al.2014) or a much larger sample of stellar metallicities (e.g., Kirby et al. 2011). According to the one-shot enrichment criteria in Frebel & Bromm (2012), we thus do not consider TucII to be a “first galaxy” candidate. Segue1 thus remains
the only known galaxy to date unambiguously satisfying the first galaxy criteria (Frebel et al.2014).
The metallicity distribution function (MDF) of dwarf galaxies could provide additional insight into their formation histories (e.g., Kirby et al. 2011; Webster et al. 2015). Unfortunately, Walker et al. (2016) have too few stars to formally resolve the metallicity dispersionσ[Fe/H]of TucII, but the metallicity range of their probable members is ∼1 dex. NLTE corrections can increase the average [Fe/H] by ∼0.2 dex, and the corrections are larger for the most metal-poor stars. Any interpretations or models of the MDF should keep these systematic differences in mind.
Walker et al.(2016) pointed out that the orbit of TucII is consistent with it being a member of the LMC system. This raises the question of whether the LMC environment might somehow affect the formation history of this galaxy. Indeed, hierarchical structure formation simulations suggest that most present-day Milky Way subhalos associated with UFDs fell into the Milky Way as members of larger systems (Wetzel et al. 2015). However, UFDs complete >80% of their star formation by z=6 (Brown et al. 2014) and do not tend to accrete into larger systems until well after z=6 (Wetzel et al. 2015). Consequently, their star formation history is probably more influenced by reionization than by environ-mental effects. Furthermore, a galaxy of TucII’s luminosity is unlikely to have more than one star-forming progenitor halo (B.F. Griffen et al. 2016, in preparation). Given the low masses and mostly isolated formation histories of UFDs, high-resolution hydrodynamic zoom-in simulations of UFDs should be relatively inexpensive. We suggest that statistical samples of UFD simulations could be a fruitful path toward understanding questions such as inhomogeneous metal mixing and the impact of different reionization models on the formation histories of these galaxies.
We thank Ani Chiti and Ian Roederer for helpful discussions. A.P.J. and A.F. are supported by NSF-CAREER grant AST-1255160. A.F. acknowledges support from the Silverman (1968) Family Career Development Professorship. This work benefited from support by the National Science Foundation under grant No. PHY-1430152(JINA Center for the Evolution of the Elements). A.R.C. was supported by the European Union FP7 programme through ERC grant number 320360. This work made extensive use of NASA’s Astrophysics Data System Bibliographic Services and the python libraries numpy, scipy, matplotlib, pandas, seaborn, and astropy (Astropy Collaboration et al.2013).
REFERENCES
Aoki, W., Beers, T. C., Christlieb, N., et al. 2007,ApJ,655, 492
Astropy Collaboration, Robitaille, T. P., Tollerud, E. J., et al. 2013,A&A, 558, A33
Bechtol, K., Drlica-Wagner, A., Balbinot, E., et al. 2015,ApJ,807, 50 Bernstein, R., Shectman, S. A., Gunnels, S. M., Mochnacki, S., & Athey, A. E.
2003,Proc. SPIE,4841, 1694
Bland-Hawthorn, J., Karlsson, T., Sharma, S., Krumholz, M., & Silk, J. 2010,
ApJ,721, 582
Brown, T. M., Tumlinson, J., Geha, M., et al. 2014,ApJ,796, 91 Casey, A. R. 2014, PhD thesis, Australian National Univ. Cooke, R. J., & Madau, P. 2014,ApJ,791, 116 Drawin, H. W. 1969,ZPhy,225, 470
Ezzeddine, R., Merle, T., & Plez, B. 2016,AN,337, 850 François, P., Monaco, L., Bonifacio, P., et al. 2016,A&A,588, A7 Frebel, A. 2010,AN,331, 474
Frebel, A., & Bromm, V. 2012,ApJ,759, 115
7 In these models, Ba is produced with[Sr/Ba]∼0–0.4 if the proto-neutron
star has a mass 2 Me.
6
Frebel, A., Casey, A. R., Jacobson, H. R., & Yu, Q. 2013,ApJ,769, 57 Frebel, A., Norris, J. E., Gilmore, G., & Wyse, R. F. G. 2016,ApJ,826, 110 Frebel, A., Simon, J. D., & Kirby, E. N. 2014,ApJ,786, 74
Frischknecht, U., Hirschi, R., Pignatari, M., et al. 2016,MNRAS,456, 1803 Heger, A., & Woosley, S. E. 2010,ApJ,724, 341
Ji, A. P., Frebel, A., & Bromm, V. 2015,MNRAS,454, 659 Ji, A. P., Frebel, A., Chiti, A., & Simon, J. D. 2016a,Natur,531, 610 Ji, A. P., Frebel, A., Simon, J. D., & Chiti, A. 2016b,ApJ,830, 93 Ji, A. P., Frebel, A., Simon, J. D., & Geha, M. 2016c,ApJ,817, 41 Karlsson, T., Bromm, V., & Bland-Hawthorn, J. 2013,RvMP,85, 809 Kelson, D. D. 2003,PASP,115, 688
Kim, Y.-C., Demarque, P., Yi, S. K., & Alexander, D. R. 2002,ApJS,143, 499 Kirby, E. N., Lanfranchi, G. A., Simon, J. D., Cohen, J. G., & Guhathakurta, P.
2011,ApJ,727, 78
Koch, A., Feltzing, S., Adén, D., & Matteucci, F. 2013,A&A,554, A5 Koposov, S. E., Belokurov, V., Torrealba, G., & Evans, N. W. 2015, ApJ,
805, 130
Lee, D. M., Johnston, K. V., Tumlinson, J., Sen, B., & Simon, J. D. 2013,ApJ, 774, 103
Lee, Y. S., Beers, T. C., Sivarani, T., et al. 2008,AJ,136, 2022 Lind, K., Bergemann, M., & Asplund, M. 2012,MNRAS,427, 50
Nomoto, K., Kobayashi, C., & Tominaga, N. 2013,ARA&A,51, 457 Placco, V. M., Frebel, A., Beers, T. C., & Stancliffe, R. J. 2014,ApJ,797, 21 Roederer, I. U. 2013,AJ,145, 26
Roederer, I. U., Mateo, M., Bailey, J. I., III, et al. 2016,AJ,151, 82 Salvadori, S., Skúladóttir, Á., & Tolstoy, E. 2015,MNRAS,454, 1320 Simon, J. D., & Geha, M. 2007,ApJ,670, 313
Simon, J. D., Geha, M., Minor, Q. E., et al. 2011,ApJ,733, 46
Sluder, A., Ritter, J. S., Safranek-Shrader, C., Milosavljević, M., & Bromm, V. 2016,MNRAS,456, 1410
Sneden, C. A. 1973, PhD thesis, Univ. Texas
Sobeck, J. S., Kraft, R. P., Sneden, C., et al. 2011,AJ,141, 175
Szentgyorgyi, A., Barnes, S., Bean, J., et al. 2014, Proc. SPIE, 9147, 914726
Tominaga, N., Maeda, K., Umeda, H., et al. 2007,ApJL,657, L77 Vargas, L. C., Geha, M., Kirby, E. N., & Simon, J. D. 2013,ApJ,767, 134 Walker, M. G., Mateo, M., Olszewski, E. W., et al. 2016,ApJ,819, 53 Wanajo, S. 2013,ApJL,770, L22
Webster, D., Bland-Hawthorn, J., & Sutherland, R. 2015,ApJL,799, L21 Wetzel, A. R., Deason, A. J., & Garrison-Kimmel, S. 2015,ApJ,807, 49 Yoon, J., Beers, T. C., Placco, V. M., et al. 2016, ApJ, in press