HAL Id: hal-02297484
https://hal.archives-ouvertes.fr/hal-02297484
Submitted on 26 Sep 2019
HAL is a multi-disciplinary open access
archive for the deposit and dissemination of
sci-entific research documents, whether they are
pub-lished or not. The documents may come from
teaching and research institutions in France or
abroad, or from public or private research centers.
L’archive ouverte pluridisciplinaire HAL, est
destinée au dépôt et à la diffusion de documents
scientifiques de niveau recherche, publiés ou non,
émanant des établissements d’enseignement et de
recherche français ou étrangers, des laboratoires
publics ou privés.
Phosphorus adsorption/desorption processes in the
tropical Saigon River estuary (Southern Vietnam)
impacted by a megacity
Tuyet T.N. Nguyen, Julien Nemery, Nicolas Gratiot, Josette Garnier, Emilie
Strady, Viet Q. Tran, An T. Nguyen, Thi N.T. Nguyen, Claire Golliet, Joanne
Aimé
To cite this version:
Tuyet T.N. Nguyen, Julien Nemery, Nicolas Gratiot, Josette Garnier, Emilie Strady, et al..
Phos-phorus adsorption/desorption processes in the tropical Saigon River estuary (Southern Vietnam)
impacted by a megacity.
Estuarine, Coastal and Shelf Science, Elsevier, 2019, 227, pp.106321.
Contents lists available atScienceDirect
Estuarine, Coastal and Shelf Science
journal homepage: www.elsevier.com/locate/ecss
Phosphorus adsorption/desorption processes in the tropical Saigon River
estuary (Southern Vietnam) impacted by a megacity
Tuyet T.N. Nguyen
a,b,∗, Julien Némery
a,b, Nicolas Gratiot
a,b, Josette Garnier
c, EmilieStrady
b,e,
Viet Q. Tran
b, An T. Nguyen
b, Thi N.T. Nguyen
b, Claire Golliet
d, Joanne Aimé
da Univ. Grenoble Alpes, CNRS, IRD, Grenoble INP1, IGE, F-38000, Grenoble,France
b Centre Asiatique de Recherche sur l’Eau, Ho Chi Minh City University of Technology, Viet Nam
c Sorbonne Université, CNRS, EPHE, UMR, 7619 Metis, BP 105, Tour 56-55, Etage 4, 4 Place Jussieu, 75005, Paris, France d IRD, Viet Nam
e Aix-Marseille Univ., Mediterranean Institute of Oceanography (M I O), Marseille, Université de Toulon, CNRS /IRD, France
A R T I C L E I N F O Keywords: Sediment Tropical region Phosphorus dynamics Eutrophication Flocculation A B S T R A C T
The Saigon River flows through one of the most rapidly growing megacities of Southeast Asia, Ho Chi Minh City (HCMC, > 8.4 million inhabitants). This tidal river is characterized by a tropical monsoon climate, alternating a wet and a dry season. In the last few decades, increased economic and urban developments of HCMC have led to harmful impacts on the water quality of this tidal river, with severe eutrophication events. This situation results from the conjunction of contrasting hydrological seasons and the lack of upgraded sanitation infrastructures: indeed, less than 10% of the domestic wastewater is collected and treated before being discharged directly into urban canals or rivers. This study focuses on P dynamics because this is considered the key nutrient factor controlling freshwater eutrophication. Based on field measurements and original laboratory experiments, we assessed the P levels in the river water and sediments, and investigated P adsorption/desorption capacity onto suspended sediment (SS) within the salinity gradient observed. Field surveys showed a clear impact of the HCMC megacity on the total P content in SS, which increased threefold at HCMC Center, as compared with the up-stream values (0.3–0.8 gP kg−1). Downstream, in the mixed estuarine area, the Total P was lower than 0.5 gP kg−1. Laboratory experiments were carried out to characterize the influence of SS concentrations (SS = [0.25– 0.9] g L−1), salinity (S = [2.6–9.3]) and turbulence (G = [22–44] s− 1) on the sorption capacity of P onto sediment. The size of sediment particles and their propensity to flocculate were also originally measured with a recently developed instrument: the System for the Characterization of Aggregates and Flocs (SCAF®). Under the experimental conditions considered, SS concentrations had the greatest effect on the adsorption of P onto sediment, e.g., P adsorption capacity increased when SS concentrations rose. In contrast, salinity and turbulence had a smaller effect on the adsorption properties of sediments. Among these observed variables, the SS concentration was shown to be the main driver for adsorption capacity of P onto SS within the salinity gradient. We discuss the implication of these findings on understanding P dynamics within a highly urbanized, tropical estuary.
1. Introduction
Among all nutrients, phosphorus (P) is generally recognized as playing a crucial role for plant growth in soils and aquatic environ-ments. Since the 1960s, the utilization of mineral fertilizers and poly-phosphates in washing powders has increased the P inputs to most aquatic environments of northern countries with serious ecological consequences. P was banished in washing powders in the mid-1990s,
and its application to soils was also reduced (Némery and Garnier, 2016; Le Noë et al., 2018). In the same period, many scientists con-tinued to pay attention to P concentrations in water (since Vollenweider, 1968), but started to analyze its reactivity with sediment (Heathwaite and Johnes, 1998; Sims et al., 1998; Sui et al., 1999; Richard et al., 2001), and showed that high P values could strongly promote algal growth and increase the risk of eutrophication. Such studies have highlighted that the mobility of P and its sorption capacity
∗ Corresponding author. Univ. Grenoble Alpes, CNRS, IRD, Grenoble INP, IGE, F-38000, Grenoble, France.
E-mail addresses: tuyet.nguyen@univ-grenoble-alpes.fr, ngoctuyet1412@gmail.com (T.T.N. Nguyen), julien.nemery@grenoble-inp.fr (J. Némery).
1 Institute of Engineering Univ. Grenoble Alpes.
https://doi.org/10.1016/j.ecss.2019.106321
Avail abl e onl i ne 02Augus t 2019
Received 7 March 2019; Received in revised form 30 July 2019; Accepted 1 August 2019 0272-77 1 4/ © 2 0 1 9E l s e v i e r Lt d. A l l r i gh t s re s e r ve d.
can shift from dissolved to particulate phases through biological and physicochemical processes, with some consequences on P transport and P dynamics. P can be transported from upstream basins to estuaries in the form of particulate phosphorus (PP) (Conley et al., 1995;Paludan and Morris, 1999;Martha et al., 2004;Némery and Garnier, 2007), but P can also be released from particulate to dissolved form, which leads to the increase of the dissolved P concentration in aquatic systems. Dis-solved P is then easily available for phytoplankton uptake (Meybeck, 1982;Reddy et al., 1999;Jordan et al., 2008).
Phosphorus can be transformed by adsorption/desorption and by precipitation/dissolution processes (Froelich, 1988). These processes can be controlled by iron (Fe), aluminum (Al) oxides and their organic complexes (Torrent, 1997;Borggaard et al., 2005;Bruland and DeMent, 2009;Hinkle et al., 2015), silicate clays and calcite (Richardson, 1985; House and Donaldson, 1986;Millero et al., 2001). The change of the ionic strength within the salinity gradient (i.e., between brackish and saline waters) is considered as an important factor for P adsorption/ desorption capacity (Sundareshwar and James, 1999; Némery and Garnier, 2007;Jordan et al., 2008;Bruland and DeMent, 2009;Zhang and Huang, 2011). The sediment redox potentials, especially the low ones, can also have an impact on dissolution and can release P into water (Lai and Lam, 2008).
Since P can adsorb onto particles, hydrodynamic (river discharge, tides and induced turbulence, salinity) and sediment dynamics (erosion, transportation, flocculation, deposition) conditions need to be char-acterized prior to any robust assessment of eutrophication risk. While sediment transport depends on water discharge (Craft and Richardson, 1993;Guo et al., 2004), dissolved P release is governed by diffusion of P from pore water of the underlying sediment (Reddy et al., 1995; Richardson, 1985). Likewise, physical characteristics of sediment such as particle size, porosity and flocculation can become the dominant factor for P adsorption capacity. When particle size distribution (PSD) of SS decreases, P adsorption capacity onto sediments usually increases
(Walter and Morse, 1984; Zhang and Huang, 2007) because the pro-portion of fine clay particles increases. A sediment containing a sig-nificant proportion of clay minerals, with electromagnetic properties causing the sediment to bind together, is called a cohesive sediment. Small particles can be easily re-suspended by turbulence, however (through wave action or the tide in estuaries), and have a longer re-sidence time in the water column than coarser particles, such as silt and sand, which are mostly transported by siltation near the bottom. Therefore, cohesive sediments interact more easily with dissolved P in the water column. Moreover, P adsorption capacity can be strongly modified at the interface of bottom sediment and water (Kim et al., 2003;Wang et al., 2006).
In developing countries, such as Vietnam, fast economic growth has affected the quality of aquatic systems (Trinh et al., 2012). Aquatic
systems are thus frequently enriched in P by both the diffuse (e.g., agricultural activities) and point inputs (e.g., domestic and industrial wastewater discharge) (Camargo et al., 2005). This is particularly the case of Ho Chi Minh City (HCMC), the second largest city in Vietnam. Industrialization and urbanization have developed rapidly during the last decade while wastewater treatment has remained basically un-changed (Marcotullio, 2007; Nguyen et al., 2019; Strady et al., 2017).
The main objective of this study was to assess the dynamics of P in the particulate and dissolved phases along the tidal Saigon River during the dry and wet seasons for a better understanding of the cause of eu-trophication. For this purpose, we investigated P adsorption/desorption
capacity onto SS at different environmental conditions (i.e., level of SS concentration, salinity, turbulence) to assess the link between adsorp-tion/desorption capacity and the physical properties of sediments (flocculation, particle size).
Fig. 1. (a) Saigon–Dongnai basin catchment and sampling sites along a longitudinal profile, (b) The population density distribution on the zoomed urban central districts (source: HCMC Statistical Year Book 2016). Grey arrow indicates the amplitude of upstream salt intrusion (seeTable 1for details of sampling sites).
2. Material and methods
2.1. Study area
The Saigon River, a part of the Saigon–Dongnai River basin located in Southern Vietnam, is about 250 km long with a catchment area of 4717 km2up to the confluence with the Dongnai River (Fig. 1a).
Up-stream of the Saigon River, the Dau Tieng reservoir (270 km2and 1580
× 106 m3) was constructed in 1985 for irrigation and flood
pro-tection purposes and to control the intrusion of saline water (Trieu et al., 2014). When flowing through HCMC, the Saigon River is con-nected with urban canals and further joins the Dongnai River to become the Soai Rap River flowing through the Can Gio mangrove to the South China Sea. The flow direction of the Saigon River is predominantly driven by the asymmetric semi-diurnal tides. The region falls within a tropical monsoon climate. The year is divided into two distinct seasons: the wet season from May to November and the dry season from De-cember to April. During the dry season, the net residual discharge is low (a few tens of m3s− 1) and is mainly controlled by the amount of water
released from the Dau Tieng reservoir to flush out salt intrusion. The wet season shows a slight increase of the water discharge from June to October, followed by a recession at the end of November (Nguyen et al., 2019). The mean interannual discharge calculated over the 2012–2016 period for the Saigon River (50 ± 21 m3s−1) is around one-twelfth
that of the Dongnai River (613 ± 218 m3s− 1) (Nguyen et al., 2019).
HCMC is established in a low elevation coastal zone (LECZ), along the banks of the Saigon River and belongs to a transitional area between southeastern Vietnam and the Mekong Delta (Fig. 1b). Economically, HCMC has grown rapidly over the last 10 years, so that now it is con-sidered as one of the five most dynamic cities in the world (World Economic Forum general assembly, January 2017). The population of HCMC was 8.4 million inhabitants in 2016. Less than 10% of domestic wastewater is collected and treated before being released directly into the three main urban canals (Fig. 1b) or the Saigon River (Marcotullio, 2007). Due to untreated effluents from residential and industrial areas, the Saigon River water episodically suffered severe phases of eu-trophication (e.g., high levels of nutrients – N, P and algal biomass – expressed as chlorophyll a (Chl-a) concentrations (Nguyen et al., 2019). The main wastewater treatment plant (Binh Hung WWTP) is located in district 8, south of the central urban district (Fig. 1b). Its treatment capacity is 141,000 m3day−1(426,000 inhabitants). In 2017, one
ex-tension was under construction to reach a total capacity of 469,000 m3
day−1(1,390,000 inhabitants) (source: ATLAS Ho Chi Minh City) and
construction of ten new WWTPs is planned in the next decade (Tran
Ngoc et al., 2016).
2.2. Sampling campaigns
Six surveys (two longitudinal profiles and four additional salinity gradient campaigns) were carried out during the dry season (April 2017) and the wet season (October 2017) along the Saigon River (Fig. 1).
Longitudinal profiles. Two campaigns from upstream to downstream
of HCMC were conducted to understand the spatial fluctuation of water quality along the Saigon River. The total length of the profile was 50 km, including 18 sampling points (from SG01 to SG18,Fig. 1b). These longitudinal profiles were conducted on-boat on 19th April 2017 from 8:00 a.m. to 4:30 p.m. (dry season) and on 20th October 2017 from 9:30 a.m. to 6:00 p.m. (wet season), starting at Saigon upstream (SG01) and ending at Saigon downstream (SG18) (seeFig.1b).
Salinity gradient campaigns. Four additional on-boat surveys were
conducted to determine the variability of nutrients within the salinity gradient. These 30-km-long profiles (12 sampling points, from SG07 to SG18, seeFig. 1b) were carried out on-boat on 21st and 25th April 2017 (two campaigns during the dry season) and on 23rd and 25th October 2017 (two campaigns during the wet season).
A GPS was used to geolocalize each sampling point and calculate the corresponding kilometric point (distance), in which distance = 0 (i.e., SG15, Fig. 1b, Table 1) is the confluence between the Saigon and Dongnai rivers, negative values upriver and positive downriver.
2.3. Measurement and analytical methods 2.3.1. In-situ sampling and measurements
Physicochemical parameters (depth, temperature, pH, conductivity, salinity, dissolved oxygen (DO), Chl-a and turbidity) were measured in
situ along the vertical profile using Hydrolab© DS5 Multiparameter
Probe. Each water sample was collected 0–30 cm below the surface in a 5-L polypropylene recipient for further analysis of total suspended se-diment (TSS) and Total P and dissolved P. Light penetration was mea-sured using a Secchi disk.
River bed sediment samples were taken using a sediment grab at the river bank during the two longitudinal profile campaigns to analysis P content (19th April and 20th October 2017). During the first salinity profile campaign of each season (21st April and 23rd October 2017), 30 L of surface water were taken to analyze PP in the SS at 12 sites (from SG07 to SG18). During the second salinity profile campaign of each season, 30 L of water were taken at two depths, 0–30 cm below the water surface and near the water–sediment interface to analyze PP at six sites (from SG13 to SG18).
4
2. Sediment preparation
Suspended sediment samples collected in the 30-L bottles were al-lowed to settle over 24 h. After siltation, the overlying water was si-phoned off. Wet concentrated SS and other river bed sediments were then freeze-dried, ground and sieved through a 200-μm hole size before being stored until their use for experiments, specific surface area measurement and PP analyses. The mean grain size distribution (d50) of suspended and bed sediments ranged from 23 μm to 135 μm and the specific surface area ranged from 0.07 to 0.12 m2g− 1before sonication
to 0.12–0.20 m2g− 1after sonication.
3. TSS and P measurements
In the laboratory, 5 L of samples were filtered through a GF/F
3 −
Whatman filter (porosity, 0.7 μm) to analyze PO using the acid as-corbic method (American Public Health Association, APHA, 1995). Total P was measured on unfiltered samples using the persulfate di-gestion process and the standard colorimetric method (APHA, 1995). Reproducibility for replicate measurements was better than 5% for all total and dissolved P samples. The Total P method for river water using
Name Coordinates Distance (km) Zones SG01 10°58′50″N 106°38′33″E − 4 5 Upstream
SG02 10°57′04″N 106°39′08″E − 4 1 Before dense urban area
SG03 10°55′21″N 106°39′47″E − 3 7 Possible salt intrusion during
SG04 10°54′06″N 106°41′35″E − 3 2 dry season
SG05 10°52′00″N 106°42′10″E − 2 8 SG06 10°51′07″N 106°42′16″E − 2 3
SG07 10°49′16″N 106°43′03″E − 1 8 Ho Chi Minh City Center SG08 10°48′47″N 106°43′23″E − 1 6 Wastewater release
SG09 10°47′53″N 106°43′37″E − 1 5 Salt intrusion
SG10 10°47′10″N 106°43′03″E − 1 3 SG11 10°46′28″N 106°42′33″E − 1 1 SG12 10°45′35″N 106°43′30″E − 8
SG13 10°46′16″N 106°44′54″E − 4 Downstream
SG14 10°44′51″N 106°44′44″E − 1 Confluence with Dong Nai
SG15 10°44′32″N 106°45′23″E 0 Salinity gradient
SG16 10°44′13″N 106°45′42″E 1 Estuarine zone
SG17 10°42′32″N 106°45′20″E 4 SG18 10°40′46″N 106°46′02″E 8
Table 1
Sampling sites along the longitudinal profile on the Saigon River (distance = 0 corresponds to the confluence between Saigon River and DongnaiRiver).
wet-persulfate digestion of unfiltered water samples is known to not digest completely particulate phosphorus and to underestimate the total P concentration (Zhang, 2012).
TSS (in mg L−1) was analyzed on a preweighed standard glass-fiber
filter (GF/F) through which a well-mixed sample was filtered. The re-sidue retained on the filter was dried for 24 h at 50 °C.
The total particulate phosphorus (TPP) concentration in sediments was measured using a high-temperature/HCl extraction technique (Némery and Garnier, 2007) prior to phosphate measurement using the colorimetric method (Murphy and Riley, 1962). The HCl extraction method is known to very efficiently extract the most reactive PP in-volved in environmental studies (Némery et al., 2007). To determine particulate inorganic phosphorus (PIP), the measurement was similar to the procedure for the analysis of TPP, except for the high temperature mineralization step. Particulate organic phosphorus (POP) was de-termined by subtracting the PIP concentration from the TPP con-centration ([POP] = [TPP] − [PIP], in gP kg−1).
To test the underestimation of the Total P method using persulfate digestion, dissolved organic phosphorus (in mgP L−1) was estimated by
difference between Total P in water and PO43−and the product of TPP
(gP kg−1) in suspended sediment and suspended sediment (mg L−1).
2.4. Experimental design
Experiments were conducted in a 2-L jar tank to simulate sorption processes of phosphate (PO43−) for contrasting conditions of
turbu-lence, salinity and suspended sediment concentrations. The design was close to Keyvani and Strom's design (2014). Experimental conditions were chosen to be as close as possible to natural conditions. The range of TSS was 0.25–0.90 g L−1, the range of salinity was 2.6–9.3 and range
of turbulence was 22–44s−1. Turbulence represents the hydrodynamic
shear stress induced by the tide in estuaries. The mean turbulent shear rate, G (expressed in s−1), is a quantitative measurement of turbulent
energy knowing the mean turbulent energy dissipation rate and the viscosity of the fluid (Tran et al., 2018). Our selected stirring rotation conditions, 100 rpms and 70 rpms, reproduce turbulent shears in jar test conditions of G = 44 s− 1and 22 s−1, corresponding to high to mean
shear rates, respectively, such as observed near the bottom in natural estuaries (Gratiot et al., 2017;Tran et al., 2018). To conduct the ex-periment, a representative sediment sample was selected on the basis of the analysis of the main patterns of P distribution along the longitudinal profiles. Atotal of eight environmental conditions were investigated,
4
and each time ten levels of PO 3 − were considered (Table 2). Each
4
syringe filter to determine the PO 3 − concentration. This design
spe-cifically helps evaluate whether the kinetics of P adsorption/desorption (i.e., variation of the maximum adsorption capacity of P onto SS [Pac]
and the half-saturation concentration [Kps]; see eq.(2)hereafter) was
modified by environmental conditions or remained unchanged and to what extent the degree of particle flocculation may control these ki-netics.
Another type of experiment was set up to assess specific and original physical analyses of sediment properties. The degree of particle floc-culation was evaluated in two ways: destructively, by sonication, and nondestructively, by sedimentation. The sonication technique is based on the analysis of PSD. The first PSD is determined after sampling in the jar tank, and a second one is done on the same sample, but after 2 min of sonication to break the flocs. The intercomparison of the two PSDs provides information on the content of noncohesive particles (no change in peaks and magnitude of PSDs before and after sonication) and the degree of flocculation of the cohesive particles (shift of the peak to lower particle size bands and decrease in the magnitude of PSD after sonication). According toLee et al. (2012), we can anticipate the ex-istence of different populations of particles. Flocculi (a single class of particles that corresponds to very fine silt: 8–50 μm), flocs (50–200 μm) and macro-flocs ( > 200 μm) are cohesive particles that will be, at least partially, destroyed into primary fine particles (0–8 μm) after sonica-tion; silt (2–63 μm) and sand (63 μm–2 mm) are noncohesive particles that are not affected by sonication and have virtually no effect on biogeochemistry.
To carry out this destructive test, we used a LISST Portable XR in-strument from Sequoia©. The principle of its operation is based on laser diffraction. This instrument provides a semi-log distribution of the vo-lumetric concentration of particles over a 44-band spectrum from 0.4 to 460 μm.
Further, the sedimentation technique was carried out using the System for the Characterization of Aggregates and Flocs (SCAF), which was recently developed in our laboratory (Gratiot et al., 2015). SCAF consists of an optical settling column, equipped with a vertical array of 16 turbidity sensors to provide light transmission through a suspension during quiescent settling. With SCAF, the particle flocculation index is obtained as the ratio between settling velocities measured in the upper part and near the bottom of the SCAF settling tube (Wendling et al., 2015). For a solution of noncohesive particles, the settling velocity
Conditions SS (g
L− 1) Turbulence (s
− 1) Salinity PO43 − added (mgP L− 1) as
KH2PO4
remains constant in the SCAF and the flocculation index is close to zero. For a solution with cohesive particles, flocculation enhances
sedi-C1 0.5 44 2.7 0, 0.05, 0.1, 0.2, 0.5, 0.75, mentation and the flocculation index increases. A flocculation index C2 0.5 22 2.7 1.0, 1.5, 2.0 and 3.0
C3 0.25 44 2.6 tion has doubled during sedimentation in the 16-cm-high SCAF settling
C4 0.25 22 2.6 tube. For further detail on the characterization of hydrodynamics and
C5 0.5 44 9.3 floc properties in the jar test, one can refer toGratiot et al. (2017).
C6 0.5 22 9.3 C7 0.9 44 2.7 C8 0.9 22 2.7
equaling 1 means that the average settling velocity of the floc popula-duplicate jar test was stirred for 4 h in the lab under 26 °C air
con-ditioning stable temperature (Fig. 2). First, preliminary tests showed that 4 h of stirring was long enough to reach steady-state equilibrium between particulate and dissolved P. The full set of experiments totaled 160 individual jar tests (80 duplicates). To conduct these experiments, hundreds of liters of Saigon River water were sampled during field surveys and the water was allowed to settle for 24 h to remove sus-pended sediment and to be used as a medium. The field sample was then filtered through the GF/F filter (porosity, 0.7 μm) to remove the
Table 2
Phosphorus adsorption/desorption experimental conditions.
remaining suspended particles and stored in a cool room until used for experiments.
For these experiments, Total P in water was 0.032 ± 0.006 mgP L−1. We hypothesized that dissolved phosphorus is mainly present as
PO43−form (0.024 ± 0.008 mgP L−1), and we considered dissolved
organic phosphorus (DOP) as a negligible part of total dissolved phos-phorus in our medium (DOP, 0.003–0.004 mgP L−1, 9–12% of Total P).
Phosphate solutions (KH2PO4) were prepared for ten different
con-centrations with demineralized water (from 0 to 3.0 mgP L−1; see
Table 1) before they were successively added to the jar test. A gradually increased mass of sediment, obtained from oven-dried samples, was added to these jar tests to reach suspended sediment concentrations of SS = 0.25, 0.50 and 0.90 g L−1. One drop of pure chloroform was
added to all the samples to stop any possible biological activity during the experiment (Aissa-Grouz et al., 2016). After 4 h of stirring in the jar tank, the solutions were filtered through a 0.45-μm porosity Millex
2.5. Sorption isotherm
Langmuir isotherm was used to evaluate the adsorption and deso-rption of P onto sediment (Wang and Li, 2010;Rossi et al., 2012;Vilmin et al., 2015; Aissa-Grouz et al., 2016); the adsorbed P onto SS is de-scribed by: = P × [SS] [DIP] + [PIP] [DIP] K ac ps (1)
PIP is particulate inorganic phosphorus (mgP g−1); SS is suspended 4
sediment concentration (mg L−1); DIP is PO 3 − concentration (mgP
L−1); P
acis the maximum adsorption capacity of P onto SS (mgP g− 1);
Kpsis the half-saturation concentration of PO43−(mgP L−1). The
con-centration of PIP can be estimated by subtracting DIP from the content of total phosphorus (TIP) in the water (PIP = TIP − DIP). Replacing the TIP value in the above equation, the DIP concentration can be deduced by the following equation:
= DIP (−TIP + P × SS + K ) + 4 × TIP × K 2 TIP − Pac × SS − Kps+ a c ps2 ps (2) Phosphorus sorption isotherms are used to identify the capacity of sediment to sorb P and also to compare the sorption capacity for the different experimental conditions. The two parameters (Pacand Kps) of
the Langmuir isotherm were determined by fitting relation (2) to the measured DIP vs TIP, using the least square deviation criterion ( Aissa-Grouz et al., 2016). Anexample of the result is shown inFig. 7a and d. 3. Results
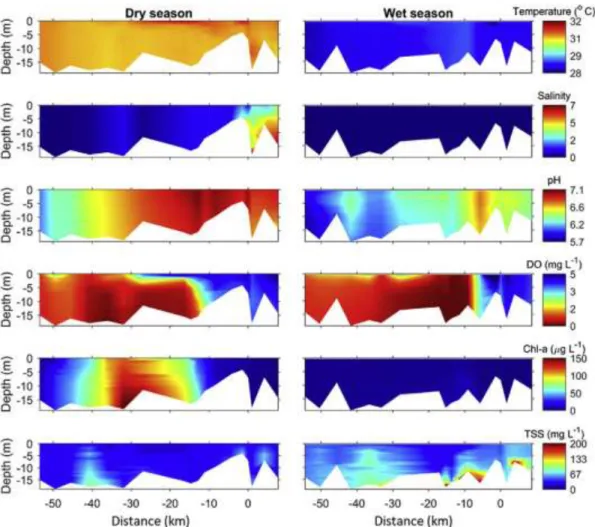
3.1. Physicochemical parameter distribution along the Saigon River
The Saigon River depth fluctuates between 5 and 18 m with a deeper channel in the upstream section and a shallower channel at the confluence between the Saigon and Dongnai Rivers. Onthe whole, the
homogeneous within the water column except toward the confluence, where a near-bottom stratification of TSS developed (Fig. 3). The water
temperature was stable along the Saigon River, averaging
31.1 ± 0.1 °C and 28.6 ± 0.2 °C during the dry season and the wet season, respectively. Dissolved oxygen (DO) values varied between moderate to severe hypoxic conditions (as low as 0.5 mg L− 1in the
upstream stretch of HCMC and rose up to 4.7 mg L− 1in the downstream
stretch). During the wet season, the DO level increased rapidly from an extremely low concentration upstream of HCMC (distance −10 km, SG11 with DO value below 2 mg L−1) to a higher value downstream
(distance 1 km, SG16, with the DO value above 4 mg L−1). pH values in
both wet and dry seasons ranged from 5.7 to 7.1, meaning that the Saigon River water is characterized by slightly acidic water, which is in good agreement with a previous study that highlighted the role of acidic soils to explain such low pH values (Strady et al., 2017). Con-sequently, carbonates are assumed to be low. Saline water intrusion during the dry season was observed up to distance −40 km. Salinity was zero during the wet season along the Saigon River (Fig. 3). The
Chl-a concentrChl-ation wChl-as cleChl-arly higher Chl-at HCMC Center (from 8.8 μg L−1at
the surface at distance −18 km to 150 μg L−1at distance −8 km)
during the dry season) than upstream (distance −4 5 km to −2 3 km) and downstream (distance −4 km to 8 km) of HCMC. The magnitude of TSS fluctuations was lower during the dry season (from 16 mg L− 1to
38 mg L− 1near the surface and from 23 mg L− 1to 95 mg L−1near the
bottom) than during the wet season (from 24 mg L− 1to 67 mg L−1near
the surface and from 31 mg L− 1to 297 mg L− 1near the bottom) (Fig.
3). This can be due to the seasonality of discharge of the Saigon River that can be four fold higher in the wet season (120 m3s− 1) than in the
dry season (30 m3s− 1) (Nguyen et al., 2019).
3.2. Phosphorus levels along the Saigon River
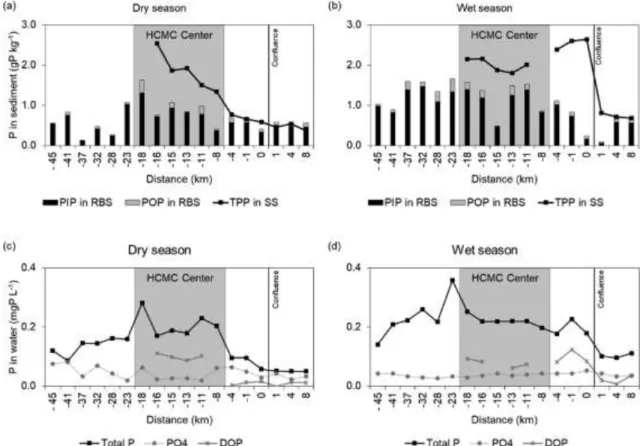
River bed sediment. Throughout the two seasonal surveys, TPP and
PIP, respectively, averaged 0.7 ± 0.4 and 0.6 ± 0.3 gP kg−1during
the dry season and 1.1 ± 0.5 and 0.9 ± 0.4 gP kg−1during the wet
season (Fig. 4a and b, respectively). For all sampling sites, the PIP fraction dominates TPP and accounted for 88 ± 7% for both wet and
Fig. 2. (a and b) Experimental designs, (c) the portable granulometer of the LISST XR system and (d) system for aggregate and floc characterization (SCAF, Gratiot et al., 2015).
Suspended sediment. TPP contents ranged from 0.4 to 2.5 gP kg−1
during the dry season (Fig. 4a) and from 0.7 to 2.6 gP kg−1during the
wet season (Fig. 4b). P in SS decreases from upstream to downstream, especially during the dryseason.
Water column. Total P increased from 0.12 mgP L− 1in upstream to
0.28 mg P L− 1in the city center and decreased again to 0.05 mg P L−1
in the downstream sector of HCMC during the dry season (Fig. 4c). During the wet season. Total P was high in upstream and in the urban center of HCMC (0.23 ± 0.03 mgP L− 1 on average from distance
−1 8 km to distance −8 km), and decreased after the confluence be-tween the Saigon and the Dongnai River down to 0.09 mgP L− 1on
average (Fig. 4d). Total P was higher in mean during the wet season in comparison to the dry season of 2017: 0.20 ± 0.07 and 0.14 ± 0.06 mgP L−1, respectively. While the proportion of PP varied substantially
along the Saigon River (from 6.4 to 87.7%) during the dry season, PP in Total P was systematically higher than 45% during the wet season. These high percentages of PP are the result of high P adsorption onto the sediment and show a propensity for possible desorption of P downstream. DOP concentrations dropped from 0.1 ± 0.01 mgP L− 1
in city center to 0.01 ± 0.001 mgP L− 1in the downstream during the
dry season and from 0.08 ± 0.01 mgP L− 1to 0.02 ± 0.01 mgP L−1
during the wet season (Fig. 4c and d). Note that some estimations of DOP were not possible due to possible underestimation of Total P using the persulfate digestionmethod (see method section).
3.3. Phosphorus distribution in the salinity gradient
dissolved phosphorus concentrations within the salinity gradient, which expressed the transformation (adsorption or desorption) of dis-solved phosphorus during the mixing of fresh water and salt water throughout the estuary. Because we did not observe the salinity gra-dient (salinity 0) during the wet season, we show data only during the dry season. We clearly observed that the TPP content in SS decreased within the salinity gradient, from 2.54 gP kg−1(for salinity below 1) to
0.48 gP kg−1(for salinity up to 8) (Fig. 5a). The decrease in the TPP
content in SS resulted mainly from a decrease in the PIP concentration (from 1.5 gP kg−1at salinity below 1 to 0.4 gP kg−1at salinity up to 8,
while POP remained stable (0.2 ± 0.1 gP kg−1) (Fig. 5b).
Conse-quently, the PIP/POP ratio averaged 4.4 for salinity lower than 1 and decreased to a value close to 2.6 for the maximum salinity observed (Fig. 5c). Such PIP behavior could reflect a desorption of P from SS, in order to equilibrate the PO43−concentrations in the river water, diluted
4
by seawater that is poorer in P, as shown in the PO 3 − profiles within
the salinity gradient (Fig. 5d).
3.4. Phosphorus adsorption capacity onto sediment from laboratory experiments
Phosphorus level. The selected sediment was sampled in the
down-stream part (at SG13; distance −4 km, seeFig. 1b) where P transfor-mations were evidenced between salinity 0.6 and 8.0 during the dry season survey. The initial P content of sample SG07 was 0.81 and 0.90 gP kg−1for PIP and TPP, respectively. The change in P sorption
ca-pacity onto suspended sediment was linked to the levels of P added.
Fig. 3. Temperature, salinity, pH, dissolved oxygen (DO), chlorophyll a (Chl-a) and total suspended sediment (TSS) variations from upstream to downstream of HCMC during the dry season (April 2017) and the wet season (October 2017).
3 −
Fig. 4. (a and b) Particulate phosphorus in river bed sediment (RBS) and suspended sediment (SS); (c and d) Total P, PO4 and DOP concentrations in the water column during the dry season and the wet season. The vertical line indicates the confluence with the Dongnai River. No TPP in SS data are available from distance −45km to −18km. DOP data were collected from HCMC Center to the downstream area, missing data are due to underestimation of Total P in water.
3 − Fig. 5. (a) Distribution of total particulate phosphorus in suspended sediments, (b) distribution of particulate phosphorus, (c) PIP/POP ratios and (d) PO4
sediments in the treatments with no P added (%DIP adsorbed < 0), at P added concentrations greater than 0.1 mgP L−1, P was adsorbed (%
DIP adsorbed > 0) (Fig. 6). The adsorption capacity was high for a low concentration of added P. At a low concentration of additional P ( < 0.1 mgP L−1), the amounts of P adsorbed varied between 0.062 gP kg−1
and 0.064 gP kg−1(i.e., 15.5% and 64.1% P added). However, the
amounts of P adsorbed were 0.109 gP kg−1to 0.520 gP kg−1(i.e., 0.9–
15.6% P added) at the highest P added concentration (3.0 mgP L− 1)
(Fig. 6). This shows that (i) a greater proportion of the added P is adsorbed at low P concentrations and (ii) the reduction of this pro-portion is related to the increase of additional P.
We also observed that when SS increased from 0.25 to
0.5–0.9 g L−1, the percentage of P added adsorbed onto SS increased
from 13 to 36–58% at low P added ( < 0.1 mgP L−1) to 1–8 – 16% at the
highest amount of P added (3.0 mgP L−1), respectively (Fig. 6).
For all experimentally tested environmental conditions (SS,
turbu-4
lence, salinity), TIP increased rapidly with the additional PO 3 −and
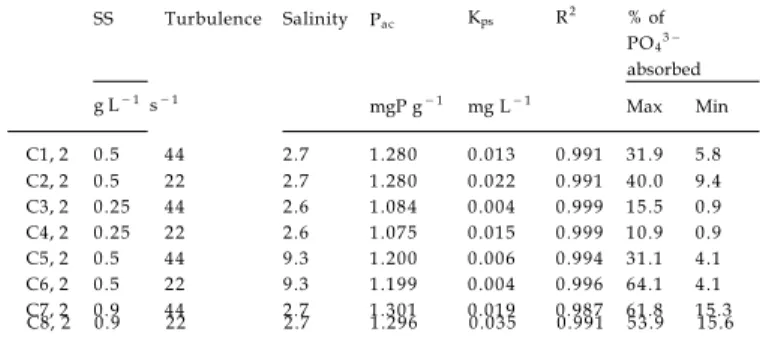
then reached a plateau; the sorption of P was typical of Langmuir iso-therm curves (Fig. 7a and d). The fitting of experimental points to the
Langmuir isotherm equation was good (R2higher than 0.98), allowing
examination of the variation of Pacand Kpsfor all environmental
con-ditions considered (Table 3). The maximum adsorption of P onto SS (Pac) and the half-saturation concentration of PO43−(Kps) ranged from
1.075 to 1.301 gP kg−1and from 0.004 to 0.035 mgP L−1, respectively.
The evolution of sorption parameters with turbulence (22 s− 1 and
44 s− 1) for three gradually increased values of the SS concentration (SS
represented by bars inFig. 7b and c) demonstrated a positive influence of SS on sorption capacity (Pacincreased by nearly 20% when SS
in-creased, with no effect according to the intensity of turbulence (Fig. 7b). From the Pacand Kpsvalues presented inTable 3, SS was the main
factor driving the adsorption capacity. For example, Pacand Kpsvalues
increased from 1.084 to 1.301 mgP gSS−1and 0.004 to 0.109 mgP
L−1, respectively, within the range of SS (0.25–0.9 g L−1).
However, the increasing turbulence decreased the half-saturation content for all SSs tested (Fig. 7c). Indeed, Kps increased gradually as SS
rose but decreased from 0.013 to 0.022 mgP L− 1 as turbulence
de-creased from 22 s− 1 to 44 s− 1 (see conditions C1 and C2 inTable 2).
Regarding the effect of salinity, the maximum sorption capacity Pac
4
Fig. 6. The percentage of PO 3 − adsorbed onto suspended sediments (SS) at different environmental conditions (see Table 1for C1–C8 conditions). Sedi-ment was sampled at site SG13 during the dry season (25th April 2017).
Fig. 7. (a) and (d) Kinetics of sorption of phosphorus and (b), (c), (e) and (f) the sorption parameters (Pac, Kps) for all environmental conditions tested. Thecorrelation coefficient (R2) for each parameter determination is shown inTable 3.
SS Turbulence Salinity Pac Kps R2 % of PO43 − absorbed g L− 1s− 1 mgP g− 1 mg L− 1 Max Min C1, 2 0.5 44 2.7 1.280 0.013 0.991 31.9 5.8 C2, 2 0.5 22 2.7 1.280 0.022 0.991 40.0 9.4 C3, 2 0.25 44 2.6 1.084 0.004 0.999 15.5 0.9 C4, 2 0.25 22 2.6 1.075 0.015 0.999 10.9 0.9 C5, 2 0.5 44 9.3 1.200 0.006 0.994 31.1 4.1 C6, 2 0.5 22 9.3 1.199 0.004 0.996 64.1 4.1 C7, 2 0.9 44 2.7 1.301 0.019 0.987 61.8 15.3 Table 3
Maximum adsorption capacity of phosphorus onto suspended sediment (Pac), 4 ps
half-saturation concentration of PO 3 − (K ), correlation coefficient (R2) of the 4
fitting and the percentage of PO 3 − absorbed onto SS with the different ex-perimental conditions (in first column: C1, number of samples for each treat-ment).
decreased at higher salinity, as did the two turbulence levels (Fig. 7e). The Kpsvalue was lower for high salinity, and lower at higher
turbu-lence levels (Fig. 7f). For example, at turbulence 44 s−1, Pacand Kps
decreased as salinity lowered, respectively from 1.280 to 1.199 mgP gSS−1and from 0.013 to 0.004 mgP L− 1when salinity increased from
2.7 to 9.3.
To summarize, our experimental set-up showed a predominant ef-fect of SS on sorption processes followed by salinity and then turbu-lence, which modified only the half saturationconstant.
3.5. Physical characteristics of sediments
A first analysis of the PSDs confirmed the presence of both cohesive and noncohesive sediments. The vast majority of particles (55–95% in volume) were cohesive sediments, which are partially or almost com-pletely disaggregated after 2 min of sonication. Conversely, the non-cohesive particles (i.e., no sonication effect: silt, sand and others) only accounted for 5–45% (by volume concentration) of the particle popu-lation, without any evident trend between trials C1–C8. These macro-particles (larger than 200 μm) form a population that is assumed to be poorly active in sorption processes, contrary to the cohesive ones.Fig. 8 summarizes the results for cohesive particle populations.
Whatever trial is considered (C1–C8), the flocculi population pre-dominates. It corresponds to 44–54% of the samples while primary particles and flocs correspond to 17–38% and 10–35% of the volumetric concentration, respectively. The large predominance (65–90%) of the smallest particles implies that sediments of the Saigon River stay in suspension in the water column for a very long time, have a high spe-cific surface (a key parameter for biogeochemical processes) and will deposit only at very low flow conditions.
After sonication, 75% of the floc population and 40% of flocculi were broken. The intercomparison of the volumetric concentration of primary particles before (∼25%) and after (∼60%) sonication shows that they are highly mobile and directly flocculate on both flocculi and flocs.
Concerning the flocculation under the nondestructive sedimentation technique, the pattern showed a clear and gradual increase of the flocculation index (FI) as the SS concentration increased, which dou-bled from FI = 0.4–0.8 when SS rose from 0.25 to 0.9 g L− 1(Fig. 9).
Salinity also favored flocculation but in a less efficient way (FI in-creased by 20%). The turbulence level existing in the jar test before putting the particles in the SCAF settling tube did not affect floccula-tion.
4. Discussion
4.1. The effect of physical characteristics of sediment on P adsorption capacity
The capacity of SS to sorb P is originally assessed in this paper, by combining field measurements, sorption experiments, Langmuir iso-therm and the examination of physical characteristics of sediment. The values of Pacranged from 1.07 to 1.30 gP kg−1in the Saigon River. This
Pacvalue is lower than those in the sediments of Mai Po Marshes in
Hong Kong (from 1.64 to 3.58 gP kg−1), which have been attributed to
the availability of abundant amorphous Fe, Al and organic matter (Lai and Lam, 2008). In contrast, Pacin the Saigon River was higher than in
sediment of Indian River Lagoon, Florida (from 0.032 gP kg−1under
anaerobic conditions to 0.132 gP kg−1under aerobic conditions;Pant
and Reddy, 2001), Kissimmee River wetlands (0.011–0.826 gP kg−1;
Reddy et al., 1998) and within the same range of values found in the Seine River with an impact of the release of treated wastewaters ( Aissa-Grouz et al., 2016). A higher value was associated with the high con-centration of SS.
In the Saigon River, the higher Pacvalues obtained at low salinity
rather than at high salinity evidenced higher P adsorption capacity on SS in less saline than in more saline water (Zhang and Huang, 2011). In addition to greater competition between anions, increasing salinity beyond a threshold value may lead to decreased positive charges of metal hydroxides in SS and inhibiting P sorption (Barrow et al., 1980). The change of turbulence, from 22 s− 1to 44 s−1, typical of natural
estuaries (Marion et al., 2016), did not affect Pacvalues, which
re-mained stable. The particle concentration effect (i.e., the change in the adsorption isotherm in response to changing particle concentrations)
4
could explain PO 3 − desorption in the salinity gradients.
As described above, the SS concentration controls the flocculation of cohesive sediments. The change in the flocculation index with in-creasing SS can thus explain the higher P content in SS. This means that sediment dynamics could be one of the main drivers of the fate of P in the Saigon River estuary.
4.2. Impact of HCMC on Pconcentrations
All the samples collected within the salinity gradient campaigns during the dry and wet seasons in 2017 made it possible to analyze the P content in SS for two vertical distributions: the surface and the bottom of the water column (Table 4). Adifference in P content (TPP, PIP and
Fig. 8. Variation of the volumetric concentration of particles (primary < 8 μm, flocculi [8–50 μm] and flocs [50–200 μm]) with TSS, for experiments C1–C8 (see
Table 2).
suspended sediment samples (e.g., higher values in surface samples in comparison to bottom samples during the wet season: 1.45 ± 0.77 and 1.03 ± 0.39 mgP kg−1, respectively). This result would indicate that
the adsorption/desorption of P occurred principally within the water column.
During both 2017 season surveys, a reduction of the TPP con-centration in SS from the HCMC Center (distance −1 8 to −8 km) to the downstream section was observed, more during the dry than the wet season. During the dry season, this can be explained by the fact that the increasing salinity downstream of HCMC (distance −4 to 8 km) re-sulted in greater competition among anions for positively charged binding sites due to the increase in sulfate and chloride in tidal waters (Stumm and Morgan, 1981;Millero et al., 2001). We also observed that the amount of P sorbed onto bottom sediments decreased toward the saltwater end of the gradient (as reported bySundareshwar and James, 1999). These results were also reported byBerner and Rao (1994)with a significant decrease of TPP within the salinity gradient in the Amazon River.
Similar to TPP, PIP in SS was also lower during the dry season than during the wet season (Table 4). The same trend was observed with Total P in waters. This may be related to the flushing of sediment with high P content from urban canals of HCMC during the wet season; a similar hypothesis of high flushing in the beginning of the wet season was recently proposed byBabut et al. (2019). It is also shown that
during the dry season P was largely taken up by algae, especially be-tween distance −40 and −10 km where Chl-a concentrations increased up to 150 μg L− 1(Fig. 4). The eutrophication of the Saigon River was
clearly observed in a previous study, which also identified P among other key nutrients (nitrogen and silica) as the main limiting factor of algal growth (Nguyen et al., 2019).
Based on seasonal monitoring over more than two years, this study also identified the river reach between the distance −40 and −10 km to be highly productive during the dry season, as shown by phyto-plankton biomass, contrary to the downstream sector. In this productive river section, the dry season offers the best light availability conditions (full sun and double the light penetration, > 60 cm, than downstream). The tide fluctuation and the confluence with the large Dongnai River, which can generate a hydraulic barrier, explains the trapping of the urban water body, which is the most contaminated by urban inputs (Nguyen et al., 2019). Phosphorus would therefore be largely taken up in this part of the river during the dry season. In addition, P content in bed sediments, which were higher in the dry season at HCMC Center (Fig. 4a), could result from the deposition of dead microalgae, rich in P and highly biodegradable. The extremely low DO values observed in the dry season support the assumption of high organic matter mineraliza-tion. By dividing the Saigon River into three sections (upstream: dis-tance −45 to −23 km; HCMC Center: disdis-tance −18 to −8 km; downstream: distance −4 to 8 km), we can assess the impact of
Fig. 9. Effect of suspended sediment concentration and salinity on flocs and flocculation index at different experimental conditions.
1
Number of samples TPP (gP kg− 1) PIP (gP kg− 1) POP (gP kg− 1)
Dry season (April 2017) Suspended sediment
Surface (upper layer) 18 1.14 (0.73) 0.77 (0.47) 0.24 (0.14) Bottom (lower layer) 7 0.72 (0.20) 0.60 (0.17) 0.12 (0.05)
All samples 25 0.98 (0.61) 0.70 (0.37) 0.19 (0.12)
River bed sediment
Upstream 6 0.56 (0.35) 0.52 (0.33) 0.04 (0.03) HCMC Center 6 0.95 (0.41) 0.82 (0.31) 0.12 (0.12) Downstream 6 0.59 (0.11) 0.48 (0.09) 0.10 (0.02)
Wet season (October 2017) Suspended sediment
Surface (upper layer) 18 1.80 (0.73) 1.34 (0.61) 0.46 (0.18) Bottom (lower layer) 7 1.16 (0.50) 0.88 (0.41) 0.28 (0.13)
All samples 25 1.55 (0.71) 1.16 (0.57) 0.39 (0.18)
River bed sediment
Upstream 6 1.35 (0.33) 1.18 (0.26) 0.17 (0.11) HCMC Center 6 1.22 (0.44) 1.09 (0.36) 0.13 (0.09) Downstream 6 0.60 (0.38) 0.52 (0.36) 0.08 (0.03)
Table 4
Mean ( ± SD) of total particulate phosphorus (TPP), particulate inorganic phosphorus (PIP) and particulate organic phosphorus (POP) content in suspended sedi-ments (SS) during both the dry season (April 2017) and the wet season (October 2017).
urbanization on the P content variability in the sediment along the Saigon River (Table 4). River bed sediments in the HCMC Center were characterized by high TPP and PIP contents during both dry and wet seasons, resulting in a P enrichment from untreated domestic waste-water discharges (Nguyen et al., 2019). We assume that this
highen-4
richment is due to the PO 3 − adsorption from wastewater discharge,
which was also reported as a typical process byNémery and Garnier (2007) from a study conducted in the Seine River. The effect of high residence time of water and particles due to low net discharge and the effect of high water mixing by tides can also lead to high potential retention of P. This is particularly the case in the urban canals, which were under contaminated conditions by the release of untreated was-tewater, as in the Nhue River, near Hanoi (Trinh et al., 2009). High
4
concentrations of PO 3 − in water and TPP in sediment were observed in
urban canals (Strady et al., 2017), indicating an intense adsorption process of dissolved P onto sediment. This kind of accumulation in the sediment was also evidenced in the urban canals of Bangkok (Thailand), which presents geography, demography and wastewater management characteristics similar to our case study (Færge et al., 2001). It ap-peared that Total P in water is mainly composed of the particulate fraction, making up 73 ± 20% (n = 98 samples). The PIP fraction generally dominated in the suspended sediment column as well as in the bottom sediment of the river (i.e., 75.8 ± 8% of TPP values). POP accounted for a small fraction (less than 25%) of the TPP. The POP proportion in SS was within the same range (25 ± 6% at both the HCMC Center and downstream of HCMC), which indicated that the TPP decrease was due to the PIP decrease. The stability of POP content in-dicated that the TPP decrease stems from the PIP decrease. The high variability of TPP is more related to that of PIP than to the variability of POP. The PIP/POP ratio fluctuates according to the PIP variations.
4.3. Implications for the understanding of P dynamics within estuaries
Sediment plays an important role in the adsorption/desorption of P in estuaries (Zhang et al., 2004). The reactivity of particles with respect to P therefore depends on estuarine hydrodynamics and more precisely on the variation of the sediment's physical properties (Statham, 2012). For the case study of the Saigon River, we hypothesize that the decrease in P concentration in the sector downstream of HCMC was due to (i) PIP desorption within the salinity gradient with respect to the changes in the physical characteristics of sediments and (ii) dilution by water with a low P concentration coming from the mixed waters from the Dongnai River.
Our experimental results showed here that SS concentrations played an important role in the sorption capacity of P onto sediments. Sedimentary dynamics in estuaries (especially mechanisms that control the flocculation of cohesive sediments) is indeed influenced by both the salinity gradient and the turbulence level (Keyvani and Strom, 2014). These two variables are governed by tidal cycles and seasonal varia-tions in water flows that are highly contrasted in Vietnam's tropical climate (Lefebvre et al., 2012; Mari et al., 2012). The change in the flocculation index with increasing TSS, especially in the wet season as observed in the present study (Fig. 7b), can thus explain the higher P content in TSS at that time (Fig. 4b). This means that sediment dy-namics could be one of the main drivers of the fate of P in the Saigon River estuary. Indeed, flocculation is a process of aggregation and breakup of cohesive particles within the water column under changes of hydrodynamic and sedimentary conditions. Our results showed that flocculation increased as TSS concentrations rose, within a higher range than with salinity or turbulence. Flocculation modifies the specific surface of sediment, as observed in our measurements. P adsorption is thus directly influenced by the capacity of sediment to flocculate and flocculation kinetics are thus a key factor in explaining the fate of P in estuaries.
Moreover, the decrease of P content downstream could also stem from the dilution effect by water with a low P concentration coming
4
stable PO 3 − concentration in low salinity (0–4) and a decrease of the
PO43− concentration in high salinity ( > 4). At low salinity, the PIP 4
desorption process, which resulted in an increase of PO 3 −
concentra-tions in the water column, was stronger than the dilution effect by water with a low P concentration coming from the Dongnai River. Both
4
waters created a stable zone of PO 3 − concentration in low salinity
(0–4). By contrast at high salinity, P desorption greatly increased (see the decrease in Pac). This means that the dilution by water from the
Dongnai River was stronger than the PIP desorption process. This led to
4
a decrease in PO 3 − concentration at high salinity ( > 4, see Fig. 5d).
The Saigon River suffers from eutrophication in its medium section, which is a logical response to untreated wastewater discharges (Nguyen et al., 2019). However, sediment dynamics appear to effectively buffer excess phosphorus concentrations, particularly through flocculation and sediment adsorption capacity. To this is added a strong dilution capacity by the main confluence (the Dongnai River). Also the Saigon River estuary seems to be spared the impact of untreated wastewater discharges from HCMC (low algal development, good oxygenation, lower P levels). This situation is rather unusual compared to estuaries subjected to the same anthropogenic pressures (Flemer and Champ, 2006) and indicates the great potential for the metabolizing power of these tropicalestuaries.
5. Conclusions
The P concentration in HCMC's center was about three times higher than upstream and downstream of HCMC. PIP accounted for 80% of TPP, as a result of adsorption of PO43−released by untreated
waste-water discharges. Our results illustrated the strong influence of SS concentrations on flocculation and on the P adsorption onto sediment, e.g., P adsorption capacity (Pac) and adsorption velocity (Kps) increased
when SS concentrations rose followed by salinity. In contrast, turbu-lence modified the adsorption properties of sediment very slightly. The Saigon River estuary appeared to be a very reactive biogeochemical system, which is able to metabolize a major proportion of P emitted by the HCMC megacity. The downstream part of the estuary seems to be slightly affected by urban discharges, not only due to high P processing upstream, but also because of a dilution effect with the Dongnai River at the confluence. The downstream part of the estuary seems to be slightly affected by the urban discharges, due to both positive interac-tions between P and sediment and because of a dilution effect with the Dongnai River at the confluence.
Acknowledgements
This study was conducted at the CARE-RESCIF laboratory and funded by the CMIRA “Saigon River: la ville et fleuve” Region Auvergne Rhone Alpes project and by the EC2CO Bioheffect Structurante Initiative. We acknowledge the Center Asiatique de Recherche sur l’Eau (CARE-HCMC) for providing technical measurements. Thanks are due to two anonymous reviewers for their constructive suggestions.
Appendix A. Supplementary data
Supplementary data to this article can be found online at https:// doi.org/10.1016/j.ecss.2019.106321.
from the Dongnai River.Nguyen et al. (2019)observed that the mean annual discharge in the Dongnai River was 12 times higher than in the Saigon River, while the mean annual Total P concentration was about 0.09 ± 0.05 mgP L− 1in the Dongnai River, lower than in the Saigon
River (0.30 ± 0.20 mgP L−1). Dilution from the Dongnai River
sup-ported the second hypothesis and showed that the confluence between the two rivers may play an important role in the P dynamics within the estuary.
Within the salinity gradient, we can divide P dynamics into two phases based on the PO43 −concentration (presented inFig. 5d): a
1
References
Aissa-Grouz, N., Garnier, J., Billen, G., 2016. Long trend reduction of phosphorus was-tewater loading in the Seine: determination of phosphorus speciation and sorption for modeling algal growth. Environ. Sci. Pollut. Res. 25 (24), 23515–23528. https://doi. org/10.1007/s11356-016-7555-7.
APHA, 1995. Standard Methods for the Examination for Water and Wastewater, nine-teenth ed. American Public Health Association, Inc., New York.
Babut, M., Mourier, B., Desmet, M., Labadie, P., Budzinski, H., De Alencastro, F., Tu, T.A., Strady, E., Gratiot, N., 2019. Where has the pollution gone? A survey of organic contaminants in Ho Chi Minh City/Saigon river (Vietnam) bed sediments. Chemosphere 217, 261–269.https://doi.org/10.1016/j.chemosphere.2018.11.008. Barrow, N.J., Bowden, J.W., Posner, A.M., Quirk, J.P., 1980. Describing the effects of
electrolyte on adsorption of phosphate by a variable charge surface. Aust. J. Soil Res. 18, 395–404.https://doi.org/10.1071/SR9800395.
Berner, R.A., Rao, J.L., 1994. Phosphorus in sediments of the Amazon River and estuary: implications for the global flux of phosphorus to the sea. Geochem. Cosmochim. Acta 58, 2333–2339.https://doi.org/10.1016/0016-7037(94)90014-0.
Borggaard, O.K., Raben-Lange, B., Gimsing, A.L., Strobel, B.W., 2005. Influence of humic substances on phosphate adsorption by aluminium and iron oxides. Geoderma 127, 270–279.https://doi.org/10.1016/j.geoderma.2004.12.011.
Bruland, G.L., DeMent, G., 2009. Phosphorus sorption dynamics of Hawaii's coastal wetlands. Estuar. Coasts 32, 844–854.
Camargo, J.A., Alonso, Á., de la Puente, M., 2005. Eutrophication downstream from small reservoirs in Mountain Rivers of Central Spain. Water Res. 39, 3376–3384.https:// doi.org/10.1016/j.watres.2005.05.048.
Conley, D.J., Smith, W.M., Cornwell, J.C., Fisher, T.R., 1995. Transformation of particle-bound phosphorus at the land-sea interface. Estuar. Coast Shelf Sci. 40, 161–176.
https://doi.org/10.1016/S0272-7714(05)80003-4.
Craft, C.B., Richardson, C.J., 1993. Peat accretion and phosphorus accumulation along a eutrophication gradient in the northern Everglades. Biogeochemistry 22, 133–156.
https://doi.org/10.1007/BF00002708.
Flemer, D.A., Champ, M.A., 2006. What is the future of estuaries given nutrient over-enrichment, freshwater diversion and low flows? Mar. Pollut. Bull. 52, 247–258.
https://doi.org/10.1016/j.marpolbul.2005.11.027.
Froelich, P.N., 1988. Kinetic control of dissolved phosphate in natural rivers and Estuaries : a primer on the phosphate buffer mechanism. Limnol. Oceanogr. 33, 649–668.https://doi.org/10.4319/lo.1988.33.4part2.0649.
Færge, J., Magid, J., Penning de Vries Frits, W.T., 2001. Urban nutrient balance for Bangkok. Ecol. Model. 139, 63–74.https://doi.org/10.1016/S0304-3800(01) 00233-2.
Gratiot, N., Coulaud, C., Legout, C., Mercier, B., Mora, H., Wendling, V., 2015. Unit for Measuring the Falling Speed of Particles in Suspension in a Fluid and Device Comprising at Least One Measuring Unit and One Automatic Sampler.
Patent-Publication number WO2015055963 A1.
Gratiot, N., Bildstein, A., Anh, T.T., Thoss, H., Denis, H., Michallet, H., Apel, H., 2017. Sediment flocculation in the Mekong River estuary, Vietnam; an important driver of geomorphological changes. Compt. Rendus Geosci. 349, 260–268. https://doi.org/ 10.1016/j.crte.2017.09.012.
Guo, L., Zhang, J., Gueguen, C., 2004. Speciation and fluxes of nutrients (N, P, Si) from the upper Yukon River. Glob. Biogeochem. Cycles 18, GB1038.
Heathwaite, A.L., Johnes, P.J., 1998. Contribution of nitrogen species and phosphorus fractions to stream water quality in agricultural catchments. Hydrol. Process. 10, 971–983. https://doi.org/10.1002/(SICI)1099-1085(199607)10:7<971::AID-HYP351>3.0.
Hinkle, M.A.G., Wang, Z., Giammar, D.E., Catalano, J.G., 2015. Interaction of Fe(II) with phosphate and sulfate on iron oxide surfaces. Geochem. Cosmochim. Acta 158, 130– 146.https://doi.org/10.1016/j.gca.2015.02.030.
House, W.A., Donaldson, L., 1986. Adsorption and coprecipitation of phosphate on cal-cite. J. Colloid Interface Sci. 112, 309–324. https://doi.org/10.1016/0021-9797(86) 90101-3.
Jordan, T.E., Cornwell, J.C., Boynton, W.R., Anderson, J.T., Cornwell, C., 2008. Changes in phosphorus biogeochemistry along an estuarine salinity gradient : the iron con-veyer belt. Limnol. Oceanogr. 53, 172–184. https://doi.org/10.4319/lo.2008.53.1. 0172.
Keyvani, A., Strom, K., 2014. Influence of cycles of high and low turbulent shear on the growth rate and equilibrium size of mud flocs. Mar. Chem. 354, 1–14. https://doi. org/10.1016/j.margeo.2014.04.010.
Kim, L.-H., Choi, E., Stenstrom, M.K., 2003. Sediment characteristics, phosphorus types and phosphorus release rates between river and lake sediments. Chemosphere 50, 53–61.https://doi.org/10.1016/S0045-6535(02)00310-7.
Lai, D.Y.F., Lam, K.C., 2008. Phosphorus retention and release by sediments in the eu-trophic Mai Po Marshes, Hong Kong. Mar. Pollut. Bull. 57, 349–356. https://doi.org/ 10.1016/j.marpolbul.2008.01.038.
Le Noë, J., Garnier, J., Billen, G., 2018. Phosphorus management in cropping systems of the Paris Basin: from farm to regional scale. J. Environ. Manag. 205, 18–28.https:// doi.org/10.1016/j.jenvman.2017.09.039.
Lee, B., Fettweis, M., Toorman, E., Molz, F., 2012. Multimodality of a particle size distribution of cohesive suspended particulate matters in a coastal zone. J Geophys Res -Ocean 117, C03014.https://doi.org/10.1029/2011JC007552.
Lefebvre, J.P., Ouillon, S., Vinh, V.D., Arfi, R., Panché, J.Y., Mari, X., Thuoc, C.V., Torréton, J.P., 2012. Seasonal variability of cohesive sediment aggregation in the bach dang–cam estuary, hai Phong (Vietnam). Geo Mar. Lett. 32, 103–121. https:// doi.org/10.1007/s00367-011-0273-8.
Marcotullio, P.J., 2007. Urban water-related environmental transitions in Southeast Asia.
Sustain. Sci. 2, 27–54.
Mari, X., Torréton, J.P., CBT, Trinh, Bouvier, T., Thuoc, C.V., Lefebvre, J.P., Ouillon, S., 2012. Aggregation dynamics along a salinity gradient in the bach dang estuary, North Vietnam. Estuarine. Coastal and Shelf Science 96, 151–158.https://doi.org/10.1016/ j.ecss.2011.10.028.
Martha, S., B, T.S., M, B.A., 2004. Effect of seasonal sediment storage in the lower Mississippi River on the flux of reactive particulate phosphorus to the Gulf of Mexico. Limnol. Oceanogr. 49, 2223–2235.https://doi.org/10.4319/lo.2004.49.6.2223. Meybeck, M., 1982. Carbon, nitrogen, and phosphorus transport by world river. Am. J.
Sci. 282, 401–450.https://doi.org/10.2475/ajs.282.4.401.
Millero, F., Huang, F., Zhu, X., Liu, X., Zhang, J., 2001. Adsorption and desorption of phosphate on calcite and aragonite in seawater. Aquat. Geochem. 7 (1), 33–56. Murphy, J., Riley, J.P., 1962. A modified single solution method for the determination of
phosphate in natural waters. Anal. Chim. Acta 27, 31–36. https://doi.org/10.1016/ S0003-2670(00)88444-5.
Némery, J., Garnier, J., 2007. Origin and fate of phosphorus in the Seine watershed (France): agricultural and hydrographic P budgets. J. Geophys. Res. 112, 1–14.
https://doi.org/10.1029/2006JG000331.
Némery, J., Garnier, J., 2016. Biogeochemistry: the fate of phosphorus. Nat. Geosci. 1–2. Nguyen, T.N.T., Némery, J., Gratiot, N., Strady, E., Tran, Q.V., Nguyen, T.A., Aimé, J.,
Peyne, A., 2019. Nutrient dynamics and eutrophication assessment in the tropical river system of Saigon – Dongnai (Southern Vietnam). Sci. Total Environ. 653, 370–383.https://doi.org/10.1016/j.scitotenv.2018.10.319.
Paludan, C., Morris, J.T., 1999. Distribution and speciation of phosphorus along a salinity gradient in intertidal marsh sediments. Biogeochemistry 45, 197–221. https://doi. org/10.1023/A:1006136621465.
Pant, H.K., Reddy, K.R., 2001. Phosphorus sorption characteristics of estuarine sediments under different redox conditions. J. Environ. Qual. 30, 1474–1480.
Reddy, K.R., Diaz, O.A., Scinto, L.J., Agami, M., 1995. Phosphorus dynamics in selected wetlands and streams of the Lake Okeechobee Basin. Ecol. Eng. 5, 183–207.https:// doi.org/10.1016/0925-8574(95)00024-0.
Reddy, K.R., O'Connor, G.A., Gale, P.M., 1998. Phosphorus sorption capacities of wetland soils and stream sediments impacted by dairy effluent. J. Environ. Qual. 27, 438–447.
https://doi.org/10.2134/jeq1998.00472425002700020027x.
Reddy, K.R., Kadlec, R.H., Flaig, E., Gale, P.M., 1999. Phosphorus retention in streams and wetlands: a review. Crit. Rev. Environ. Sci. Technol. 29, 83–146.https://doi.org/
10.1080/10643389991259182.
Richard, M., Andrew, S., Philip, B., Paul, P., 2001. Relationship between soil test phos-phorus and phosphos-phorus release to solution. Soil Sci. 166, 137–149. https://doi.org/ 10.1016/j.agee.2016.09.015.
Richardson, C.J., 1985. Mechanisms controlling phosphorus retention capacity in fresh-water wetlands. Science 228, 1424 LP–1427. 80-.https://doi.org/10.1126/science. 228.4706.1424.
Rossi, C.G., Heil, D.M., Bonumà, N.B., Williams, J.R., 2012. Evaluation of the Langmuir model in the Soil and Water Assessment Tool for a high soil phosphorus condition. Environ. Model. Softw 38, 40–49.https://doi.org/10.1016/j.envsoft.2012.04.018. Sims, J.T., SimardR, R., Joern, B., 1998. Phosphorus loss in agricultural drainage:
his-torical Perspective and current research. J. Environ. Qual. 27 (2), 277–293. https://
doi.org/10.2134/jeq1998.00472425002700020006x.
Statham, 2012. Nutrients in estuaries - an overview and the potential impacts of climate change. Sci. Total Environ. 434, 213–227. https://doi.org/10.1016/j.scitotenv.2011. 09.088.
Strady, E., Dang, V.B.H., Nemery, J., Guedron, S., Dinh, Q.T., Denis, H., Nguyen, P.D., 2017. Baseline investigation of nutrients and trace metals in surface waters and se-diments along the Saigon River basin impacted by the megacity of Ho Chi Minh (Vietnam). Environ. Sci. Pollut. Res. 24, 3226–3243. https://doi.org/10.1007/ s11356-016-7660-7.
Stumm, W., Morgan, J.J., 1981. Aquatic Chemistry: an Introduction Emphasizing Chemical Equilibria in Natural Waters. John Wiley.
Sui, Y., Thompson, M., Mize, C., 1999. Redistribution of biosolids-derived total phos-phorus applied to a mollisol. Journal of Environmental Quality - J Environ Qual 28 (4).https://doi.org/10.2134/jeq1999.00472425002800040002x.
Sundareshwar, P.V., James, M., 1999. Phosphorus sorption characteristics of intertidal marsh sediments along an estuarine salinity gradient. Limnol. Oceanogr. 44, 1693– 1701.https://doi.org/10.4319/lo.1999.44.7.1693.
Torrent, J., 1997. Interactions between phosphate and iron oxide, Soils and environment: soil processes from mineral to landscapes scale. Commun. Soil Sci. Plant Anal. 20 (11), 1181–1207.https://doi.org/10.1080/00103629009368144.
Tran, D., Kuprenas, R., Strom, K., 2018. How do changes in suspended sediment con-centration alone influence the zise of mud flocs under steady turbulent shearing? Cont. Shelf Res. 158, 1–14. https://doi.org/10.1016/j.csr.2018.02.008.
Tran Ngoc, T.D., Perset, M., Strady, E., Phan, T.S.H., Vachaud, G., Quertamp, F., Gratiot, N., 2016. Ho Chi Minh City Growing with Water-Related Challenges. Water, Megacities globa Chang.
Trieu, N.A., Hiramatsu, K., Harada, M., 2014. Optimizing the rule curves of multi-use reservoir operation using a genetic algorithm with a penalty strategy. Paddy Water Environ. 12, 125–137.https://doi.org/10.1007/s10333-013-0366-2.
Trinh, A.D., Giang, N.H., Vachaud, G., Choi, S.U., 2009. Application of excess carbon dioxide partial pressure (EpCO2) to the assessment of trophic state of surface water in the Red River Delta of Vietnam. Int. J. Environ. Stud. 66, 27–47. https://doi.org/10.
1080/00207230902760473.
Trinh, A.D., Meysman, F., Rochelle-Newall, E., Bonnet, M.P., 2012. Quantification of sediment-water interactions in a polluted tropical river through biogeochemical modeling. Glob. Biogeochem. Cycles 26, 1–15. https://doi.org/10.1029/
2010GB003963.
1 2015. Impact of hydro-sedimentary processes on the dynamics of soluble reactive phosphorus in the Seine River. Biogeochemistry 122, 229–251. https://doi.org/10.
1007/s10533-014-0038-3.
Vollenweider, R., 1968. Scientific fundamentals of the eutrophication of lakes and flowing waters, with particular reference to nitrogen and phosphorous as factors in eutrophication. OECD Tech rep. DAS/CSI/68.27. 30 cm 159, 34.
Walter Lynn, M., Morse John, W., 1984. Reactive surface area of skeletal carbonates during dissolution; effect of grain size. J. Sediment. Res. 54 (4), 1081–1090. https://
doi.org/10.1306/212F8562 -2B24-11D7-8648000102C1865D.
Wang, Q., Li, Y., 2010. Phosphorus adsorption and desorption behavior on sediments of different origins. J. Soils Sediments 10, 1159–1173. https://doi.org/10.1007/ s11368-010-0211-9.
Wang, S., Jin, X., Bu, Q., Zhou, X., Wu, F., 2006. Effects of particle size, organic matter and ionic strength on the phosphate sorption in different trophic lake sediments. J. Hazard Mater. 128, 95–105.https://doi.org/10.1016/j.jhazmat.2005.07.048. Wendling, V., Gratiot, N., Legout, C., Droppo, I.G., Coulaud, C., Mercier, B., 2015. Using
an optical settling column to assess suspension characteristics within the free, floc-culation, and hindered settling regimes. J. Soils Sediments 15, 1991–2003.https:// doi.org/10.1007/s11368-015-1135-1.
Zhang, J.Z., 2012. Current wet persulfate digestion method considerably underestimates total phosphorus content in natural waters. Environ. Sci. Technol. 46 (24), 13033–13034.https://doi.org/10.1021/es304373f.
Zhang, J.Z., Huang, X.L., 2007. Relative importance of solid-phase phosphorus and iron on the sorption behavior of sediments. Environ. Sci. Technol. 41, 2789–2795.https:// doi.org/10.1021/es061836q.
Zhang, J.Z., Huang, X.L., 2011. Effect of temperature and salinity on phosphate sorption on marine sediments. Environ. Sci. Technol. 45 (16), 6831–6837.https://doi.org/10. 1021/es200867p.
Zhang, J.Z., Fischer, C.J., Ortner, P.B., 2004. Potential availability of sedimentary phosphorus to sediment resuspension in Florida Bay. Glob. Biogeochem. Cycles 18, GB4008.https://doi.org/10.1029/2004GB002255.