Bulletin UASVM Agriculture, 68(1)/2011
Print ISSN 1843-5246; Electronic ISSN 1843-5386
Research on Crude Protein Contents in Medicago Sativa Hay Harvest
During 2008-2009 Using FT-NIR Spectrometry
Laura DALE1), Ioan ROTAR1), Vasile FLORIAN1), Roxana VIDICAN1), André THEWIS2), Juan Antonio FERNÁNDEZ PIERNA3), Vincent BAETEN3)
1) University of Agricultural Science and Medicine Veterinary, Cluj Napoca, Grassland and
Forage Crops Department, 3-5, Calea Manaştur, 400372 Cluj, Romania, dale_lm@yahoo.com,
2) Gembloux Agro-Bio Tech, University of Liège, Animal Science Unit, 2, Passage des
Déportés, 5030 Gembloux, Belgium,
3)Walloon Agricultural Research Center, Valorisation of Agricultural Products Department, 24
Chaussée de Namur, 5030 Gembloux, Belgium
Abstract. Medicago sativa or alfalfa is a flowering plant that belongs to Pea Family that is widely grown throughout the world as forage for cattle, and is most often harvested as hay. Usually, alfalfa has the highest nutritive value of all common hay crops. This work aims to highlight a way for direct, non-destructive analysis of crude protein content in alfalfa hays. The primary objective was to build a model for crude protein calibration for alfalfa based on FT-NIR spectroscopy. The samples for analysis were collected over two experimental years (2008-2009) from field trials from the research station– Agricultural Development, Cojocna. In order to construct the model, reference values are needed; for this reason, the crude protein content was determined using the classical Kjeldahl method (Kjeltec Auto Analyser, Tecator). The values for crude protein ranged from 12.63% to 19.12% on the dry matter basis. The regression model’s construction was based on Partial Least Squares (PLS) calculated with the SIMPLS algorithm, using different pre-processing techniques and leave-one-out cross validation. Calibration of the two years together drove to a coefficient of determination for cross validation, R2 of 0.965. The robustness of the model was confirmed by applying it to independent
samples (external validation) where the coefficient of determination was R2 = 0.977, RMSEP = 0.8.
The results obtained indicated that NIRS can be used to determine crude protein, which could be used as criteria for quality control of alfalfa hays.
Keywords: NIRS, Medicago sativa, alfalfa, crude protein, PLS, non-destructive method.
INTRODUCTION
Alfalfa (Medicago sativa L.) is the most important forage legume in temperate climates and also in Romania. Alfalfa culture is very common in our country and is considered by many farmers a basic culture, indispensable in any farm productivity due to its special quality.
The superiority of alfalfa culture over other forage crops can be explained mainly by its higher production, high quality of the forage product and its production ability for several years without being seeded. Alfalfa is known and appreciated as a forage crop rich in protein and other substances and is very important for animal nutrition. The nutritional value is influenced by the vegetative phenophases, soil condition and climate characteristics of the variety.
Rotar, (1993), shows that alfalfa has several morphological and physiological features, which give competitively advantages regarding the regeneration energy, resistance to drought, competitively, etc...
Markovic, et al., (2007), affirms that most of the forage legumes, alfalfa among them, are a crucial source of proteins and other nutrients for ruminants.
To determinate the protein content in a fast way and in a short time, NIR (Near Infrared) was applied in Rotar, et al., (2009). NIRS technique is first and foremost a very fast technique is less expensive when working with a larger number of samples and, is especially non-destructive. The technique has a high repeatability, accuracy and high precision. In addition, because it requires the use of chemicals and no prior sample preparation, NIRS technique is considered “clean technology” - in accordance with the requirements of sustainable agriculture (Roxana Vidican, et al., 2000). The main disadvantage of the NIRS method is the dependence on reference chemical methods, low sensitivity to minor components and a complicated interpretation of spectral data (Carlier, et al., 1998).
NIRS was discovered in 1800 and after many years of research the NIR technique is applied in the food industry and agriculture to determine water, protein, and carbohydrate contents among others in a large variety of products (Workman, 2005). The first scientific work in agriculture with the use of NIRS in this large domain was in 1976, when Norris, K., Barnes, R., Moore, J., and Shenk, J. determined the moisture content of grains and seeds. After them, in 1980 Ian Murray used NIRS technique for forages analysis. NIRS technique becomes more used to determine physico-chemical properties of feed value and fodder.
A spectrum may, or may not contain information related to the chemical composition of sample measured using any specific reference method. Spectra-structure correlation provides a basis for the establishment of a known cause and effect relationship between instrument response and reference (analyse) data. Hansen, et al., (1999), reported that to perform multivariate calibrations, analytically valid calibration models a relationship between the instrument response data or spectrum (X), and the reference data (Y) is required and the probability used tells us only that X and Y 'appear' to be related.
This paper aims to highlight a way of direct non-destructive analysis method for the determination of crude protein content in alfalfa hays.
MATERIAL AND METHODS
The alfalfa samples, in number of 57, used in this study were obtained from the Research Station of Agricultural Development in Cojocna (Romania) during 2008 and 2009. In a first step, all the samples were measured using a FT-NIR spectrometer (PerkinElmer Spectrum One, PerkinElmer) with a NIRA detector. The samples were directly measured, i.e. through the bottom of the intact glass vials by diffuse reflectance without any extra preparation.
Data were collected over the range 10000 to 4000 cm-1 at 16 cm-1 resolution with 2 cm-1 step for 2008 year and for 2009 year the data was collected over the range 1000 to 2500 nm at 16 nm resolutions with 2 nm step.
Spectra was recorded by filling a standard sample cup with the sample and scanning it in interleaved mode. This mode of operation alternately takes a background spectrum as well as the rationed spectrum which minimizes changes in atmospheric effects.
Sixteen replicate measurements of each of the calibration samples were collected, and also the mean spectrum used for the generation of the calibration equations. All data were transformed in the range 1000 to 2500 nm.
At the same time, each sample was measured using the classical method for crude protein content, the Kjeldahl method, which will be considered as the reference method.
The destructive methods used for calibration were made at the University of Agricultural Sciences and Veterinary Medicine (USAMV) Cluj Napoca, for samples harvested during 2008, at ICAR Laboratory and at Gembloux Agro-Bio Tech (GxABT), in 2011, at Animal Science Unit there were analysed the samples harvest during 2009. The Kjeldahl method (AOAC, 1990) was used to determinate crude protein, at USAMV was used the Kjeldahl System Digest and at GxABT was used the FOSS Digestion System 20.
For the mathematical model, the PLS toolbox under MatLab program was used. The models built were based on Partial Least Squares (PLS). The algorithm used was SIMPLS, the pre-processing for X-Block was: Smoothing (order: 0, window: 9 pt) and 1st Derivative (order: 2, window: 5 pt) and the cross validation was also used: leave one out, using 18 PLS factors.
RESULTS AND DISCUSSION
The PLS toolbox from MatLab was used for all the multivariate analyses. The samples were randomly split up into a calibration set (39 samples) and a validation set (18 samples). The set for calibration is from each stage of vegetation and is presented in figure 1.
5 10 15 20 25 30 35 15 15.2 15.4 15.6 15.8 16 16.2 16.4 16.6 16.8 17 Sample Y P re d ic te d 1 Samples/Scores Plot of X plant height of 30 cm flowering phenophase
the phenophase of buds
phenophase seed formation
Fig. 1. Distribution of alfalfa samples in different stage of vegetation
In table 1 there are presented all the samples collected in this two years, the year 2008 ranged from 1 to 38 and the year 2009 ranged from 39 to 57. The samples are in different stage of vegetation, from a11 to a27 and from LD089 to LD116 are samples from plant height of 30 cm phenophases, from b11 to b27 and L321 to LD334 are samples from the flowering phenophases, from c1 to c7 and LD343 to LD358 are samples from the phenophases of buds and from d1 to d7 and LD369 to LD385 are samples from the phenophases of seed formation.
The destructive method used Kjeldahl method, shows results between 12.64 and 19.13. The results are detailed for each phenophases of vegetation, for the samples from plant height of 30 cm phenophases, the crude protein content is between 12.64 and 17.18; for samples from the flowering phenophases, the crude protein content is between 14.81 and 19.13; for
samples from the phenophases of buds, the crude protein content is between 14.73 and 18.41; and for samples from the phenophases of seed formation, the crude protein content is between 14.56 and 16.90. It can be seen that the highest crude protein content at alfalfa is in the second stage of vegetation, the flowering phenophases.
Tab. 1 Protein content in different stage of vegetation
Samples No. PB (%) Samples No. PB (%) Samples No. PB (%)
'a11' 1 16.10 'b21' 20 15.44 'LD089' 39 12.64 'a12' 2 15.66 'b22' 21 16.34 'LD097' 40 16.10 'a14' 3 17.18 'b23' 22 14.81 'LD108' 41 16.23 'a15' 4 16.61 'b24' 23 17.16 'LD113' 42 16.96 'a16' 5 16.28 'b25' 24 15.84 'LD116' 43 13.95 'a17' 6 16.53 'b26' 25 16.60 'LD313' 44 18.77 'a21' 7 16.50 'b27' 26 15.04 'LD321' 45 17.40 'a22' 8 14.99 'c2' 27 16.12 'LD323' 46 18.25 'a23' 9 17.18 'c3' 28 14.73 'LD334' 47 19.13 'a25' 10 16.04 'c4' 29 15.99 'LD340' 48 18.53 'a26' 11 16.04 'c5' 30 16.91 'LD343' 49 17.54 'a27' 12 16.22 'c6' 31 16.55 'LD344' 50 17.17 'b11' 13 16.08 'c7' 32 16.57 'LD346' 51 18.41 b12' 14 15.83 'd1' 33 16.19 'LD349' 52 16.72 'b13' 15 16.38 'd2' 34 15.06 'LD358' 53 17.31 'b14' 16 15.90 'd3' 35 15.54 'LD369' 54 15.19 'b15' 17 15.61 'd4' 36 15.14 'LD376' 55 16.90 'b16' 18 15.62 'd5' 37 14.56 'LD381' 56 15.18 'b17' 19 15.38 'd6' 38 15.17 'LD385' 57 14.61
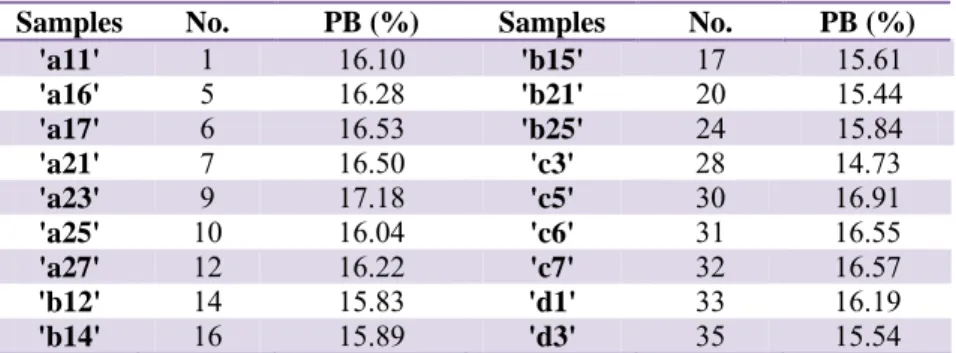
A PLS (Partial Least Squares) model was performed on the data. Table 2 includes samples that were used in the validation set, for external validation. The samples were taken randomly, with the help of MatLab program, from each vegetative stage. For the external validation the samples from table 1 were chosen.
Tab. 2 Protein content in different stage of vegetation – validation set
Samples No. PB (%) Samples No. PB (%)
'a11' 1 16.10 'b15' 17 15.61 'a16' 5 16.28 'b21' 20 15.44 'a17' 6 16.53 'b25' 24 15.84 'a21' 7 16.50 'c3' 28 14.73 'a23' 9 17.18 'c5' 30 16.91 'a25' 10 16.04 'c6' 31 16.55 'a27' 12 16.22 'c7' 32 16.57 'b12' 14 15.83 'd1' 33 16.19 'b14' 16 15.89 'd3' 35 15.54
As expected, the calibration model is a robust model because in the model made only with the samples from the years 2008-2009, the samples are very well integrated, the cross-validation being shown like that, R2=0.82 (fig.2). The second objective was to determine if the external validation of this model is good, R2=89 (fig.3).
14.5 15 15.5 16 16.5 17 17.5 18 18.5 19 14.5 15 15.5 16 16.5 17 17.5 18 18.5 19 Y Measured 1 Y P re d ic te d 1 Samples/Scores Plot of X89 R2 = 0.993 6 Latent Variables RMSEC = 0.082352 RMSECV = 0.43258 Calibration Bias = 0.0004195 CV Bias = -0.0149 14.5 15 15.5 16 16.5 17 17.5 18 18.5 19 14.5 15 15.5 16 16.5 17 17.5 18 Y Measured 1 Y C V P re d ic te d 1 Samples/Scores Plot of X89 R^2 = 0.817 6 Latent Variables RMSEC = 0.082352 RMSECV = 0.43258 Calibration Bias = 0.0004195 CV Bias = -0.0149
Fig.1. Calibration model for alfalfa Fig.2. The Cross-Validation of calibration model for alfalfa 14.5 15 15.5 16 16.5 17 17.5 18 18.5 19 14.5 15 15.5 16 16.5 17 17.5 18 18.5 19 Y Measured 1 Y P re d ic te d 1
Samples/Scores Plot of X89,c & Xtest,
R2 = 0.891 6 Latent Variables RMSEC = 0.082352 RMSECV = 0.43258 RMSEP = 0.45858 Calibration Bias = 0.0004195 CV Bias = -0.0149 Prediction Bias = -0.093911
Fig.3. The external validation of calibration model for alfalfa
Full cross validation excludes each sample in turn from the calibration set, performs the calibration and then predicts the excluded standard using that calibration. Smaller prediction errors may be obtained using a larger number of PLS factors.
To support validation, a series of samples were run later and the crude protein content was predicted using the calibration model. The alfalfa calibration equations developed to analyse the crude protein content had an R2 0.993. Calibration equations developed to estimate crude protein content gave an excellent R2 (R2 > 0.90) and appeared sufficiently robust. Similarly, Sheaffer, et al., (2000), showed that the NIRS analyses of alfalfa could estimate the crude protein content with a better accuracy in both cases. They obtained R2=0.96. Velasco, et al., (1998) reported that crude protein content could be measured by NIRS analyses of alfalfa samples, with the R2=0.95 in calibration and R2=0.94 in validation, Iantcheva, et al., (1999) estimated the crude protein with similar accuracy R2=0.92, in calibration and in validation R2=0.91, Brogna, et al., (2009) considers that the R2 should be ideally high, in his study the R2 being between 0.70 and 0.95, they obtained for crude protein in calibration R2=0.95, and in validation, R2=0.94.
CONCLUSIONS
The work detailed in this paper illustrates that it is possible, using FT-NIR spectroscopy, to determine a certain number of crude protein content in alfalfa samples with an accuracy similar to that of the reference method.
Based on the samples supplied, it has been shown that FT-NIR and PLS can be used to determine crude protein content of alfalfa with good correlation coefficients and low errors.
This preliminary study proves that the FT-NIR spectroscopy is an extremely reliable, non-destructive and rapid technique for the prediction of quantitative chemical and physical properties.
REFERENCES
1. Brogna, N., Pacchioli, M. T., Immovilli, A., Ruozzi, F., Ward, R., & Formigoni, A. (2009). The use of near-infrared reflectance spectroscopy (NIRS) in the prediction of chemical composition and in vitro neutral detergent fiber (NDF) digestibility of Italian alfalfa hay. Italian
Journal of Animal Science , 271–273.
2. Büning-Pfaue, H. (2003). Analysis of water in food by near infrared spectroscopy. Food
Chem., 82, 107–115.
3. Carlier, L., Puia, I., & Rotar, I. (1998). For a better grass production. Cluj Napoca: Ed. Risoprint pg:129–131.
4. Hansen, P. W., van Brakel, A. S., Garman, J., & Norgaard, L. (1999). Detection of specific sugars in dairy process samples using multivariate curve resolution. J. Dairy Sci. 82:1351– 1360.
5. Iantcheva, N., Steingass, H., Todorov, N., & Pavlov, D. (1999). A comparison of in vitro rumen fluid and enzymatic methods to predict digestibility and energy value of grass and alfalfa hay.
Animal Feed Science and Technology , 81, 333–344.
6. Murray, J.-A. M., Longland, A., Hastie, P. M., Moore-Colyer, M., & Dunnett, C. (2008). The nutritive value of sugar beet pulp-substituted lucerne for equids. Animal Feed Science and
Technology , 140, 110–124.
7. Marković, J., Radović, J., Lugić, Z., & Sokolović, D. (2007). The effect of development stage on chemical composition of alfalfa leaf and stem, Biotechnology in Animal Husbandry, 23 (5-6), 383–388
8. Norris, K., Barnes, R., Moore, J., & Shenk, J. (1976). Predicting forage quality by infrared reflectance spectroscopy. Journal of Animal Science, 43, 889–897.
9. Sheaffer, C. C., Martin, N. P., Lamb, J. F., Cuomo, G. R., and Jewett, J. G. (2000). Leaf and Stem Properties of Alfalfa Entries. Agronomy Journal, 733–739.
10. Rotar, I., Dale, L. M., Vidican, R., Mogoș, A., & Ceclan, O. (2009). Research on protein content and toral nitrogen and a cob of maize strains by FT-NIR spectrometry. Bulletin of UASVM
Cluj-Napoca, seria Agricultura , 66 (1), 465-467.
11. Rotar, I. (1993). Cercetări privind coacţiile de competiţie în culturi pure şi asociate de
Medicago sativa şi Dactylis glomerata în condiţii de fertilizare diferenţiată cu azot. Cluj – Napoca:
Doctoral Thesis.
12. Velasco, L., Fernandez-Martinez, J.M., & De Haro, A. (1998). Application of Near-Infrared Reflectance Spectroscopy to Estimate the Bulk Density of Ethiopian Mustard Seeds, Journal
of the Science of Food and Agriculture, Volume 77(3):312–318.
13. Vidican, Roxana, Rotar, I., & Sima, N. (2000). Tehnica NIRS (Near Infrared Reflectance Spectroscopy) si aplicaţiile sale în analiza calităţii furajelor. Simpozion “Agriultura si alimentaţia”, USAMV Cluj Napoca, 187–191.
14. Workman, J. (2005). An Introduction to Near Infrared Spectroscopy - NIR spectroscopy calibration basics. In E. W. Ciurczak, Handbook of Near-Infrared Analysis (pp. 247-280). New York: Marcel Dekker.