O
pen
A
rchive
T
OULOUSE
A
rchive
O
uverte (
OATAO
)
OATAO is an open access repository that collects the work of Toulouse researchers and
makes it freely available over the web where possible.
This is an author-deposited version published in :
http://oatao.univ-toulouse.fr/
Eprints ID : 18086
To link to this article : DOI:
10.1016/j.jhevol.2016.04.004
URL : http://dx.doi.org/10.1016/j.jhevol.2016.04.004
To cite this version :
Beaudet, Amélie and Dumoncel, Jean and
Thackeray, John Francis and Bruxelles, Laurent and Duployer,
Benjamin and Tenailleau, Christophe and Bam, Lunga and
Hoffman, Jakobus and de Beer, Frikkie and Braga, José Upper third
molar internal structural organization and semicircular canal
morphology in Plio-Pleistocene South African cercopithecoids.
(2016) Journal of Human Evolution, vol. 95. pp. 104-120. ISSN
0047-2484
Any correspondence concerning this service should be sent to the repository
administrator: [email protected]
Upper third molar internal structural organization and semicircular
canal morphology in Plio-Pleistocene South African cercopithecoids
Am!
elie Beaudet
a,b,*, Jean Dumoncel
b,c, John Francis Thackeray
d, Laurent Bruxelles
e,f,g,
Benjamin Duployer
h, Christophe Tenailleau
h, Lunga Bam
i, Jakobus Hoffman
i,
Frikkie de Beer
i, Jos!
e Braga
b,daDepartment of Anatomy, University of Pretoria, PO Box 2034, Pretoria 0001, South Africa
bLaboratoire d’Anthropologie Mol!eculaire et Imagerie de Synth"ese, UMR 5288 CNRS-Universit!e de Toulouse (Paul Sabatier), 37 All!ees Jules Guesde, 31 073 Toulouse Cedex 3, France
cInstitut de Recherche en Informatique de Toulouse, UMR 5505 CNRS-Universit!e de Toulouse (Paul Sabatier), 118 Route de Narbonne, 31062 Toulouse Cedex 9, France
dEvolutionary Studies Institute, University of the Witwatersrand, Private Bag 3, Wits 2050, Johannesburg, South Africa eInstitut National de Recherches Arch!eologiques Pr!eventives, 561 rue Etienne Lenoir, km Delta, 30900 Nîmes, France
fLaboratoire des Travaux et Recherches Arch!eologiques sur les Cultures, les Espaces et les Soci!et!es, UMR 5608 CNRS-Universit!e de Toulouse (Jean Jaur"es), Maison de la Recherche, 5 All!ees Antonio Matchado, 31058 Toulouse Cedex 9, France
gSchool of Geography Archaeology and Environmental Studies, University of the Witwatersrand, Private Bag 3, Wits 2050, Johannesburg, South Africa hCentre Inter-universitaire de Recherche et d’Ing!enierie des Mat!eriaux, UMR 5085 CNRS-Universit!e de Toulouse (Paul Sabatier), 118 route de Narbonne, 31062 Toulouse Cedex 9, France
iSouth African Nuclear Energy Corporation, Pelindaba, North West Province, South Africa
Keywords: Old World monkeys Primate palaeobiodiversity Bony labyrinth
Dental internal structure Deformation-based models Taxonomy
a b s t r a c t
Despite the abundance of cercopithecoids in the fossil record, especially in South Africa, and the recent development of morphometric approaches, uncertainties regarding the taxonomic identification of isolated cranio-dental specimens remain. Because cercopithecoids, nearly always found in stratigraphic association with hominin remains in Plio-Pleistocene deposits, are considered as sensitive ecological and chronological biomarkers, a significant effort should be made to clarify their palaeobiodiversity by assessing additional reliable morphological diagnostic criteria. Here we test the relevance of both molar crown internal structure and bony labyrinth morphology for discrimination of fossil cercopithecoid species. We use microtomographic-based 3D virtual imaging and quantitative analyses to investigate tooth endostructural organization and inner ear shape in 29 craniodental specimens from the South African sites of Kromdraai, Makapansgat, Sterkfontein and Swartkrans and provide the first detailed description of the internal structural condition characterizing this Plio-Pleistocene primate assemblage. Our preliminary results show that enamel-dentine junction morphology could be informative for discriminating highly autapomorphic taxa such as Theropithecus, while semicircular canal shape is tentatively proposed as an efficient criterion for diagnosing Dinopithecus ingens. Further research in virtual paleoprimatology may contribute to the identification of unassigned isolated fossil remains and shed new light on the internal craniodental morphology of extinct primate taxa.
1. Introduction
Old World monkeys are abundant in the Plio-Pleistocene African fossil record and are one of the best documented primate radiations (Szalay and Delson, 1979; Jablonski, 2002; Jablonski and Frost,
2010). Indeed, probably due to their adaptability, relatively fast life histories and generalized morphology, the phyletic and ecological diversification of the group significantly increased through the Plio-Pleistocene in Africa, and cercopithecoids became dominant primates during this period in Africa (Jablonski and Frost, 2010; Fleagle, 2013). More specifically, the South African karstic cave sites have yielded valuable assemblages of fossil cercopithe-coids, documenting potentially seven genera and up to 12 species * Corresponding author.
E-mail address:[email protected](A. Beaudet).
(Freedman, 1957; Szalay and Delson, 1979; Delson, 1984, 1988; Jablonski, 2002; Gilbert, 2007a, 2013; McKee et al., 2011).
Because of their co-occurrence with hominins in paleontological deposits, cercopithecoids provide valuable contextual information regarding hominin paleoecology and biostratigraphic dating, as well as data for the reconstruction of pan-African dispersal patterns and palaeoenvironments (Delson, 1984, 1988; Strait and Wood, 1999; Elton, 2001; Gilbert, 2008; Bettridge and Dunbar, 2012). Also, in the absence of great apes in the Plio-Pleistocene fossil re-cord, cercopithecoids represent the closest relatives to hominins, and they were consequently proposed as a “control-group” for the understanding of evolutionary trends and adaptations of the earliest hominins (Jolly, 1970, 2001; Elton et al., 2001; Elton, 2006). However, the use of cercopithecoids as biomarkers relies on the ability of current diagnostic criteria to taxonomically assign fossil remains and evaluate palaeobiodiversity and relative abundance.
The external craniodental morphology of extinct cercopithe-coids has been widely described since the earliest discoveries in South Africa and subsequently used to define fossil cercopithecoid alpha taxonomy (e.g.,Freedman, 1957; Maier, 1970; Eisenhart, 1974; Szalay and Delson, 1979; Jablonski, 2002). The most recent reviews of the material available and descriptions of new discoveries and additional specimens have used ‘traditional’ external morphological features and both clarified and expanded the currently accepted taxonomic pattern (e.g.,Gilbert, 2013; Gilbert et al., 2015). However, despite the potential value of endostructural information in taxo-nomic studies, the internal morpho-structural condition of extinct cercopithecoid taxa is reported in only a few studies (e.g.,Beaudet, 2015; Beaudet et al., 2015, 2016). If these structures prove to behave as efficient supplementary diagnostic features, their study will offer the opportunity to propose discriminators useful for the identifi-cation of isolated and fragmentary craniodental remains, which are abundant in the South African fossil record (seeBrain, 1981). 1.1. Brief review of extinct South African Plio-Pleistocene cercopithecoid taxa
We follow previous published reviews of South African papionin taxa (e.g., Freedman, 1957; Szalay and Delson, 1979; Jablonski, 2002; Gilbert, 2013) recognizing four species of Parapapio, three species of Papio, one species of Dinopithecus, one species of Gor-gopithecus, three subspecies of Theropithecus oswaldi and one spe-cies of Cercopithecoides. We confine our review to the taxa included and discussed in our sample.
Parapapio is currently represented in South Africa by three spe-cies (Parapapio jonesi, Parapapio broomi, and Parapapio whitei) initially distinguished on the basis of molar size, Pp. whitei having the largest and Pp. jonesi the smallest teeth (Broom, 1940). Morphologically, Parapapio differs from Papio by a straight profile of the muzzle dorsum rather than the steep anteorbital drop typically found in the latter (Freedman, 1957; Eisenhart, 1974). In contrast, its teeth are considered morphologically indistinguishable from those of the genus Papio (Freedman, 1957) or even from those of other species of Papionini (Heaton, 2006). Also, Pp. jonesi displays the least marked development of maxillary ridges and fossae of the Parapapio species (Jablonski, 2002; Heaton, 2006). The “Parapapio” identified at Taung, originally attributed to Parapapio antiquus (Freedman, 1957; Szalay and Delson, 1979), has been recently reassigned to the genus Procercocebus based on shared derived features with the Cercocebus/Mandrillus clade (Gilbert, 2007a, 2013). While some authors, such asFreedman (1957)andGilbert (2013), followed the same trimodal system asBroom (1940), the validity of the species Pp. whitei and Pp. jonesi was questioned and Broom's trichotomy challenged by others (Eisenhart, 1974;Thackeray and Myer, 2004; Heaton, 2006; Williams et al., 2007; Fourie et al., 2008).
Three extinct variants of Papio have been recognized in South Africa, including Papio robinsoni, the largest fossil species in the genus, and the two small-bodied morphs Papio izodi and Papio angusticeps (Freedman, 1957; Delson, 1984; McKee, 1993; McKee and Keyser, 1994). Papio robinsoni is notably characterized by a flat muzzle dorsum and the maxillary ridges raised higher than the nasal bone, whereas P. angusticeps has weak maxillary ridges and deep maxillary fossae and teeth shorter and broader than those of P. robinsoni (Freedman, 1957). The modern baboon (Papio hama-dryas sensu lato) was suggested to have emerged from the South African fossil record (Gilbert et al., 2013).
Dinopithecus ingens is a very large and sexually dimorphic fossil baboon species found in the type locality of Schurweberg and at Swartkrans (Delson, 1984; Jablonski, 2002; Jablonski and Frost, 2010). Given numerous craniodental similarities shared with modern baboons, some authors considered Dinopithecus to be a subgenus of Papio (Freedman, 1957; Szalay and Delson, 1979; Delson and Dean, 1993; Frost, 2001; but seeGilbert, 2013). Dino-pithecus ingens is distinguished from other papionins by a robust and rugged skull with strong masticatory apparatus, long muzzle and broad interorbital region (Freedman, 1957).
Gorgopithecus major is a large form of baboon characterized by a relatively short, high and narrow muzzle with deep maxillary and mandibular fossae, nearly vertical zygoma and slight sexual dimorphism in the skull (Freedman, 1957; Jablonski and Frost, 2010). This baboon taxon, identified at Kromdraai and Swartkrans (Delson, 1984, 1988), but also in eastern Africa (Gilbert et al., 2016), has been suggested to be phylogenetically related to extant Lophocebus (Gilbert, 2013).
The genus Theropithecus is distinguished from other papionins especially through its high crowned and columnar-cusped cheek teeth with infoldings of thick enamel and several postcranial fea-tures that are related to its terrestrial life (Jolly, 1972; Jablonski, 1993). The species T. oswaldi forms a chronolineage divided into three chronosubspecies: from oldest to youngest Theropithecus oswaldi darti, Theropithecus oswaldi oswaldi and Theropithecus oswaldi leakeyi (Leakey, 1993; Frost and Delson, 2002; Frost, 2007). Theropithecus oswaldi darti is found at Makapansgat, while T. o. oswaldi is known at Swartkrans and Sterkfontein (Jablonski, 1993). Theropithecus oswaldi leakeyi was identified at Hopefield (Dechow and Singer, 1984) and Bolt's Farm Pit 10 (Gilbert, 2007b).
The extinct colobine species Cercopithecoides williamsi is spatially and temporally largely distributed in South African Plio-Pleistocene sites (e.g., Kromdraai, Makapansgat, Sterkfontein, Swartkrans, Taung) (Delson, 1984, 1988; Jablonski, 2002). The cra-nium displays diagnostic traits such as a rounded calvarium, short and relatively narrow muzzle, and a wide face with large interor-bital distance (Freedman, 1957; Jablonski, 2002; key features reviewed inMcKee et al. 2011). Teeth are small and exhibit typical colobine features (Szalay and Delson, 1979).
1.2. Internal craniodental structures as potential diagnostic criteria Dental remains are usually the most common material in the primate fossil record (Hartwig, 2002). The identification of isolated teeth or dentognathic fragments is difficult because there are often no distinctive morphological features that can be used to accurately distinguish between closely related taxa. In association with signif-icant improvements in analytical tools, the development of advanced imaging techniques (such as micro-focus X-ray tomogra-phy) permits the noninvasive extraction of a wide range of mor-phostructural information (reviewed inMacchiarelli et al., 2013).
Primate enamel thickness variations were previously suggested to be explained by advantages for resisting fracture and abrasion or for shearing (e.g.,Gantt, 1977; Kay, 1981; Dumont, 1995). More
recently, the possibility that thick enamel might be adaptive in seasonal environments was suggested, based on the assessment of enamel thickness variations in macaques (Kato et al., 2014). In addition to functional hypotheses, enamel thickness variations recorded in fossil hominins have also been reported to provide potential phylogenetic and taxonomic information (e.g.,Olejniczak et al., 2008a,b). While data on dental tissue volumes and pro-portions have been documented for extant cercopithecoid taxa, they have mainly been used as part of a comparative sample (e.g., Gantt, 1977; Kay, 1981; Dumont, 1995; Shellis et al., 1998; Hlusko et al., 2004; Grine et al., 2005; Olejniczak et al., 2008c; McGraw et al., 2012; Kato et al., 2014), and little is known about fossil specimens (Beaudet, 2015; Beaudet et al., 2015, 2016). This conse-quently limits the potential taxonomic inferences that can be made from dental tissue proportions for cercopithecoids. In addition to the tissue proportions, enamel-dentine junction (EDJ) morphology is another aspect of internal dental structure that is thought to include a phylogenetic signal and has proved to be useful in the diagnosis of fossil hominoid species (e.g., Skinner et al., 2008; Zanolli et al., 2012, 2014). Previous 2D investigations of cercopi-thecoid EDJ shape described a specific pattern in comparison with other anthropoids but did not explore discrimination beyond the superfamily level (Olejniczak et al., 2004, 2007).
The extraction and characterization of the bony labyrinth has also provided significant taxonomic and phylogenetic information in primates (e.g.,Spoor, 1993; Spoor et al., 2003; Rook et al., 2004; Lebrun et al., 2010; Gunz et al., 2012; Braga et al., 2013, 2015). As the inner ear is part of the hearing and balance systems, subtle morphological variations and allometric deviations reported may be correlated with hearing capacities (e.g.,Manoussaki et al., 2008; Kirk and Gosselin-Ildari, 2009; Braga et al., 2015) or locomotor behaviours (e.g.,Spoor et al., 2007; Silcox et al., 2009; Malinzak et al., 2012). More specifically, dimensions and angular measure-ments assessed for the semicircular canals were proposed as proxies for the reconstruction of agility (Spoor et al., 2002; Malinzak et al., 2012), but inner ear shape characterized by geo-metric morphogeo-metric analyses was nonetheless revealed to be relevant for detecting phylogenetic signal in strepshirrhines (Lebrun et al., 2010).
By using techniques of three-dimensional virtual imaging and high resolution quantitative characterization, coupled with morphometric analyses, we investigated internal morphological features in Plio-Pleistocene South African cercopithecoid samples and living relatives. We compared our 3D-based results to the current taxonomy and evaluated the potential of dental and semicircular canal (SCC) features as diagnostic criteria for discriminating extinct taxa. Accordingly, here we consider the hy-pothesis that dental endostructures and inner ear features provide taxonomically diagnostic information for the identification of fossil cercopithecoid remains. Specifically, we apply this to the well-studied Parapapio and Papio taxa, and we consequently include additional tests for exploring the morphological variability of these two groups and evaluate the sensitivity of our criteria. Finally, the combination of dental endostructural properties and inner ear morphology offers the unique opportunity to compare the poten-tial of these structures for species diagnosis.
2. Material and methods 2.1. Sample and data collection
Our fossil sample includes 29 cercopithecoid specimens from four South African Plio-Pleistocene sites (Kromdraai, Makapansgat, Sterkfontein, Swartkrans) representing Pp. jonesi, Pp. broomi, Pp. whitei, Parapapio sp., Papio angusticeps, P. robinsoni, Papio sp.,
D. ingens, G. major, T. o. oswaldi, T. o. darti and C. williamsi (Table 1). Our comparative sample of extant specimens is detailed inTable 1. All the specimens investigated in this study have been imaged by micro-focus X-ray tomography (
m
CT) using various systems detailed inTable 1. The isometric voxel size of the reconstructed volumes ranges from 18.7 to 122.9m
m (Table 1).We obtained dental tissue proportions and SCC surfaces through semi-automatic threshold-based segmentations and 3D mesh re-constructions via the software Avizo v8.0 (Visualization Sciences Group Inc.). The sample sizes of the dental tissue proportions and EDJs investigated, plus SCCs extracted, are listed inTable 1. For in-ternal dental structure, teeth with dentine horns affected by wear were excluded from the overall tissue proportion analyses. The enamel topographic distribution documented in each taxon was imaged by colour maps from dark blue (thin) to red (thick) in the best-preserved specimens. Conversely, the overall available dental sample was used to assess the lateral enamel thickness and dis-tribution. Finally, teeth displaying a degree of wear exceeding stage 9C in the score system developed byDelson (1973)were excluded from the analysis of the EDJ shape. This stage of wear corresponds to a maximum loss of around 5% of the total enamel-dentine junction surface (estimation based on the specimen KA 194 which presents the highest degree of wear).
2.2. 3D dental tissue proportions and enamel distribution
We measured our dental parameters on the upper third molars (UM3) due to their lesser degree of wear compared to the other el-ements of the postcanine dentition. The dental crown was separated from the roots by virtually closing the enamel cap, following the curved cervical boundary (“Fill hole” module available on Avizo v8.0). This coronal volume embeds both the dentine material and pulp cavity. In addition to the overall crown, we evaluated the lateral aspect of the enamel thickness by virtually removing all the tooth occlusal to the deepest point of the enamel-dentine junction through a plane parallel to the cervix line (Toussaint et al., 2010; Benazzi et al., 2011; Macchiarelli et al., 2013). Three variables were measured in each specimen and for both the overall crown and the lateral portion: volume of the enamel cap (Ve, mm3), volume of the coronal dentine that includes the coronal aspect of the pulp chamber (Vcdp, mm3), and surface of the enamel-dentine junction (SEDJ, mm2). We then calculated two indices of enamel thickness: 3D average enamel thickness (3D AET, mm) calculated as the ratio between Ve and SEDJ, and 3D relative enamel thickness (3D RET) obtained through the ratio AET/(Vcdp)1/3*100 and allowing direct, scale-free comparisons (Kono, 2004; Olejniczak et al., 2008a). Intra- and inter-observer tests for measurement accuracy run by two observers in previous pub-lished studies using a similar analytical protocol revealed differences less than 5% (cf.Bondioli et al., 2010; Zanolli et al., 2014).
We detailed the 3D distribution of enamel across the UM3s by computing the distances between the occlusal and the enamel-dentine junction surfaces through the “Surface Distance” module on Avizo v8.0. The distances recorded were visualized at the outer enamel surface using a colour scale ranging from dark blue (“thinner”) to red (“thicker”) (Macchiarelli et al., 2008, 2013; Bayle et al., 2011).
2.3. Enamel-dentine junction morphology
To compare the EDJs among species, we used a landmark-free method that relies on the construction of group-average surface models and their deformation to the investigated surfaces (Durrleman et al., 2012a,b; Dumoncel et al., 2014). Surfaces are represented by a set of oriented faces and the comparison does not assume a point-to-point correspondence between samples as in
Table 1
List of the Plio-Pleistocene and extant cercopithecoid specimens/samples detailed by micro-focus X-ray tomography (mCT) and used for assessing tooth structural variation, tissue proportions and inner ear morphology.a
Specimen/sample Site/provenance* Source Stored at mCT equipment mCT acquisition
voxel size (mm)
Elements
UM3 crown UM3 EDJ SCC
Fossil taxa
Parapapio jonesi n ¼ 1 STS 565 Sterkfontein (Member 4) Freedman (1957),Eisenhart
(1974),Brain (1981),Jablonski (2002) Ditsongb Necsa1 71.9 1 e 1 Parapapio broomi n ¼ 5 MP 224**, STS 251, STS 354, STS 544, STS 564 Makapansgat (Member 4) Sterkfontein (Member 4) Freedman (1957, 1976), Eisenhart (1974),Brain (1981), Jablonski (2002),Heaton (2006),Williams et al. (2007), Gilbert (2013)
DitsongbWitsc Necsa1Pal. Centre2 30.5e81.6 2 4 2
Parapapio whitei n ¼ 3 MP 221**, STS 370B, STS 370C Makapansgat (Member 4) Sterkfontein (Member 4) Freedman (1957, 1976),Brain (1981),Jablonski (2002),Gilbert (2013)
DitsongbWitsc Necsa1Pal. Centre2 37.7e71.2 1 2 2
Parapapio sp. n ¼ 2 M 3133**, MP 208 Makapansgat (Member 4) Williams et al. (2007),Fourie et
al. (2008)
Witsc Pal. Centre2 78.7
e e 2
Papio angusticeps n ¼ 1 KA 194 Kromdraai A Freedman (1957),Brain (1981),
Gilbert (2013)
Ditsongb Necsa1 74.0 1 1
e
Papio robinsoni n ¼ 4 SK 536, SK 555,
SK 562, SK 602
Swartkrans (Member 1) Freedman (1957),Freedman and Brain (1977),Brain (1981), Jablonski (2002)
Ditsongb Necsa1 44.9e86.6 4 4
e
Papio sp. n ¼ 1 Swartkrans 3*** Swartkrans Ditsong catalogue; this study Ditsongb Necsa1 39.4 1 1
e
Dinopithecus ingens n ¼ 2 SK 554, SK 599 Swartkrans (Member 1) Freedman (1957),Brain (1981) Ditsongb Necsa1 88.3e95.7
e e 2
Gorgopithecus major n ¼ 2 KA 192, KA 193 Kromdraai A Freedman (1957),Brain (1981),
Jablonski (2002)
Ditsongb Necsa1 18.7e63.6 2 1
e
Theropithecus oswaldi oswaldi
n ¼ 1 SK 561 Swartkrans (Member 1) Freedman (1957),Freedman
and Brain (1977),Brain (1981), Jablonski (2002)
Ditsongb Necsa1 99.9 1 1 1
Theropithecus oswaldi darti
n ¼ 2 M 3073, MP 222 Makapansgat (Member 4) Maier (1972),Freedman (1976), Jablonski (2002),Jablonski and Frost (2010)
Witsc Pal. Centre2 71.2 1 2 2
Cercopithecoides williamsi n ¼ 5 M 3055, MP 3/ M 203/AD 1326-3, MP 36/M 236/AD 1326-6, STS 252, STS 559A Makapansgat (Member 4) Sterkfontein (Member 4) Mollett (1947),Freedman (1957),Maier (1970),Eisenhart (1974),Brain (1981),Jablonski (2002),Heaton (2006),Fourie et al. (2008),McKee et al. (2011)
DitsongbWitsc Necsa1
Pal. Centre2 51.4e78.7
1 1 5 Extant taxa Papio (anubis n ¼ 8, cynocephalus n ¼ 2, cynocephalus kindae n ¼ 5, hamadryas n ¼ 3, ursinus n ¼ 3)
n ¼ 21 Central Africa, Congo, Ethiopia, Mozambique, Zambia,
unknown provenance MNHNd MRACeAMNHf MHNTgUT-PSh AST-RX3FERMaT4 MIF5MEDES6 SEMATEC7 33.0e122.9 7 7 21
Theropithecus gelada n ¼ 3 Ethiopia MNHNdAMNHf AST-RX3MIF5 35.0e95.7 2 2 3
Lophocebus albigena n ¼ 4 Cameroon, Congo, Gabon MNHNdMRACe AST-RX3FERMaT4 33.0e66.2 4 4 4
Mandrillus (leucophaeus n ¼ 3, sphinx n ¼ 3)
n ¼ 6 Cameroon, Guinea MRACeMHNTg FERMaT4MEDES6 33.0e41.0 2 2 6
Cercocebus (atys n ¼ 2, torquatus n ¼ 2)
n ¼ 4 Cameroon, Liberia MRACe FERMaT4MEDES6 33.0e41.0 3 2 4
Macaca (mulatta n ¼ 1, nigra n ¼ 1, radiata n ¼ 1, sylvanus n ¼ 4, sp. n ¼ 1)
n ¼ 8 India, Senegal, unknown provenance AMNHfMHNTg FERMaT4MIF5MEDES6
SEMATEC7 33.0e41.0
3 3 8
Cercopithecus (cephus n ¼ 2, halmyni n ¼ 1, mona n ¼ 1)
n ¼ 4 Congo, Guinea MHNTg FERMaT4MEDES6 33.0e41.0 1 1 4
classical landmark-based geometric morphometric analyses. The deformations between surfaces are mathematically modelled as a “diffeomorphism”, i.e., a one-to-one deformation of the 3D space that is smooth, invertible and with a smooth inverse, which is particularly appropriate for comparing overall shapes and local orientation in the field of computational anatomy (Glaun"es and Joshi, 2006; Durrleman et al., 2014). From a set of surfaces, a mean shape, together with a set of initial control points located near its most variable parts, and a set of momenta parameterizing the de-formations of the mean shape to each individual, are estimated.
As a pre-processing step, unscaled EDJs were aligned, using the “Align Surface” module available on the software Avizo v8.0. Based on the deformation framework, we generated (i) a global mean shape (GMS) associated with a set of deformations from the GMS to each EDJ (hereinafter called “GMS-to-individuals”), computed from our complete sample, and (ii) a taxon mean shape (TMS) for each genus investigated in our study (except for the groups represented by one isolated individual, e.g., G. major and C. williamsi) repre-senting the deformation from the TMS and using the sample mean of the momenta recorded within the group (Fig. 1). Because it has been argued that teeth of Parapapio can be not be distinguished from those of Papio (Freedman, 1957; Heaton, 2006), we tentatively grouped the individuals together and performed analyses to explore the morphological variability of the two combined groups. In addition to GMS-to-individuals deformations, the GMS was also deformed to the TMS (hereinafter called “GMS-to-TMS”).Figure 1 illustrates how the GMS was deformed through the GMS-to-TMS process with a scale of displacements ranging from 0 to 1.5 mm.
Intraspecific and intrageneric variations were explored by per-forming a principal component analysis using the deformation momenta from TMS to individuals (hereinafter called “TMS-to-in-dividuals”) (Durrleman, 2010). Deformations along the two first axes illustrate how the TMS varies within the population from the mean to one time the standard deviation (
s
) (i.e., the square root ofthe corresponding eigenvalue). We particularly explored the vari-ability of the Parapapio and Papio groups (Fig. 2).
The magnitude of displacements recorded during the defor-mation process (i.e., GMS-to-individuals, GMS-to-TMS and TMS-to-individuals) were rendered by colour maps from dark blue (lowest values) to red (highest values) onto the EDJ surfaces (i.e., individual EDJ, TMS or ±
s
) (Figs. 1e2).2.4. Semicircular canal morphology
We investigated the morphology of the SCCs by using a semilandmark-based three-dimensional geometric morphometric approach (Gunz et al., 2012). Four curves placed along the outer inner ear surface were defined by semilandmark sets as follow: one along the common crus (formed by four equally spaced semiland-marks) and one for each SCC (20 equally spaced semilandmarks per canal). These four curves were delimited by landmarks located at the entrance of the common crus into the vestibule, the junction between the anterior and the posterior SCCs, the entrance of the three ampullae into the vestibule, and the entrance of the lateral semicircular canal into the vestibule. The conformations of the SCCs were comparatively assessed through a generalized Procrustes analysis (GPA;Bookstein, 1991).
2.5. Exploratory multivariate analysis
To test the contribution of internal craniodental structures for the diagnosis of cercopithecoid taxa, morphological variations recorded for each structure were statistically explored and their potential in discriminating groups evaluated. As a preliminary approach, we focused our study at the genus level. Accordingly, we
Table 1 (continued ) Specimen/sample Site/provenance* Source Stored at m CT equipment m CT acquisition voxel size ( m m) Elements UM3 crown UM3 EDJ SCC Erythrocebus patas n ¼ 2 Congo, Senegal MRAC eMHNT g FERMaT 4 33.0 1 2 1 Cholor ocebus (aethiops n ¼ 3, pygerythrus n ¼ 2) n ¼ 5 Congo, Republic of Cabo Verde, Senegal, South Africa MRAC eMHNT g FERMaT 4 33.0 4 4 5 Colobus (angolensis n ¼ 4, guereza n ¼ 11) n ¼ 15 Congo, Ethiopia, unknow n provenance (n ¼ 4) MNHN dMRA C e AMNH fMHNT g AST-RX 3FERMaT 4MIF 5 MEDES 6SEMATEC 7 33.0 e 6 6.2 5 7 15 Piliocolo bus (badius n ¼ 3, foai n ¼ 4) n ¼ 7 Congo, unknow n provenance (n ¼ 2) MRAC eAMNH f FERMaT 4MIF 5MEDES 6 33.0 e 4 1.0 1 1 7 aUM3: third upper molar; EDJ: enamel dentine-junction; SCC: semicircular canal. bDitsong National Museum of Natural History, Pretoria; cUniversity of the Witwatersrand, Johannesburg; dMus ! eum national d'Histoire naturelle, Paris; eMus ! ee royal de l'Afrique centrale, Tervuren (some specimens are published in Braga et al., 2015 ); fAmerican Museum of Natural History , New York; gMuseum d'Histoire naturelle de Toulouse (some specimens are published in Braga et al., 2015 ); hUniversit ! ede Toulouse, Paul Sabatier ( Braga et al., 2015 ). 1South African Nuclear Energy Corporation, Pretoria ( Hoffman and de Beer, 20 12 ); 2Palaeo sciences Centre, University of the Witwatersrand, Johannesburg; 3Acc " es Scienti fi que " ala Tomographie " aRayons-X, MNHN, Paris; 4Fluides Energie R ! eacteurs Mat ! eriaux et Transferts, Toulouse; 5Microscopy and Imaging Fac ility, AMNH, New York (data provided by Pr Eric Delson and the AMNH Depart ment of Mammalogy, some specimens were downloaded from www.morphosource.org , Duke University); 6Institut de M ! edecine et de Physiolog ie Spa tiales, Toulouse ( Brag a et al., 2015 ); 7Sematec Metrology, Oyonna x ( Braga et al., 2015 ). *Unless mention ed, the specimens from Sterkfontein and Swartkrans derive from Member 4 and Member 1 respectively and those from Makapansgat are from Member 4 ( Brain, 1981; Heaton, 2006 ). **Uncertain stratigraphic localization but an attribution to Member 4 is propose d by the catalogue of the University of the Witwatersrand for M 3133, and the descriptions of MP 221 and MP 224 by Freedman (1976) suggest an origin in Member 4. ***No previous publications are known for the specimen Swartkrans 3 labelled as Papio sp. in the catalogue.
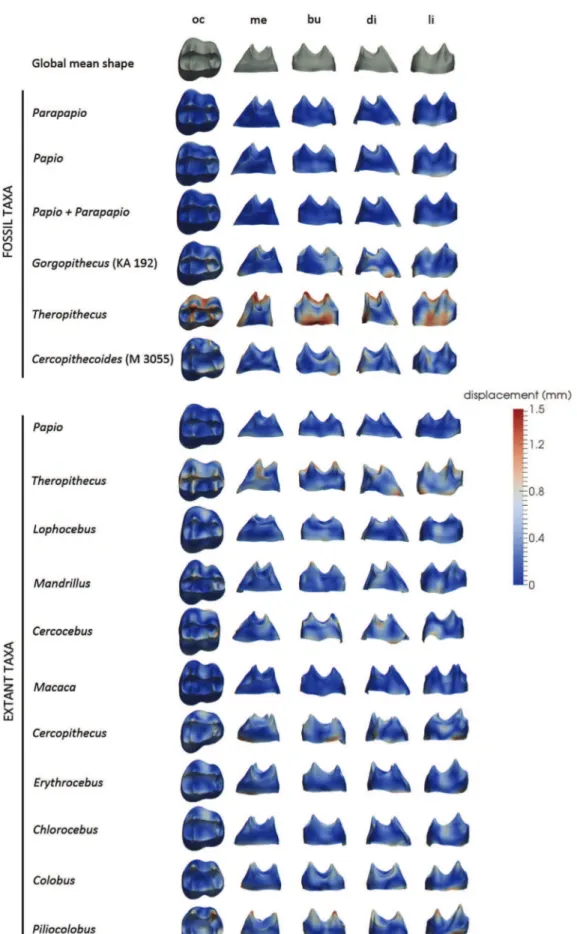
Figure 1. Comparative maps of morphological deformations from the mean template (GMS; top row) of the upper third molar enamel-dentine junctions (EDJs) computed for the overall cercopithecoid sample to the taxon mean shape (TMS) of Plio-Pleistocene and extant investigated taxa/groups. Regardless of their original side, all EDJs are shown as right and are imaged in occlusal (oc), mesial (me) buccal (bu), distal (di), and lingual (li) views. Cumulative displacement variations are rendered by a pseudo-colour scale ranging from dark blue (lowest values) to red (highest values).
performed a between-group principal component analysis (bgPCA) on both the GMS-to-individuals EDJ deformations and the Pro-crustes analysis of the SCCs. By projecting the data onto the principal components of the group means, the bgPCA is considered more efficient in assessing group separation in biology than the ordinary principal component analyses (Mitteroecker and Bookstein, 2011). Results of the GPA computed for the semilandmarks placed along the SCCs and distances computed between EDJ surfaces were also described by a canonical variate analysis (CVA). The CVA is a multivariate classification technique that maximizes the ratio of the between-group sum of squares to the within-group sum of squares through a discriminant function (Gittins, 1985). Given the comparative value of such analysis for statistical populations, we
described the major trends in the distribution of groups in the shape space. Instead of being considered as a tool for discrimina-tion, CVA is informative for interpreting the similarities shared by the groups constituted a priori.
A hierarchical clustering on principal components (HCPC) was performed using the GMS-to-individuals deformations with the package FactoMineR (L^e et al., 2008) for R v.3.2.1 (R Development Core Team, 2015). A hierarchical tree (or dendrogram) was ob-tained from the decomposition of the total variance (inertia) in between- and within-group variance. Contrary to the bgPCA or the CVA, the HCPC does not require any a priori classification and specimens are aggregated into clusters according to the distances (similarities) recorded between them.
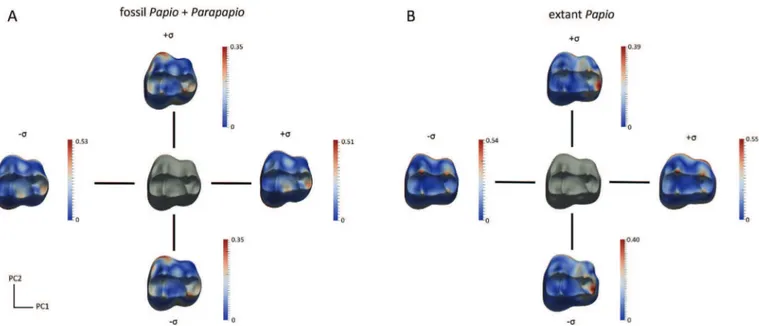
Figure 2. Morphological standard deviation of the taxon mean shape (TMS; in grey) of the upper third molar enamel-dentine junctions along the two axes computed for the Plio-Pleistocene group including both Papio and Parapapio (A) and for the extant Papio sample (B). Cumulative displacement variations (in mm) are rendered by a pseudo-colour scale ranging from dark blue (lowest values) to red (highest values).
Table 2
3D crown tissue proportions (including average and relative enamel thickness) of the third upper molar in some Plio-Pleistocene and extant cercopithecoid specimens/ samples.a
Specimen/sample Ve (mm3) Vcdp (mm3) SEDJ (mm2) 3D AET (mm) 3D RET
Fossil taxa Pp. broomi STS 544 191.8 238.0 215.0 0.9 14.4 MP 224 248.2 254.7 218.1 1.1 18.0 mean 220.0 246.4 216.5 1.0 16.2 P. robinsoni SK 536 427.7 541.5 374.0 1.1 14.0 SK 602 343.2 447.0 321.2 1.1 14.0 mean 385.4 494.3 347.6 1.1 14.0 Papio sp. Swartkrans 3 282.1 372.7 286.5 1.0 13.7 C. williamsi M 3055 129.9 196.3 177.6 0.7 12.6 Extant taxa Papio (n ¼ 4) mean 232.4 237.2 205.9 1.1 18.2
range 163.6e285.4 159.0e281.0 167.4e231.5 1.0e1.2 17.3e18.8
Lophocebus (n ¼ 3) mean 44.3 48.8 64.6 0.7 18.7
range 37.6e50.5 42.3e54.2 58.7e69.1 0.6e0.7 18.3e19.3
Mandrillus (n ¼ 1) 159.5 198.7 204.1 0.8 13.4
Cercocebus (n ¼ 3) mean 98.6 107.1 119.0 0.8 17.4
80.3e118.7 90.1e132.2 110.0e134.3 0.7e0.9 15.9e19.1
Macaca (n ¼ 2) mean 90.4 100.5 123.8 0.7 15.8
range 75.0e105.8 74.7e126.3 106.8e140.7 0.7e0.8 15.0e16.7
Chlorocebus (n ¼ 4) mean 33.6 45.1 66.3 0.5 14.3
range 27.3e40.4 32.6e50.4 53.5e72.6 0.4e0.6 11.5e16.0
Colobus (n ¼ 2) mean 49.8 58.0 81.1 0.6 16.0
range 49.5e50.1 52.5e63.5 74.7e87.6 0.6e0.7 14.3e17.7
3. Results
3.1. 3D dental tissue proportions and enamel distribution
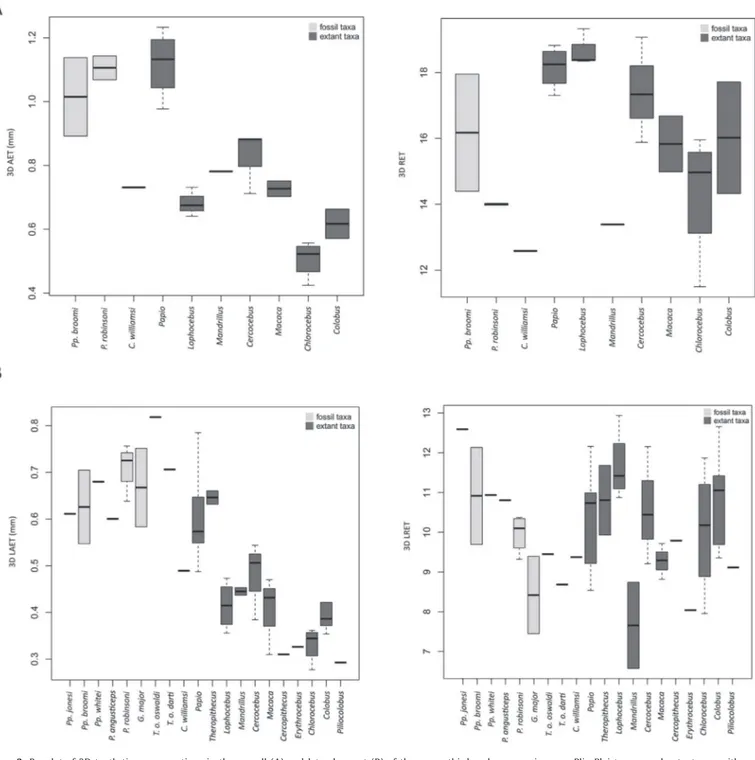
Estimates of whole crown tissue proportions for the UM3 in Plio-Pleistocene and extant cercopithecoid specimens/samples are shown inTable 2andFigure 3A. The 3D AET separates fossil Papio, extant Papio and Parapapio (with their higher average values) from Mandrillus and the small-bodied extant Lophocebus, Cercocebus, Macaca, Erythrocebus, Piliocolobus and Colobus. The
C. williamsi values fall within extant variation of Macaca and both Cercocebus and Lophocebus. The scale-free 3D RET is globally higher for extant Papio, Lophocebus and Cercocebus when compared to other living and fossil taxa (Fig. 3A). Because Swartkrans 3 was attributed at the genus level only, we did not include it in the comparative plots but its values, similar to those of P. robinsoni, are shown inTable 2.
Estimates of tissue proportions recorded in the lateral tooth portion are given inTable 3andFigure 3B. As for the whole crown proportions, the fossil taxa (including Theropithecus, Papio,
Figure 3. Boxplot of 3D tooth tissue proportions in the overall (A) and lateral aspect (B) of the upper third molar crown in some Plio-Pleistocene and extant cercopithecoid specimens/samples. 3D AET: 3D average enamel thickness; 3D RET: 3D relative enamel thickness; 3D LAET: 3D lateral average enamel thickness; 3D LRET: 3D lateral relative enamel thickness. Each boxplot presents the data minimum (i.e., lowest horizontal bar), the first quartile (i.e., lower edge of the box), median (i.e., bar inside the box), third quartile (i.e., upper edge of the box), and data maximum (i.e., highest bar).
Parapapio and Gorgopithecus) show higher 3D LAET than most species, with the exception of Papio and Theropithecus gelada. Values for T. o. oswaldi and C. williamsi lie near the upper and lower extremities of the Plio-Pleistocene species range, respectively. When compared to Parapapio and fossil Papio, the large G. major, T. o. oswaldi and T. o. darti fossil papionins display lower 3D LRET estimates.
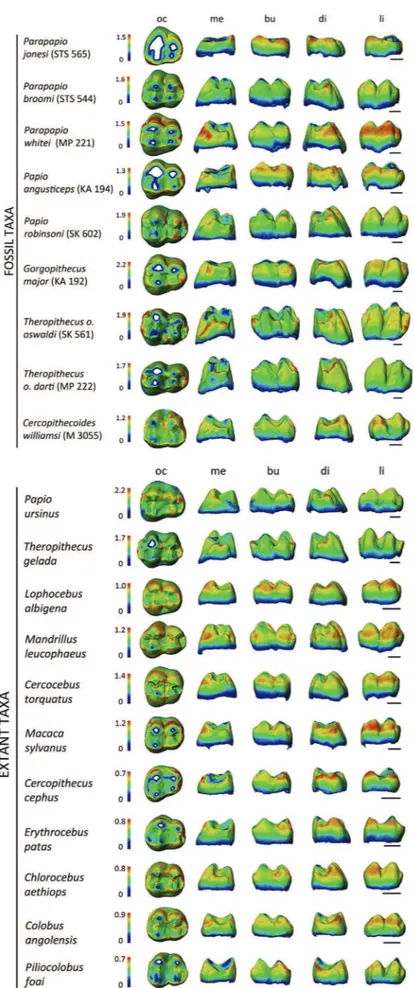
The cartographies that map topographic enamel thickness var-iations at the outer UM3 crown surface of some extant and Plio-Pleistocene cercopithecoid specimens are shown in Figure 4. In order to appreciate the differences in distribution, a scale ranging from zero to maximal values is proposed independently for each specimen. As anticipated by the LRET index, Parapapio and P. angusticeps, as well as the extant sample (excluding Papio and Theropithecus), display the thickest lateral enamel, especially along the lingual and the distal aspects. In contrast, Papio robinsoni shows localized areas of thick enamel mainly on the distal cusps, but also over the lingual side. This latter pattern of distribution is also found in extant Papio and Theropithecus, as well as in Plio-Pleistocene Theropithecus. The thin-enamelled condition seen in C. williamsi is close to the extant colobine pattern.
3.2. Enamel dentine junction morphology
The bgPCA analysis of EDJ shapes is shown inFigure 5and the colour maps illustrating the changes from the GMS to each TMS are
depicted inFigure 1. The maximum value of the colour bar (1.5 mm) represents the highest amount of displacement recorded in our analysis. The bgPC1 axis discriminates the mesiodistally elongated and buccolingually contracted EDJ of fossil Theropithecus, also characterized by higher reliefs compared to the GMS. Similar morphological trends are observed in the TMS of living Ther-opithecus. However, the amount of displacement computed is lower compared to the fossil representatives. Therefore, the former are plotted closer to the rest of the sample in the bgPCA analysis (Fig. 5).
Parapapio and fossil Papio overlap and are near Mandrillus, extant Papio and Macaca. Overall, their EDJs fit well with the GMS but differ in their slightly higher cusps. In order to evaluate the variability within fossil papionins, we grouped fossil Papio and Parapapio to compute a TMS of their EDJs (Fig. 1) and assess the deviation from the TMS along the two first axes of the principal component computed on the GMS-to-individuals de-formations (Fig. 2). According to the displacement maps, the distribution of the deformations among this group, as well as the magnitude, does not exceed the variability expressed by extant Papio.
Along bgPC1, Gorgopithecus is close to extant Theropithecus and Mandrillus, all showing a more contracted distal basin compared to the GMS. The only fossil colobine taxon included in our study, C. williamsi, plots in the positive values of the two axes, close to the colobines and Chlorocebus, Erythrocebus and Cercopithecus, and is Table 3
3D crown tissue proportions (including average and relative enamel thickness) of the lateral aspect of the upper third molar in some Plio-Pleistocene and extant cercopithecoid specimens/samples.a
Specimen/sample Vle (mm3) Vlcdp (mm3) SEDJL (mm2) 3D LAET (mm) 3D LRET Fossil taxa Pp. jonesi STS 565 47.3 114.3 77.3 0.6 12.6 Pp. broomi STS 544 53.8 179.8 98.3 0.5 9.7 MP 224 74.6 195.9 105.9 0.7 12.1 mean 64.2 187.8 102.1 0.6 10.9 Pp. whitei MP 221 86.6 240.3 127.4 0.7 10.9 P. angusticeps KA 194 59.5 171.7 99.1 0.6 10.8 P. robinsoni SK 536 121.5 394.5 160.6 0.8 10.3 SK 555 139.0 475.6 191.1 0.7 9.3 SK 562 80.0 268.9 125.3 0.6 9.9 SK 602 109.5 339.1 151.5 0.7 10.4 mean 115.5 366.8 156.0 0.7 10.3 Papio sp. Swartkrans 3 71.3 262.4 121.0 0.6 9.2 G. major KA 192 159.1 512.1 211.8 0.8 9.4 KA 193 106.9 481.0 183.1 0.6 7.4 133.0 497.6 197.5 0.7 8.4 T. o. oswaldi SK 561 221.7 649.2 270.9 0.8 9.5 T. o. darti MP 222 147.7 537.9 209.2 0.7 8.7 C. williamsi M 3055 36.7 142.2 75.1 0.5 9.4 Extant taxa Papio (n ¼ 7) mean 63.2 210.4 103.1 0.6 10.3
range 44.4e96.7 126.9e303.0 80.6e129.2 0.5e0.8 8.5e12.2
Theropithecus (n ¼ 2) mean 70.8 219.0 110.0 0.6 10.8
range 63.2e78.4 180.7e257.3 95.8e124.2 0.6e0.7 9.9e11.7
Lophocebus (n ¼ 4) mean 16.5 45.0 39.2 0.4 11.7
range 10.6e21.6 35.0e54.3 30.0e45.6 0.4e0.5 10.9e12.9
Mandrillus (n ¼ 2) mean 49.2 216.5 111.2 0.4 7.7
range 35.9e62.5 139.2e293.7 79.2e143.1 0.4e0.5 6.6e8.7
Cercocebus (n ¼ 3) mean 33.1 92.1 68.2 0.5 10.6
range 22.1e39.2 72.7e114.0 57.6e77.4 0.4e0.5 9.2e12.2
Macaca (n ¼ 3) mean 24.4 85.7 57.1 0.4 9.3
range 9.3e35.2 43.3e113.5 29.9e74.8 0.3e0.5 8.8e9.7
Cercopithecus (n ¼ 1) 9.2 31.8 29.8 0.3 9.8
Erythrocebus (n ¼ 1) 16.8 66.8 51.4 0.3 8.0
Chlorocebus (n ¼ 4) mean 11.3 37.3 34.3 0.3 10.0
range 9.1e12.8 26.1e42.3 25.8e39.0 0.3e0.4 8.0e11.9
Colobus (n ¼ 5) mean 15.0 48.3 38.6 0.4 10.8
range 12.4e18.5 36.9e62.7 29.4e49.7 e 9.4e12.7
Piliocolobus (n ¼ 1) 8.2 33.1 28.0 0.3 9.1
Figure 4. Enamel thickness cartographies of the upper third molar crown of some selected Plio-Pleistocene and extant cercopithecoid specimens. Topographic thickness variation is rendered by a pseudo-colour scale ranging from thinner dark-blue to thicker red; isolated spots correspond to enamel removal following wear. Independently from their original side, all crowns are shown as right and imaged in occlusal (oc), mesial (me), buccal (bu), distal (di), and lingual (li) views. Because of significant variation in enamel thickness between species, a specific colour scale is attributed to each specimen (in mm). Scale bars: 3 mm. Data for STS 544, MP 221, STS 565, KA 194, SK 602, KA 192, M 3055 are fromBeaudet et al. (2016).
characterized by marked relief on the lingual side and a particularly large distal basin compared to the GMS.
With regards to extant taxa, while overlapping along the first component, the bgPC2 axis better distinguishes the colobine taxa from the other extant monkeys because of higher distances be-tween distal and mesial pairs of cusps in comparison to the GMS. As a consequence, the lengths of transverse crests and the areas of the basins are expanded. The Lophocebus specimens form a distinct group on the positive side of bgPC1, close to Papio and Cercocebus, and Lophocebus and Cercocebus are characterized by more reduced distal and mesial basins and lower cusps than the GMS. The Erythrocebus and Cercopithecus individuals are near the Chlorocebus group. These groups are defined by higher buccal crests and para-cones compared to the global mean shape. Finally, relationships between taxa described by the CVA (Fig. 6) are similar to those observed with the bgPCA, except that in the former analysis the extinct Papio and Parapapio groups significantly overlap with extant Papio and Macaca.
For a better understanding of the distribution of morphological features in our sample, changes observed in the GMS-to-individuals deformations are synthesized through hierarchical clustering (HCPC) (Fig. 7). Seven groups (noted from “A” to “G”) are defined based on the level of the nodes. Primarily, the HCP dis-criminates the Colobini (group A) and Cercopithecini (group B) from the Papionini (Papio, Macaca, Mandrillus, Theropithecus, Cer-cocebus and Lophocebus). Most of the fossil specimens are included in groups E and F, together with Mandrillus, Macaca, and extant Papio specimens, with the notable exception of STS 251, included among the mangabeys (Lophocebus and Cercocebus, group C) and also Theropithecus. All members of this morpho-clade share an EDJ nearly undifferentiated from the global mean pattern, especially the fossil Papio and Parapapio specimens. The two T. o. darti (group D) specimens form an isolated group whereas the second Plio-Pleistocene Theropithecus taxon included in our study (T. o. oswaldi) is morphologically closer to T. gelada (group G). We observe that the EDJ shape distinguishes the mangabeys (group C) from the other papionins.
3.3. Semicircular canal morphology
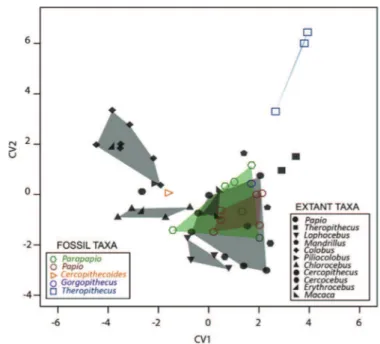
We first computed a bgPCA on the bony labyrinth Procrustes shape coordinates (Fig. 8). While extant Theropithecus, Piliocolobus, and Dinopithecus are reasonably discriminated from the rest of the sample, most of the taxa overlap. Given that the SCC morphology described in our sample does not clearly distinguish the genera represented in our sample, we further explored the relationship between groups by performing a CVA as shown inFigure 9A and 9B (for the three first components). The shapes at the extremities of the two axes illustrate the morphological variation trends along each component. The two D. ingens specimens fall very close to each other and approximate the extant Macaca distribution in the positive values of CV1, corresponding to a twisted lateral canal. Modern Theropithecus is set apart in the negative space of CV2 because of a larger diameter for the posterior semicircular canal, as compared to the other groups. While the Cercopithecoides in-dividuals approximate the condition of extant Colobus and Chlor-ocebus along the three axes, the fossil Theropithecus specimens are found between the extant groups without any clear trend. Among the extant sample, the Mandrillus estimate nears the Cercocebus one along the three axes whereas Lophocebus approximates the extant Papio variability in the negative space of CV1.
According to the loadings computed from the CVA and rendered by a colour scale onto the semilandmarks (Fig. 9C), the SCC areas that mostly contribute to the variability observed along the three axes are located around changes in slope on the posterior canal and near the intersections of the canals with the common crus.
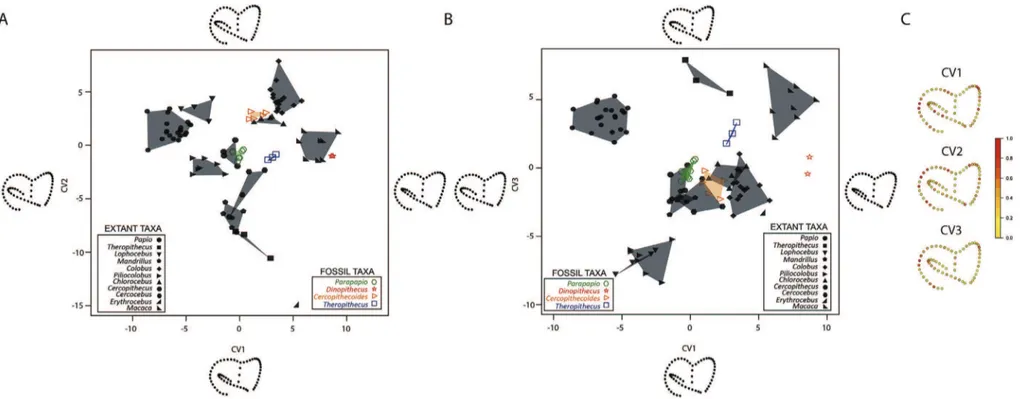
3.4. Comparing signals from the enamel-dentine junction and the semicircular canals
The comparison of the taxonomic signals extracted from the EDJ and the SCC was achieved through the selection of specimens that preserved both the third molar and the bony labyrinth (a total of 40 specimens, including six fossils). We performed a bgPCA and a CVA Figure 5. Between-group principal component analysis (bgPCA) of the
deformation-based shape comparisons of the upper third molar enamel-dentine junctions in some Plio-Pleistocene and extant cercopithecoid specimens. Unfilled coloured symbols represent the fossil taxa. Shaded areas correspond to convex hulls.
Figure 6. Canonical variate analysis (CVA) of the deformation-based shape compari-sons of the upper third molar enamel-dentine junctions in some Plio-Pleistocene and extant cercopithecoid specimens. Unfilled coloured symbols represent the fossil taxa. Shaded areas correspond to convex hulls.
for each structure and directly compared the results (Fig. 10AeD). On the whole, the interpretations in terms of affinities between genera are consistent between the two structures. Concerning the fossil specimens, Cercopithecoides plots close to Chlorocebus whereas Parapapio plots near the extant Papio group. Extinct and extant Theropithecus species are discriminated from the rest of the sample in all the four analyses, especially for teeth. The two Man-drillus individuals are found close to the Theropithecus specimens. In contrast, there is no distinct pattern in other papionin genera and Lophocebus, Cercocebus, Macaca and Papio cluster in most of the analyses. Finally, unlike with SCC morphology, the colobines Plio-colobus and Colobus are grouped together when EDJ shape is considered.
4. Discussion and conclusions
The use of virtual imaging in this study of extant and Plio-Pleistocene cercopithecoids brings fresh data to help understand fossil morphological variability and discrimination of taxa. Previous studies have demonstrated the utility of noninvasive imaging methods for the taxonomic assignment of isolated cercopithecoid remains (Beaudet, 2015; Beaudet et al., 2015, 2016). To the best of our knowledge, our current study represents the first combined 3D
virtual analyses of molar tissue proportions, EDJ morphology and inner ear shape in Plio-Pleistocene cercopithecoid assemblages. 4.1. Enamel thickness and enamel-dentine junction morphology
Previous bidimensional (2D) studies based on natural, histo-logical, or virtual sections of lower permanent molars have revealed thick enamel for the papionins Lophocebus, Cercocebus, Papio and Mandrillus in comparison with Colobus and the cercopi-thecins Cercopithecus, Chlorocebus and Erythrocebus (Kay, 1981; Shellis et al., 1998), a pattern supported by our analyses. While distinct mean values of relative enamel thickness were recorded for Lophocebus and Cercocebus byDumont (1995), in our study the two groups differ mainly in terms of variability (see ranges inTable 2). Our measurements of RET in molars are consistent with the results published byOlejniczak et al. (2008c)for Cercocebus (mean 17.6) but not for Macaca (mean 13.7) and Papio (mean 14.8), nor with those of extant macaques investigated byKato et al. (2014)(mean 12.2e14.1). Regarding specifically the enamel thickness recorded for Papio, our estimates for both AET and RET are in accordance with ranges proposed byGrine et al. (2005)andHlusko et al. (2004).
Relative enamel thickness (RET) values for extant papionins indicate an “intermediate/thick” enamel condition (sensuMartin, Figure 7. Hierarchical classification based on the distances computed from the deformation process of the upper third molar enamel-dentine junctions (GMS-to-individuals) in some Plio-Pleistocene and extant cercopithecoid specimens. The genus sampled at each terminal branch is coded by one number (listed above).
1985). However, we observe that, on the whole, fossil cercopithe-coids fit more confidently in the “intermediate/thin” enamel cate-gory. In comparison with large Plio-Pleistocene papionins G. major, T. o. oswaldi, T. o. darti and with the colobine C. williamsi, the scale-free LRET measured in fossil Papio and Parapapio is globally thicker. The adaptive significance of thick or thin enamel and the dietary assessments from enamel thickness values are unclear. However, it is noteworthy that significant differences in diet (more specifically in the proportion of C4-based resources intake) between
Plio-Pleistocene and extant South African cercopithecoids were described by isotopic and microwear analyses (Codron et al., 2005; El-Zaatari et al., 2005).
In agreement with the established classification of cercopithe-coid primates (Szalay and Delson, 1979; Strasser and Delson, 1987; Fleagle, 2013), EDJ shapes discriminate the three tribes Colobini, Cercopithecini and Papionini (Fig. 7). The inclusion of C. williamsi among the colobines and its separation from the rest of the contemporaneous cercopithecoid taxa suggests specific features for this species shared with extant colobine representatives (Szalay and Delson, 1979). Our structural investigation of the internal UM3 in fossil Theropithecus confirms its high degree of specializa-tion in EDJ morphology (sensuJablonski, 1993; Jablonski and Frost, 2010), already suggested from outer occlusal morphology (Jolly, 1972; Szalay and Delson, 1979; Jablonski, 1993). Also, in our ana-lyses, the large-bodied papionin G. major shows some similarities with extant and fossil Theropithecus in terms of enamel thickness and dental morphology, which may be interesting given a previous suggestion of phylogenetic affinities (Folinsbee, 2008; but see Gilbert, 2013). In accordance with external dental morphology (e.g., Freedman, 1957), the characterization of the morphostructural variations of the EDJ did not help to distinguish Parapapio from fossil Papio (Fig. 2) based on our current limited sample. The tentative interest of these features for the diagnosis of Papio and Parapapio may be supported or rejected only by enlarging both the extant and extinct samples.
Fossil Papio and Parapapio specimens share with Macaca an EDJ nearly undifferentiated from the global mean pattern.
Because Macaca is largely accepted as the sister taxon of the African papionins representing the ancestral morphotype (Delson, 1975), it could be hypothesized that the Plio-Pleistocene species of Papio and Parapapio were morphologically close to the ancestor shared with Macaca, and that Mandrillus and extant Papio (within the limits of our sample) retain the ancestral pattern. Moreover, it is significant that Gilbert (2013), in his phylogenetic studies of Plio-Pleistocene and extant papionins, found a crown group including Papio hamadryas, G. major and Papio angusticeps and suggested that this cluster constitutes a group of generalists. In contrast, the mangabeys and Ther-opithecus are derived compared to this ancestral pattern. Consequently, our preliminary analyses suggest that EDJ shape could be especially informative for discriminating and tracking the phylogenetic position of highly autapomorphic taxa such as Theropithecus. Similarities found in the EDJ morphology between Lophocebus and Cercocebus may be interpreted as parallel evo-lution from the ancestral condition. However, further analyses including a significantly larger mangabey sample are needed to investigate this hypothesis more finely.
The combination of statistical analysis of morphometric and volumetric variables has the potential to aid in discriminating taxa. In our study we illustrate the potential benefit of hierarchical clustering (HCPC) compared to classical component analyses (bgPCA, CVA) limited to two dimensions only (i.e., two compo-nents). More specifically, through this exploratory analysis the position of some particular specimens could be described and approaches proposed for future studies. For instance, based on the HCPC (Fig. 7), the fossil Theropithecus subspecies were separately classified, which potentially suggests distinct morphological af-finities; this needs to be tested with additional specimens. The possibility of distinguishing the two T. oswaldi subspecies, T. o. oswaldi and T. o. darti, based on EDJ morphology may be very valuable, especially because of the potential of dental features in the search for time-sensitive biological structures among the lineage (Jolly, 1972; Frost and Delson, 2002; Gilbert et al., 2014). Also, it is noteworthy that the Parapapio specimen from Sterk-fontein Member 4 (STS 251) is included among the mangabeys, given that dental affinities between papionins from Sterkfontein and extant Lophocebus have previously been mentioned (Heaton, 2006).
For direct comparisons of UM3 with other molars, the question of metameric variation in enamel thickness should be addressed in future studies, particularly because significant metameric variation was detected in extant baboon molar enamel (Hlusko et al., 2004). Moreover, by analysing 2D sections of Papio ursinus maxillary molars,Olejniczak et al. (2007)demonstrated that EDJ morphology varies along the molar row.
4.2. Semicircular canal morphology
Unlike the EDJ, inner ear morphology in Cercocebus specimens is closer to Mandrillus than to Lophocebus. Since molecular studies have consistently demonstrated a monophyletic Cercocebus and Mandrillus group (Disotell, 2000; Harris, 2000; Tosi et al., 2003), we can hypothesize that other affinities between taxa revealed by our SCC analyses are phylogenetically informative. Through the SCC analyses, extant Theropithecus was discriminated from the rest of the sample, suggesting a diagnostic pattern for this feature even if our analysis is, for now, limited to three individuals. The SCC morphology described in the large D. ingens differs from that of any other fossil specimens represented in our sample. Our study of one adult male (SK 599) and one juvenile female (SK 554) suggests that our criteria may be considered as appropriate to investigate taxo-nomic affinities, independent of sex attribution or developmental Figure 8. Between-group principal component analysis (bgPCA) of the
Procrustes-registered shape coordinates of the bony labyrinth morphology computed for some Plio-Pleistocene and extant cercopithecoid specimens. Unfilled coloured symbols represent the fossil taxa. Shaded areas correspond to convex hulls.
Figure 9. Canonical variate analysis (CVA) of the Procrustes-registered shape coordinates of the bony labyrinth morphology calculated for some Plio-Pleistocene and extant cercopithecoid specimens and computed for the components CV1 and CV2 (A) and CV1 and CV3 (B). The shapes at the extremities of the axes illustrate the morphological variation trends along each component. Contributions of the semilandmarks to the total variance observed (standardized loadings) along each component are rendered by a colour scale (C). Unfilled coloured symbols represent the fossil taxa. Shaded areas correspond to convex hulls.
stage (Freedman, 1957). However, given the large size estimated for Dinopithecus, a potential allometric influence cannot be discounted pending further analyses.
Spoor and Zonneveld (1998), by investigating the inner ear morphology of extant cercopithecoids as part of their comparative sample for the characterization of the human condition, revealed similarities between human labyrinthine morphology and that of large cercopithecoids. In this context, homoplasy was suggested to be responsible for these similarities, and Macaca was proposed to represent the ancestral labyrinthine morphology of the anthro-poids, and probably all primates (shared with hylobatids, ateloids and prosimians). Interestingly, the condition displayed by Dinopi-thecus approximates that of Macaca, potentially suggesting the retention of a primitive state of the inner ear that is not shared with contemporaneous fossil taxa.
On the whole, variations of SCC shape are not demonstrated here as efficient diagnostic features for extinct cercopithecoid taxa using classical discriminant analyses (Fig. 8), but they are informative for the detection of morphological affinities (Fig. 9). These results could likely be explained by the combination of functional signals, influenced by locomotor behaviour. Because agility and head movements were proved to influence semi-circular canal configurations (Spoor et al., 2002; Malinzak et al., 2012), and given that cercopithecoid taxa (both extant and extinct) considered in this study are mainly semi-terrestrial
(Jablonski and Frost, 2010; Fleagle, 2013), the relative homoge-neity described for the inner ear could be due to the lack of lo-comotor diversity.
4.3. Combined use of craniodental internal structures
By directly comparing taxonomic signals extracted from the EDJ and the SCC of the same individuals, our analysis suggests the value of combining various internal structures. The consistency of our analyses tends to suggest that these two structures could be independently considered for taxonomic studies and provide convergent conclusions. However, the pattern displayed by the variations of EDJ shape is closer to the current taxonomy, notably by grouping the colobines together. One intriguing result that should be explored in the future is the proximity of C. williamsi to the guenon Chlorocebus. Also, further analyses focussing on papionin taxa would be valuable for the understanding of morphological affinities within this tribe, as they were not clearly discriminated in our study.
Acknowledgements
We are indebted to S. Potze (Pretoria), B. Zipfel (Johannesburg), J. Cuisin (Paris), G. Fleury (Toulouse), E. Gilissen and W. Wendelen (Tervuren) for having granted access to fossil and comparative Figure 10. Between-group principal component analysis (bgPCA) and canonical variate analysis (CVA) of the deformation-based shape comparisons of the upper third molar enamel-dentine junctions (bgPCA: A; CVA: C) and of the Procrustes-registered shape coordinates of the bony labyrinth morphology (bgPCA: B; CVA: D) in selected Plio-Pleistocene and extant cercopithecoid specimens that preserve both structures. Unfilled coloured symbols represent the fossil taxa. Shaded areas correspond to convex hulls.
material under their care. We also thank K. Carlson and T. Jashashvili (Johannesburg), G. Cl!ement and M. Garcia-Sanz (Paris) for microtomographic acquisitions and E. Delson (New York) for providing CT scans. For scientific contribution and/or for discussion and comments on the results presented in this study, we are especially grateful to E. Delson (New York), S. Durrleman (Paris), S. Elton (Durham), D. Ginibriere (Toulouse), J. Heaton (Birmingham), L. Hlusko (Berkeley), N. Jablonski (University Park), O. Kullmer (Frankfurt), R. Macchiarelli (Poitiers and Paris), M. Nakatsukasa (Kyoto), L. Pan (Toulouse), C. Zanolli (Pretoria and Toulouse). The present version greatly benefited from the comments provided by the Editor, the Associate Editor and three anonymous reviewers. The French research federation FERMaT (FR3089), the National Research Foundation (NRF) and Department of Science and Tech-nology (DST) of South Africa are acknowledged for providing micro-X-ray tomography laboratory facility. This project was granted access to the HPC resources of CALMIP supercomputing centre under the allocation 2015-[P1440] attributed to the labora-tory AMIS. Research supported by the Centre of Research and Higher Education (PRES) of Toulouse, the Midi-Pyr!en!ees Region and the French Ministry of Foreign Affairs.
References
Bayle, P., Bondioli, L., Macchiarelli, R., Mazurier, A., Puymerail, L., Volpato, V., Zanolli, C., 2011. Three-dimensional imaging and quantitative characterization of human fossil remains. Examples from the NESPOS database. In: Macchiarelli, R., Weniger, G.C. (Eds.), Pleistocene Databases. Acquisition, Stor-ing, Sharing. Wissenschaftliche Schriften des Neanderthal Museums 4, Mett-mann, pp. 29e46.
Beaudet, A., 2015. Caract!erisation des structures cr^anio-dentaires internes des cercopith!ecoïdes et !etude diachronique de leurs variations morphologiques dans la s!equence Plio-Pl!eistoc"ene sud-africaine. Ph.D. Dissertation, Universit!e de Toulouse.
Beaudet, A., Zanolli, C., Engda Redae, B., Endalamaw, M., Braga, J., Macchiarelli, R., 2015. A new cercopithecoid dentognathic specimen attributed to Theropithecus from the late Early Pleistocene (c. 1 Ma) deposits of Simbiro, at Melka Kunture, Ethiopian highlands. Palevol 14, 657e669.
Beaudet, A., Braga, J., de Beer, F., Schillinger, B., Steininger, C., Vodopivec, V., Zanolli, C., 2016. Neutron microtomography-based virtual extraction and analysis of a cercopithecoid partial cranium (STS 1039) embedded in a breccia fragment from Sterkfontein Member 4 (South Africa). Am. J. Phys. Anthropol. 159, 737e745.
Benazzi, S., Fornai, C., Bayle, P., Coquerelle, M., Kullmer, O., Mallegni, F., Weber, G.W., 2011. Comparison of dental measurement systems for taxonomic assignment of Neanderthal and modern human lower second deciduous molars. J. Hum. Evol. 61, 320e326.
Bettridge, C.M., Dunbar, R.I.M., 2012. Modeling the biogeography of fossil baboons. Int. J. Primatol. 33, 1278e1308.
Bondioli, L., Bayle, P., Dean, C., Mazurier, A., Puymerail, L., Ruff, C., Stock, J.T., Volpato, V., Zanolli, C., Macchiarelli, R., 2010. Morphometric maps of long bone shafts and dental roots for imaging topographic thickness variation. Am. J. Phys. Anthropol. 142, 328e334.
Bookstein, F.L., 1991. Morphometric Tools for Landmark Data: Geometry and Biology. Cambridge University Press, Cambridge.
Braga, J., Thackeray, J.F., Dumoncel, J., Descouens, D., Bruxelles, L., Loubes, J.-M., Kahn, J.-L., Stampanoni, M., Bam, L., Hoffman, J., de Beer, F., Spoor, F., 2013. A new partial temporal bone of a juvenile hominin from the site of Kromdraai B (South Africa). J. Hum. Evol. 65, 447e456.
Braga, J., Loubes, J.-M., Descouens, D., Dumoncel, J., Thackeray, J.F., Kahn, J.-L., de Beer, F., Riberon, A., Hoffman, K., Balaresque, P., Gilissen, E., 2015. Dispropor-tionate cochlear length in genus Homo shows a high phylogenetic signal during apes' hearing evolution. PLOS ONE 10 (6), e0127780.http://dx.doi.org/10.1371/ journal.pone.0127780.
Brain, C.K., 1981. The Hunters or the Hunted? An Introduction to African Cave Taphonomy. University of Chicago Press, Chicago.
Broom, R., 1940. The South African Pleistocene cercopithecid apes. Ann. Transv. Mus. 20, 89e100.
Codron, D., Luyt, J., Lee-Thorp, J.A., Sponheimer, M., de Ruiter, D., Codron, J., 2005. Utilization of savanna-based resources by Plio-Pleistocene baboons. S. Afr. J. Sci. 101, 245e248.
Dechow, P.C., Singer, R., 1984. Additional fossil Theropithecus from Hopefield, South Africa: a comparison with other African sites and a revaluation of its taxonomic status. Am. J. Phys. Anthropol. 63, 405e435.
Delson, E., 1973. Fossil colobine monkeys of the Circum"Mediterranean region and the evolutionary history of the Cercopithecidae (Primates, Mammalia). Ph.D. Dissertation, Columbia University.
Delson, E., 1975. Evolutionary history of the Cercopithecidae. In: Szalay, F.S. (Ed.), Approaches to Primate Paleobiology, Contributions to Primatology 4. Karger, Basel, pp. 167e217.
Delson, E., 1984. Cercopithecoid biochronology of the African Plio-Pleistocene: correlation among eastern and southern hominid-bearing localities. Cour. Forsch. Inst. Senckenberg 69, 199e218.
Delson, E., 1988. Chronology of South African australopiths site units. In: Grine, F.E. (Ed.), Evolutionary History of the ‘Robust’ Australopithecines. Aldine de Gruyter, New York, pp. 317e324.
Delson, E., Dean, D., 1993. Are Papio baringensis R. Leakey, 1969, and P. quadratirostris Iwamoto, 1982, species of Papio or Theropithecus? In: Jablonski, N.G. (Ed.), Ther-opithecus: the Rise and Fall of a Primate Genus. Cambridge University Press, Cambridge, pp. 157e189.
Disotell, T.R., 2000. Molecular systematics of the Cercopithecidae. In: Whitehead, P.F., Jolly, C.J. (Eds.), Old World Monkeys. Cambridge University Press, Cambridge, pp. 29e56.
Dumoncel, J., Durrleman, S., Braga, J., Jessel, J.-P., Subsol, G., 2014. Landmark-free 3D method for comparison of fossil hominins and hominids based on endocranium and EDJ shapes. Am. J. Phys. Anthropol. 153, 110.
Dumont, E.R., 1995. Enamel thickness and dietary adaptation among extant pri-mates and chiropterans. J. Mammal. 76, 1127e1136.
Durrleman, S., 2010. Statistical models of currents for measuring the variability of anatomical curves, surfaces and their evolution. Ph.D. Dissertation, University of Nice-Sophia Antipolis.
Durrleman, S., Pennec, X., Trouv!e, A., Ayache, N., Braga, J., 2012a. Comparison of the endocranial ontogenies between chimpanzees and bonobos via temporal regression and spatiotemporal registration. J. Hum. Evol. 62, 74e88.
Durrleman, S., Prastawa, M., Korenberg, J.R., Joshi, S., Trouv!e, A., Gerig, G., 2012b. Topology preserving atlas construction from shape data without correspon-dence using sparse parameters. In: Ayache, N., Delingette, H., Golland, P., Mori, K. (Eds.), Proceedings of Medical Image Computing and Computer Aided Intervention. Nice, France, pp. 223e230.
Durrleman, S., Prastawa, M., Charon, N., Korenberg, J.R., Joshi, S., Gerig, G., Trouv!e, A., 2014. Morphometry of anatomical shape complexes with dense deformations and sparse parameters. NeuroImage 101, 35e49.
Eisenhart, W.L., 1974. The fossil cercopithecoids of Makapansgat and Sterkfontein. A.B. Thesis, Harvard College.
El Zaatari, S., Grine, F.E., Teaford, M.F., Smith, H.F., 2005. Molar microwear and di-etary reconstruction of fossil Cercopithecoidea from the Plio-Pleistocene de-posits of South Africa. J. Hum. Evol. 49, 180e205.
Elton, S., 2001. Locomotor and habitat classification of cercopithecoid postcranial material from Sterkfontein Member 4, Bolt's Farm and Swartkrans Members 1 and 2, South Africa. Palaeont. Afr. 37, 115e126.
Elton, S., 2006. Forty years on and still going strong: the use of hominin-cercopithecid comparisons in paleoanthropology. J. R. Anthropol. Inst. 12, 19e38.
Elton, S., Bishop, L.C., Wood, B., 2001. Comparative context of Plio-Pleistocene hominin brain evolution. J. Hum. Evol. 41, 1e27.
Fleagle, J.G., 2013. Primate Adaptation and Evolution. Academic Press, New York.
Folinsbee, K.E., 2008. Evolutionary history and biogeography of papionin monkeys. Ph.D. Dissertation, University of Toronto.
Fourie, N.H., Lee-Thorp, J.A., Ackermann, R.R., 2008. Biogeochemical and cranio-metric investigation of dietary ecology, niche separation, and taxonomy of Plio-Pleistocene cercopithecoids from the Makapansgat Limeworks. Am. J. Phys. Anthropol. 135, 121e135.
Freedman, L., 1957. The fossil Cercopithecoidea of South Africa. Ann. Transv. Mus. 23, 121e262.
Freedman, L., 1976. South African fossil Cercopithecoidea: a re-assessment including a description of new material from Makapansgat, Sterkfontein and Taung. J. Hum. Evol. 5, 297e315.
Freedman, L., Brain, C.K., 1977. A re-examination of the cercopithecoid fossils from Swartkrans (Mammalia: Cercopithecidae). Ann. Transv. Mus. 30, 211e218.
Frost, S.R., 2001. Fossil Cercopithecidae of the Afar depression, Ethiopia: species systematics and comparison to the Turkana Basin. Ph.D. Dissertation, The City University of New York.
Frost, S.R., 2007. Fossil Cercopithecidae from the Middle Pleistocene Dawaitoli Formation, Middle Awash Valley, Afar Region, Ethiopia. Am. J. Phys. Anthropol. 134, 460e471.
Frost, S.R., Delson, E., 2002. Fossil Cercopithecidae from the Hadar Formation and surrounding areas of the Afar Depression, Ethiopia. J. Hum. Evol. 43, 687e748.
Gantt, D.G., 1977. Enamel of primate teeth: its structure with reference to functional and phyletic implications. Ph.D. Dissertation, Washington University.
Gilbert, C.C., 2007a. Craniomandibular morphology supporting the diphyletic origin of mangabeys and a new genus of the Cercocebus/Mandrillus clade, Procerco-cebus. J. Hum. Evol. 53, 69e102.
Gilbert, C.C., 2007b. Identification and description of the first Theropithecus (Pri-mates: Cercopithecidae) material from Bolt's Farm. South Africa. Ann. Transv. Mus. 44, 1e10.
Gilbert, C.C., 2008. African papionin phylogenetic history and Plio-Pleistocene biogeography. Ph.D. Dissertation, Stony Brook University.
Gilbert, C.C., 2013. Cladistic analysis of extant and fossil African papionins using craniodental data. J. Hum. Evol. 64, 399e433.
Gilbert, C.C., Frost, S.R., Delson, E., 2013. Appearance of the modern baboon, Papio hamadryas, in the Plio-Pleistocene fossil record: Evidence from South Africa. Am. J. Phys. Anthropol. 129.