DEVELOPMENT OF ANAL YTICAL METHOD FOR TRACE LEVEL ANAL YSIS OF RETINOIC ACID
MASTER THESIS
IN PARTIAL FULFILMENT OF REQUIREMENTS FOR THE DEGREE OF MASTER OF SCIENCE IN CHEMISTRY
BY OMID ABADI
UNIVERSITÉ DU QUÉBEC À MONTRÉAL Service des bibliothèques
Avertissement
La diffusion de ce mémoire se fait dans le respect des droits de son auteur, qui a signé le formulaire Autorisation de reproduire et de diffuser un travail de recherche de cycles supérieurs (SDU-522 - Rév.01-2006). Cette autorisation stipule que «conformément à l'article 11 du Règlement no 8 des études de cycles supérieurs, [l'auteur] concède à l'Université du Québec à Montréal une licence non exclusive d'utilisation et de publication de la totalité ou d'une partie importante de [son] travail de recherche pour des fins pédagogiques et non commerciales. Plus précisément, [l'auteur] autorise l'Université du Québec à Montréal à reproduire, diffuser, prêter, distribuer ou vendre des copies de [son] travail de recherche à des fins non commerciales sur quelque support que ce soit, y compris l'Internet. Cette licence et cette autorisation n'entraînent pas une renonciation de [la] part [de l'auteur] à [ses] droits moraux ni à [ses] droits de propriété intellectuelle. Sauf entente contraire, [l'auteur] conserve la liberté de diffuser et de commercialiser ou non ce travail dont [il] possède un exemplaire.»
DÉVELOPPEMENT D'UNE MÉTHODE D'ANALYSE DE TRACE DEL' ACIDE RÉTINOÏQUE
MÉMOIRE
PRÉSENTÉ
COMME EXIGENCE PARTIELLE DE LA MAÎTRISE EN CHIMIE
PAR OMID ABADI
AVERTISSEMENT
La diffusion de ce mémoire se fait dans le respect des droits de son auteur, qui a signé le formulaire autorisation de reproduire et de diffuser un travail de recherche de cycles supérieurs. Cette autorisation stipule que conformément à l'article 11 du règlement no 8 des études de cycles supérieurs concède à l'Université du Québec à Montréal une licence non exclusive d'utilisation et de publication de la totalité ou d'une partie importante de travail de recherche pour des fins pédagogiques et non commerciaux. Plus précisément, l'auteur autorise l'Université du Québec à Montréal à reproduire, diffuser, prêter, distribuer ou vendre de copies de son travail de recherche à des fins non commerciales sur quelque support que ce soit, y compris l'internet. Cette licence et cette autorisation n'entraînent pas une renonciation de la part de l'auteur à ses droits moraux ni à ses droits de propriété intellectuelle. Sauf par entente contraire, l'auteur conserve la liberté de diffuser et de commercialiser ou non ce travail dont il possède un exemplaire.
dosage des rétinoïdes par la chromatographie liquide à haute performance (CLHP) et il est repris par les équipes de recherche de professeur Breau et de professeur Tra du département de chimie de l'UQAM.
Plus précisément, l'objectif de mon projet était l'analyse au mveau de trace le tout-trans acide rétinoïque (ttAR) et ses métabolites dans un milieu physiologique (milieux de culture de cellules P 19 de carcinome embryonnaire de souris). Bien que les résultats n'aient pas atteint le niveau attendu et que certaines limites expérimentales aient été rencontrées, cette étude a pennis la mise sur pied d'un protocole de quantification au niveau de trace par la méthode sensible de CLHP-ESI-SM/SM et aussi un protocole d'extraction optimisé dans un milieu physiologique simulé. Ce protocole pourra être utilisé pour étudier l'effet de concentration de l'acide rétinoïque sur sa voie métabolique et les anomalies résultant d'un manque ou d'un excès de rétinoïde qui ont été observées chez les animaux ou chez l'homme. Cette méthode fournirait une sensibilité nécessaire pour la quantification de l' AR afin élucider la fonction de l 'AR dans la neurogénèse, la morphogénèse et la contribution des altérations de l'homéostasie de l 'AR telles que celles observées dans la maladie d'Alzheimer, le diabète du type 2, l'obésité et le cancer.
REMERCIEMENTS
Au terme de ce travail, je tiens tout d'abord à exprimer mes vifs remerciements à mes directeurs de recherche, le Professeur Huu Van Tra et le Professeur Li vain Breau, pour m'avoir accueilli en recherche. J'ai apprécié toutes ces expériences et j'en ai profité pour apprendre et évoluer dans un milieu scientifique motivant.
Mes remerciements vont aussi à Dr. Phuong Nguyen qui a été toujours présente pour m'aider. Son soutien et sa grande expérience qu'elle a mise à ma disposition, ont pennis un bon déroulement du projet.
Je remercie aussi l'UQAM pour son soutien financier via le programme Études-Travail, lequel m'a permis de me consacrer à temps plein à ce projet.
Je remercie le Professeur Pierre Pichet, le Professeur Mohamed Siaj et le Dr. Abdelhaq Rami pour leurs suggestions.
Je remercie aussi Mme Sylvie Lemieux et Mme Sonia Lachance respectivement pour l'aide technique et le suivi administratif.
Mes remerciements sont adressés aux nombreuses personnes qui ont toujours répondu à mes questions et m'ont donné des conseils.
Je tiens à exprimer mes vifs remerciements et ma sincère gratitude aux évaluateurs qui ont accepté de lire ce document et l'enrichit par ses commentaires.
Aucune dédicace ne saurait être assez éloquente pour exprimer ce que tu mérites pour tous les sacrifices que tu n'as cessé de faire pour moi depuis ma naissance, durant mon enfance et même à l'âge adulte. Tu as fait plus qu'une mère puisse faire pour que ses enfants suivent le bon chemin dans leur vie.
 la mémoire de mon père
Aucune dédicace ne saurait exprimer l'amour, l'estime, le dévouement et le respect que j'ai toujours eus pour toi. Ce travail est le fruit des sacrifices que tu as consentis pour mon éducation et ma formation.
 mon amour
Merci pour tes encouragements, tu as toujours su trouver les mots qui conviennent pour me remonter le moral dans les moments pénibles, grâce à toi pu sunnonter les difficultés.
- --
-TABLE OF CONTENT
LIST OF FIGURES ... xi
LIST OF TABLES ... xv
LIST OF ABBREVIA TI ONS, SIGLES AND ACRONYMES ... xvii
LIST OF SYMBOLS ... xviii
RÉSUMÉ ... xx
ABSTRACT ... xxi
INTRODUCTION ... 1
CHAPTER I RETINOIC ACID CHEMISTRY 1.1 History of Vitamin A and the Retinoids ... 5
1.2 Structures, Nomenclature and Classification of the Retinoids ... 6
1.2.1 Structure ... 6
1.2.2 Nomenclature.: ... 6
1.2.3 Classification ... 7
1.3 Isomerization and Degradation Products ... 8
1.4 Source of Vitamin A ... 10
1.5 Physiological Roles of Vitamin A. ... 11
1.5.1 Vision ... 11 1.5.2 Embryonic Development.. ... 11 1.5.3 Cellular Differentiation ... 12 1.5.4 Reproduction ... 12 l.5.5 Immune System ... 12 1.5 .6 Oncology ... 13 1.5. 7 Dermatology ... 13
CHAPTER II METHODOLOGY
2.1 Reported Methods for RA Analysis ... 16
2.2 Categorisation for RAs ... 16
2.2.1 HPLC-UV ... 17
2.2.2 High Sensitivity Method (HPLC-ESI-MS/MS) ... 18
2.3 High Sensitivity Instrumentation (HPLC-ESI-MS/MS) ... 20
2.3 .1 Ion Source and Ionization Technique ... 21
2.3.2 Mass Spectrometer. ... 26
2.4 Buffer Choice ... · ... 28
2.4.1 Strategies for Choosing the Right Buffer. ... 28
2.4.2 Advantages of the Presence of Volatile Buffer in the Mobile Phase ... 29
2.5 Extraction Method ... 30
2.6 Challenges Encountered in Trace Analysis Method Development for atRA ......... 32
CHAPTER III EXPERIMENTAL SECTION 3.1 Physico-Chemical Properties of atRA ... 34
3.2 Handling, Storage and Laboratory Precaution ... : ... 34
3.3 The Polarity and Solubility of Retinoids ... 35
3.4 Chemical Products and Solvents ... 36
3 .5 Solution Preparation ... 3 6 3.5.1 Stock, Mother and Standard Solutions ... 36
3.5.2 Buffer Preparation ... 37
Sodium Acetate O.OlM ... 37
Ammonium Acetate O.lM ... 38
Preparation of Acidified Hexanes ... 38
IX
CHAPTER IV
METHOD DEVELOPMENT CLASSIFICATION AND OPTIMIZA TION
4.1 Initial Method Development and Optimization (atRA Pharmacological Study) ... .40
4.1.1 Ultra Violet (UV) and Fluorescent Spectroscopy Studies ... .41
4.1.2 Evaluation of atRA Mother Solution Stability ... .43
4.1.3 atRA Light Sensitivity Study ... .43
4.1.4 Comparison between Evaporation and Calibration Curves for atRA ... ...... .46
4.1.5 atRA Pharmacological Level Extraction at Buffered Mobile Phase ... .46
4.2 Final Step of Method Development (atRA Physiological Level) ... 52
4.2.1 Qualitative Assay Using HPLC-ESI-MS/MS Method ... 52
4.2.2 Quantitative Assays Using HPLC-ESI-MS/MS Method ... 62
Assays with Non-Buffered Mobile Phase ... 62
Effect of Presence of Acid in a Non-Buffered Mobile Phase Extraction Recovery Rate ... 63
Effect of Acid in Organic Extraction Sol vents (Hexanes) on Profile of the Extracted atRA Spectra ... 64
Results Obtained from Analysis by HPLC-UV and HPLC-ESI- MS/MS ... 66
Comparison of atRA Recovery Rate Analysis by HPLC-UV and HPLC-ESI-MS/MS Using a Non-Buffered Mobile Phase ... 68
Assay with Buffered Mobile Phase ... 70
HPLC ... 70
Extraction of atRA with EtOAc : Acidified Hexanes and Analysis by HPLC-ESI-MS/MS Using Buffered Mobile Phase ... 83
Comparison of atRA Extracts Analysed by HPLC-ESI-MS/MS Using Buffered or Non-Buffered Mobile Phase ... 84
Optimized Extraction Conditions for atRA Analysis ...... 85
CHAPTER V
RESULTS AND DISCUSSION
5.1 atRA Analytical Parameters ofUV, FLU and
HPLC-ESI-MS/MS ... 88
5.2 Recovery Rate of atRA Extracted in Aqueous and Serum-Supplemented Cell Culture Media ... 94
5.2.1 Analysis of atRA Extracts in Aqueous Media ... 94
5.2.2 Analysis of atRA Extracted from Serum-Supplemented Cell Culture Media aMEM:FBS (90: 10, v/v) ... 99
5 .3 Comparison of Our Methods vs Other Validated Assays ... 101
5 .4 Advantages of Our Methods ... 104
5.5 Disadvantages of Analytical Methods ... 103
CHAPTER VI CONCLUSION ... 104
CHAPTRE VII PERSPECTIVES ... 106
APPENDIXA Developed Protocol for Quantification of atRA by HPLC 2695 Separation Module ... 107
APPENDIXB Mass and Composition of Cell Culture Media Amem ... 109
XI
LIST OF FIGURES Pages
1.1 atRA Chemical Structure ... 7
1.2 Chemical Structures ofNatural and Synthetic Retinoids and Derivatives ... 8
2.1 Components of a Mass Spectrometer. ... 20
2.2 Mechanism of Electrospray Ionization ... 22
2.3 Diagram ofNegative Electrospray Ionization ... 26
2.4 Schematic Diagram of a Triple Quadrupole Mass Spectrometer.. ... 27
4.1 UV Absorbance Spectrum of atRA Recorded between 250 to 470 nm at a Concentrationof 15µg/mL in MeOH ... .41
4.2 Fluorescence Emission Spectrum of atRA at a Concentration of 15 µg/mL in MeOH Using 343 nm at the Excitation Wavelength ... 42
4.3 Stability Evaluation of atRA by HPLC-UV Analysis of a Mother Solution (lOµg/mL) Over 16 Days ... .43
4.4 Comparison of HPLC-UV Chromatograms of atRA and Isomerization Products Obtained from an Exposed (Table 4.3 Entry 1; dashed line) and Unexposed (Table 4.3 Entry 6; solid line), Mother Solution (10 µg/mL) ... ..45
4.5 Comparison of atRA (Blue) vs Products Generated from Varied Exposures to Light (Red) ... 45
4.6 Corn pari son between Evaporation and Calibration Curves for atRA ........ .46
4.7 Schematic of atRA Liquid-Liquid Extraction ... .49
4.8 Effect of atRA Sample Volume on Extraction Recovery Rate ... 50
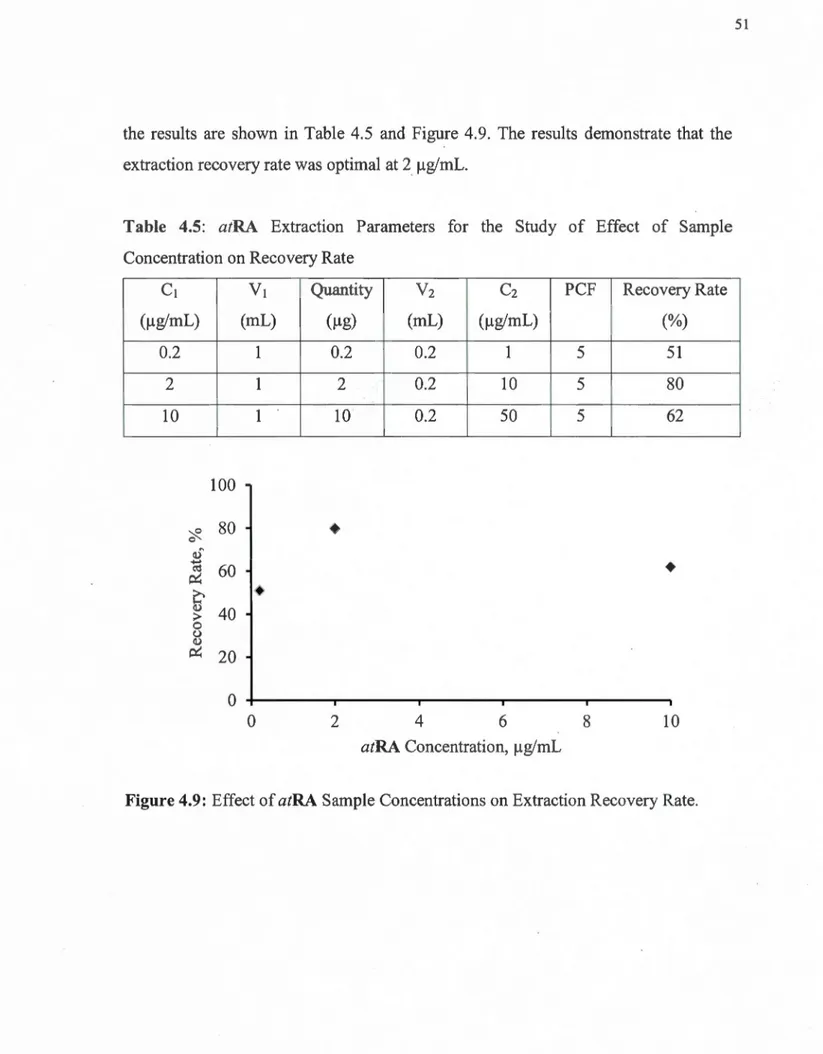
4.9 Effect of atRA Sample Concentrations on Extraction Recovery Rate ... 51
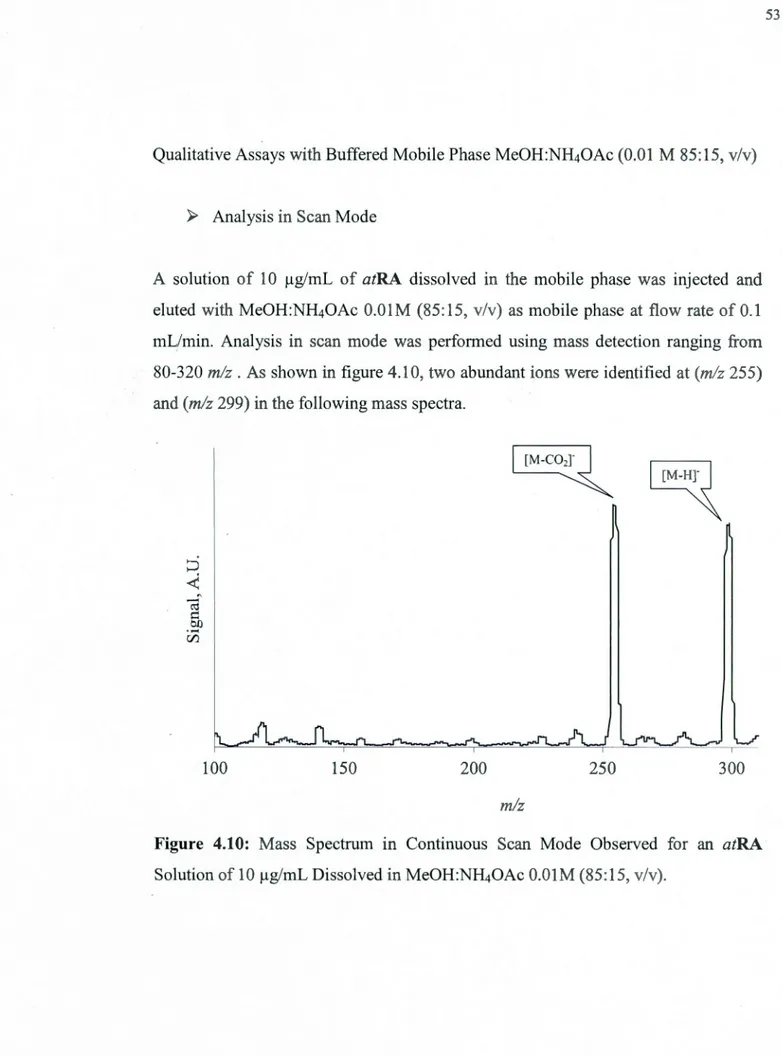
4.10 Mass Spectrum in Continuous Sean Mode Observed for an atRA Solution of lOµg/mL Dissolved in MeOH:NH40Ac O.OlM (85:15, v/v) ... 53
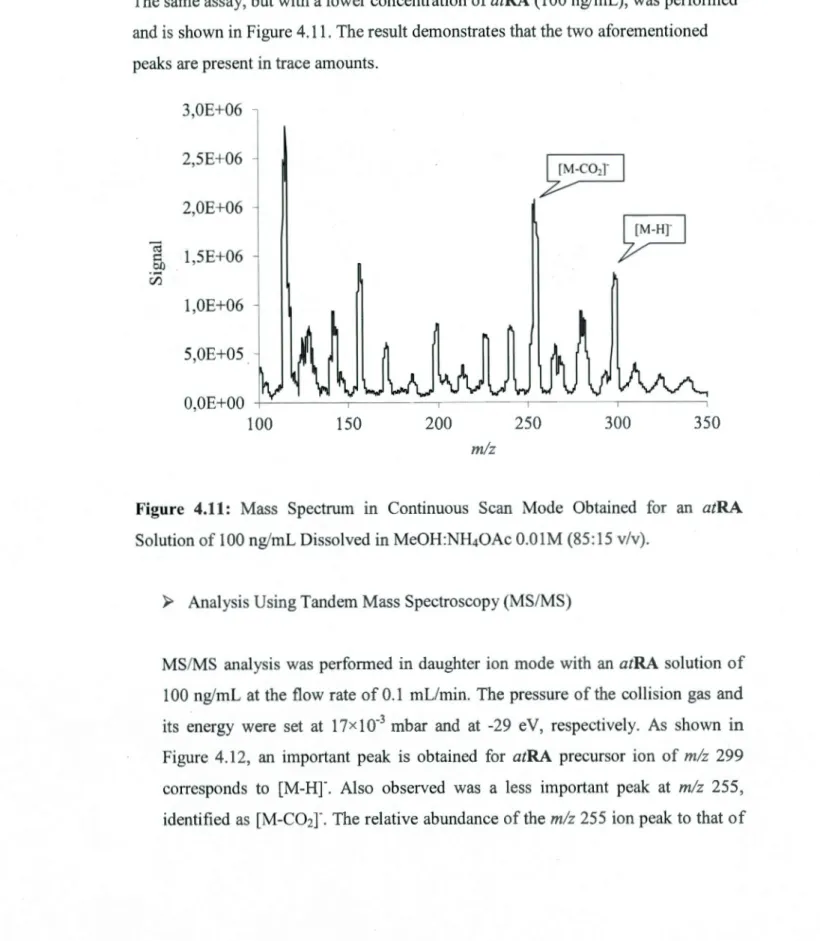
4.11 Mass Spectrum in Continuous Sean Mode Obtained for an atRA Solution of lOOng/mL Dissolved in MeOH:NH40Ac O.OlM (85:15, v/v) ... 54 4.12 MS/MS Mass Spectra in Daughter Mode of an atRA Solution of 1 OO ng/mL
Dissolved in MeOH:NH40Ac O.OlM (85: 15, v/v) ... 55 4.13 Effect of Collision Energies on Signal Intensity of the Precursor (blue) and
Daughter (red) Ions for atRA Solution of 1 OO ng/mL Dissolved in
MeOH:NH40Ac 0.01 M (85:15, v/v) ... 56 4.14 MS/MS Mass Spectra in Daughter Mode of an atRA Solution of 1 OO ng/mL
Dissolved in MeOH:HOAc lmM (75:25, v/v) ... 57 4.15 MS/MS Spectrum of an atRA Solution of 1000 ng/mL in the Presence of Argon
(l.9x10-3 mbar) Dissolved in MeOH:HOAc lmM (75:25, v/v) ... 58 4.16 MS/MS Spectra of an atRA Solution of 1000 ng/mL Dissolved in MeOH:HOAc
lmM (75:25, v/v).in Absence of Argon ... 59 4.17 MS/MS Mass Spectra of an atRA Solution of 10 ng/mL Dissolved in
MeOH:HOAc lmM (75:25, v/v) ... 60 4.18 Comparison of Extraction Recovery Rate for 80 ng of atRA with Non-Buffered
Mobile Phase ACN:H20 : HOAc (95:4.8:0.2, v/v dashed line) and
ACN:H20:HOAc(95:4.99:0.01, v/v solid line) ... 64 4.19 Chromatograms of atRA Solution Extracted with EtOAc: Hex 50:50 v/v
Containing Different Amounts of Acid HCl ( 4 N) ... 65 4.20 Recovery Rate of atRA from Aqueous Solution and Analysed by HPLC-UV
Using a Non-Buffered Mobile Phase ACN:H20:HOAc (95:4.99:0.01, v/v) with Low Flow Rate (0.2 mL/min) ... 66 4.21 atRA Recovery Rate from Aqueous Extracts Analysed by HPLC-ESI-MS/MS
at a LowFlow Rate 0.2 mL/min Using a Non-Buffered Mobile Phase
ACN:H20:HOAc (95:4.99:0.01, v/v) ... 67 4.22 Comparison of Extraction Recovery Rates of atRA by Different Analytical
Methods (HPLC-UV and HPLC-ESI-MS/MS) for Different Quantities of atRA (40 and 80 ng),Using a Non-Buffered Mobile Phase ACN:H20:HOAc
X111
(95:4.99:0.01, v/v) ... 68 4.23 atRA Standard Solution Reproducibility Using a Non-Buffered Mobile Phase
ACN:H20:H0Ac (95:4.99:0.01, v/v) ... 69 4.24 Comparison of Chromatograms of lµg/mL atRA Analysed by HPLC-UV Eluted
With MeOH:NH40Ac O.OlM (80:20, v/v) vs MeOH: NH40Ac O.OlM (90:10, v/v) ... 74 4.25 Chromatograms for Comparison of 1 µg/mL atRA Solution Eluted with Mobile
Phase ACN:NH40Ac O.OlM (95:5, v/v) vs Me0H:NH40Ac O.OlM
(95:5,v/v) ... 75 4.26 atRA Chromatograms Obtained for the 4 Mobile Phase Listed in Table 4.14 .... 77 4.27 Comparison of Signal Shapes and Retention Time Using MeOH: NH40Ac
O.OlM (95:5, v/v) for a solution of atRA on Two C18 Columns i.e. the
Phenomenex Kinetex and Waters X-Terra MS ... 80 4.28 atRA Chromatograms Obtained for the 4 Different Desorption Solutions List in
Table 4.17 Mobile phase ACN:NH40Ac O. lM (95:5, v/v) ... 82 4.29 Comparison of Recovery Rates Obtained from Extraction of 10, 20 and 80 ng
Of atRA From a 0.4 ml Aqueous Solution Using EtOAc: Acidified Hexanes (50:50,v/v) with HCl 4N or Glacial HOAc ... 83 4.30 Comparison of Chromatograms Obtained for Extractions of20 ng of atRA
Using 0.12% v/v vs 0.25 % v/v of Acetic Acid in Hex:EtOAc (50:50, v/v) as Organic Extraction Sol vents ... 84 4.31 Comparison of Extraction Recovery Rates of atRA Determined by
HPLC-ESI-MS/MS Using Buffered and Non-Buffered Mobile Phase ... 85 5.1 Comparison of atRA Standard Calibration Curves Analysed by HPLC-UV and
5.2 Comparative Sensitivity of HPLC-UV vs HPLC-FLU for the Analysis of a
Solution of atRA in Mobile Phase (100 ng/mL) ... 91 5.3 atRA Standard Calibration Curve Analysed by HPLC-UV ... 92 5.4 atRA Standard Calibration Curve Analysed by HPLC-ESI-MS/MS ... 93 5.5 Sensitivity of HPLC-UV vs HPLC-ESI-MS/MS Analysis of an atRA Standard
Solution (75 ng/tnL) ... 94 5.6 Analysis of Extracted in Aqueous Media by HPLC-UV at a Low Flow Rate ... 96 5.7 atRA Recovery Rate in Aqueous Media Analysed by HPLC-ESI-MS/MS ... 98 5.8 atRA Analysis of Extrac in Serum-Supplemented Cell Culture Media
XV
LIST OF TABLES Pages
2.1 List of Buffers used for atRA Method Development... ... 29 3 .1 List oflnstruments U sed for atRA Method Development... ... 3 8
4.1 Defined Concentrations and Quantities in Method Development.. ... 39
4.2 Spectroscopie Characteristics for a Solution of atRA in MeOH (15 µg/mL) ... .42 4.3 Type of Vial and Presence or Not of Light for Solution of atRA (Entries 1 to are
for Figures 4.4 and 4.5) ... 44 4.4 atRA Extraction Parameters for Samples Volumes and Extraction Recovery
Rate ... 50 4.5 atRA Extraction Parameters for the study of effect of Sample Concentration on
Recovery Rate ... 51 4.6 Signal Intensity of Daughter Ion /Precursor Ions Ratio vs Collision Energies
Using the Buffered Mobile Phase Me0H:NH40Ac 0.01 M (85: 15 ,v/v) ... 56 4.7 Parameters for Analysis of atRA by ESI-MS/MS ... 60 4.8 atRA Extraction Parameters for Analysis by HPLC-UV Using ACN:H20:HOAc
(95:4.99:0.01, v/v) ... 66 4.9 atRA Extraction Parameters for Analysis by HPLC-ESI-MS/MS Using
ACN:H20:HOAc(95:4.99:0.01 v/v) ... 67 4.10 Chromatographie Charactersitics of atRA Standard Solutions Using a Mobile
Phase ACN:H20:HOAc (95:4.99:0.01, v/v) ... 70 4.11 Composition of Mobile Phase Study for Method Development... ... 72 4.12 Chromatographie Characteristics Obtained for atRA Eluted with Mobile Phase
Me0H:NH40Ac 0.01 M (80:20, v/v) versus MeOH:NH40Ac O.OlM (90:10, v/v) Using a Column Waters X-Terra MS ... 74
4.13 Chromatographie Characteristics Obtained for atRA Eluted with ACN :NH40Ac O.OlM (95:5, v/v)
ve
rsus
MeOH:NH40Ac O.OlM (95:5, v/v) Using a Waters X-Terra MS Column ... 75 4.14 Chromatographie Data for 4 Different Compositions of Mobile Phase ... 7 6 4.15 Listed Stationary Phases Studied For Method Development.. ... 78 4.16 Chromatographie Information ofTwo Different C18 Columns PhenomenexKinetexand Waters X Terra MS) Using Mobile Phase MeOH:NH40Ac 0.1 M (95:5,v/v) ... 79 4.17 atRA Desorption Solutions Chromatographie Data ... 82 5.1 Comparison of Analytical Parameters for HPLC-UV and HPLC-FLU ... 92 5.2 Comparison of Analytical Parameters for HPLC-UV and HPLC-ESI MS/MS ... 94 5.3 atRA Extraction Recovery Rate in Aqueous Media Obtained Using HPLC-UV
Analysis ... 96 · 5.4 Extraction Recovery Rate in Aqueous Media Obtained Using HPLC-ESI-MS/MS
Analysis ... 97 5.5 Comparison of atRA Recovery Rates from Aqueous Media Obtained Using
HPLC-UV and HPLC-ESI-MS/MS ... 99 5.6 atRA Recovery Rate from Serum-Supplemented Cell Culture Media aMEM FBS
(90:10,v/v) Obtained by HPLC-UV Analysis ... 100 5.7 Comparison of atRA Extract Recovery Rates from Aqueous and Se
rum-Supplemented Cell Culture Media aMEM:FBS (90: 10, v/v) Obtained by HPLC -UV Analysis ... l 02 5.8 Comparison of Ours
vs
Other Validated Analytical Methods ... 103at aMEM ACS ACN HO Ac B.C. CE CID DISP ESI EtOAc FBS GC-MS HCl Hex HPLC HPLC-UV
LIST OF ABREVIATION SIGLES AND ACRONYMES
all-trans Isomer
Alpha Minimum Essential Medium
American Chemical Society
Acetonitrile Acetic Acid Buffer Capacity Collision Energy
Collision-Induced Dissociation
Direct Infusion Syringe Pump Electrospray Ionization Ethyl Acetate
Fetal Bovine Serum
Gas Chromatography Mass Spectroscopy
Hydrochloric Acid Hexane
High Performance Liquid Chromatography
High Performance Liquid Chromatography with Ultra Violet Detector
HPLC-FLU High Performance Liquid Chromatography with Fluorescence Detector
HPLC-ESI-MS/MS High Performance Liquid Chromatography with Tandem Mass Spectroscopy Using Electrospray Ionization
ID LLE LOD MS MW P/D Intemal Diameter Liquid-liquid Extraction Limit of Detection Mass Spectroscopy Molecular weight Particular Diameter
RA Retinoic Acid (Acide Rétinoïque)
RAL Retinal
RAR Retinoic Acid Receptor RXR Retinoid X Receptor
NH40Ac Ammonium Acetate
L/h Litres per hour
NaOAc Sodium Acetate
XlX
LIST OF SYMBOLS
A.U. Arbitrary Unit
eV electron Volt % Percentage 0 Degree
o
c
Degree, Celsiusc
Concentration D Density g gram µL Microlitre µg Microgram M Molar mg Milligram min Minute mL Milliliter mB Millibar SD Standard Deviation V Volt V volumev/v volume per volume
fmole Femto Mol (10-15 mol)
ppb Part Per Billion
ppm Part Per Million
m/z Mass to Charge
organismes. Il agit sur l'expression génique.
Le ttAR a plusieurs propriétés pharmacologiques et physiologiques utiles en
dermatologie et dans le traitement de différents cancers sensibles aux rétinoïdes. Par exemple, la leucémie promyélocytaire aiguë est sensible au ttAR avec un taux de réponse de 90%. Un niveau anormal du ttAR peut permettre ou provoquer la dégénérescence épithéliale, comme la xérophtalmie et des troubles neurologiques comme dans la schizophrénie et les maladies, d'Huntington, de Parkinson et
d' Alzheimer.
Une méthode sensible pour la quantification au niveau de trace du ttAR dans le milieu
aqueux et un milieu de culture cellulaire supplémenté en sérum a été développée avec
succès. La méthode consiste en un chromatographe liquide à haute performance
(CLHP). La quantification a été effectuée sur une colonne de séparation Cl 8 avec
élution isocratique dans un temps total d' élution de 25 minutes avec un ionisateur par
l'électronébulisation (ESI) en mode négatif et couplée à un analyseur comprenant
deux spectromètres de masse triple quadripolaire en tandem (SM/SM). Un mélange d'acétonitrile et de tampon d'acétate d'ammonium 0.1 M a été utilisé comme phase mobile pour faciliter la fonnation de paires d'ions au cours de l 'électronébulisation.
Dans les conditions optimales, le ttAR génère un ion abondant correspondant à l'anion carboxylate [M-H] -de m/z 299 et un ion moins abondant correspondant à [M-C02 ]
-de m/z 255. La limite de détection de la méthode d'analyse est de 1 ng/mL à un
rapport SIN de 3 pour le milieu aqueux analysé par CLHP-ESI-SM/SM et de 10 ng/mL analysé par CLHP-UV. La méthode CLHP-ESI-SM/SM est 10 fois plus
sensible que la méthode CLHP-UV.
L'extraction liquide-liquide a été appliquée à la séparation, pré-concentration et détermination du ttAR pour des échantillons dans les milieux mentionnés. Les
paramètres d'extraction ont été optimisés pour la récupération maximale ttAR. La
limite d'extraction avec le facteur de pré-concentration de 2 est de 5 ng avec un taux de récupération de 34 % pour le milieu aqueux analysé par CLHP-ESI-SM/SM et la limite de l'extraction pour le milieu de culture cellulaire supplémenté en sérum est
inconnue à cause de limitation du temps du projet. Un essai d'extraction effectué sur
50 ng a donné un taux de récupération de 60% lorsqu'analysé par la méthode
CLHP-UV. La méthode pourrait être raffinée pour détecter les métabolites du ttRA.
Mot clé : L'acid tout-trans rétinoïque (ttAR), analyse de trace, CLHP-ESI-SM/SM, CLHP-UV, milieu aqueux, milieu de culture cellulaire supplémenté en sérum aMEM:
ABSTRACT
All-trans retinoic acid (atRA) is an active metabolite of vitamin A which has important physiological functions. atRA controls cellular proliferation and differentiation, is essential in development and growth of organisms and acts on genes expression. atRA has several pharmacological and physiological properties useful in dermatology and in the treatment of several cancers that are sensitive to retinoids. For example, acute promyelocytic leukemia is particularly sensitive to atRA with response rate of 90%. Abnormal atRA levels may cause or permit epithelial degeneration such as in xerophthalmia and neurological disorders such as in Schizophrenia, Parkinson's, Huntington's and Alzheimer's diseases.
A sensitive method was successfully developed for the quantification of atRA present at trace level in aqueous and serum supplemented cell culture media. The method uses an HPLC coupled to triple quadruple mass spectrometer using electrospray ionisation interface source (ESI) in negative mode. The separation was done on a C 18 column using an isocratic elution time of 25 min. A mixture of acetonitrile and aqueous ammonium acetate O.lM buffer was used as mobile phase, employed to facilitate ion pair formation in mobile phase during negative ion electrospray. atRA fonned an abundant ion [M-Hr of mlz=299 for the RA carboxylate anion and a less abundant ion for [M-Co2r m/z=255. Under optimal conditions, the instrumental detection limit of atRA were 1 ng/mL at SIN ratio of 3 for aqueous media analysed by HPLC-ESI -MS/MS and 10 ng/mL when analysed by HPLC-UV. HPLC-ESI-MS/MS method was found to be 10 times more sensitive than HPLC-UV method for aqueous solution. Liquid-liquid extraction was applied for separation, pre-concentration and determination of atRA in aqueous and serum supplemented cell culture media. The extraction limit with a pre-concentration factor of 2 in aqueous media was 5 ng with a 34% of recovery rate analysed by HPLC-ESI-MS/MS. As the result of time limitations, the extraction limit for serum-supplemented cell culture media aMEM: FBS (90: 10, v/v) was not determined. An extraction was performed at the quantity of 50 ng with a recovery rate of 60% analysed by HPLC-UV. The method could be refined to detect atRA metabolites.
Key words: all-trans Retinoic Acid (atRA), Trace level analysis, HPLC-ESI-MS/MS, HPLC-UV, Aqueous media, Serum-supplemented cell culture media aMEM: FBS (90: 10, v/v), Liquid-Liquid extraction.
(Chapman, 2012). Three forms of vitamin A and derivatives (Retinol, Retinal and Retinoic acid) are active in the body with their specific physiological roles (Tatum
and Chow, 2005). Vitamin A doesn't have a direct physiological function in vivo but
rather serves as precursor for the biologically active retinoids (Kane et al., 2008).
Retinoids are natural or synthetic derivatives of vitamin A (De Luka, 2003).
Retinoids are important micronutrients in human diet and is taken up as retinol (Ruhl,
2006). Retinol is a form of vitamin A that is found in animal food sources (Chapman,
2012). Retinoids include vitamin A compounds such as retinol, retinal and retinoid
derivatives and related molecules that bind to retinoid receptors which are
subsequently responsible for specific biological response such as embryonic
development, differentiation, proliferation and apotosis (Bushue and Yvonne, 2010 ;
Van Breemen et al., 1998). Retinoic acid (RA) is produced when retinol is initially
oxidized to retinal (RAL) by retinol dehydrogenase enzymes and then irreversibly
converted to RA by retinal dehydrogenase enzymes (Gundersen, 2005). The most
important biological activity occurs when retinol is transformed into RA by oxidation
(McCaffery et al., 2002). RA is a ligand for nuclear retinoic acid receptors (RAR)
and retinoic X receptors (RXR), which mediate its biological effects. An excess of, or
a deficiency in RA can cause malformation during embryonic development
(Gundersen, 2005 ; Sôderlund, Fex and Nilsson-Ehle 2005). RA can isomerize at
several of its double bonds into various isomers. Among these, all-trans retinoic acid
(atRA, tretinoin) and 9-cis-RA (alitretinoin) will bind and activate RAR and RXR. These receptors act as transcription factors controlling the multiplication of normal
and cancerous cells. These two isomers are the most biologically active retinoids. In
addition 13-cis- RA (isotretinoin) is anti-inflammatory and act as an anti-tumour
-cis-RA) are used clinically in dermatology and oncology (Cox, Muccio and Hamilton, 2013). atRA and 9-cis-RA are only minor metabolites of retinol and beta-carotene. However, they show 1 OO to 1000 fold higher biological activity than either precursor. atRA binds to RAR while 9-cis-RA binds to both RAR and RXR (Roos et al., 1998). Unfortunately, atRA is only present in very small quantity in human serum or plasma (Eckhoff and Nau, 1990).
Pl9 stem cells are an embryonic carcinoma cells which can be easily cultivated, growing continuously in serum-supplemented media (McBumey, 1993 ). These cells are useful for the study of the early stages of neuronal differentiation in vitro. Stem cells have been found to provide an attractive alternative for the research and treatment of neurodegenerative diseases such as Parkinson's, Alzheimer's and Huntington's disease (Wu et al., 2010). It was also shown that P19 stem cells provide a useful model for physiological study of RA activity (Solari et al., 2010). For example, exposing P 19 cells to RA will promo te their aggregation and induces their differentiation in neuronal cells (Jones-Villeneuve et al., 1983 ).
Three important factors for method development are quantity level, resolution and media of analysis. In order to address these factors, the experiments were divided into two main groups related to the concentration and quantity range:
• Micro molar concentration or pharmacological level.
• Nano molar concentration or physiological level (Marillet al., 2003).
The words high concentration related to pharmacological level and low concentration related to physiological level.
The development of highly sensitive methods of atRA quantification (µg to ng) is required for the following reasons:
• RA isomerization occurs at very low concentrations. Furthermore, RA isomers have been shown to be active at nano molar concentration in vivo in many tissues (Van Merris et al., 2002).
• Different doses of atRA act differently on cells (Bidad et al., 2011 ).
• At pharmacological concentration (µM), which is relatively high for atRA, there is the decrease in the viability of immature dendrite cells (Bidad et al., 2011).
• RA is only useful in specific concentration and an overdose of vitamin A is associated with toxicity (Van Breemen and Huang, 1996).
• Pharmacokinetic delay to atRA was observed in oral administration of patients (Idres, Gerald and Flexor, 2001; Marill et al., 2003).
• Cellular intake resistance was observed in presence of high concentrations (µM) of RA in vitro (Marill et al., 2003).
• A rapid decrease of atRA concentration m plasma was observed m oral administration (Choi et al., 2003).
• An increase in the concentration of the RA isomers causes a dramatic shift in the metabolic pathway of these retinoids (Van Merris et al., 2002).
• Biological effects on cell proliferation similar to those of atRA were observed at higher concentration in vitro for more polar and less active metabolites such as 4-oxo-RA and 13-cis-RA (Van Merris et al., 2002).
Information on the physiologie concentrations of all-trans and 13-cis-RA is lacking for newboms and pregnant women (Soderlund, Fex and Nilsson-Ehle, 2005).
• RA is highly soluble oil which can diffuse into cell membranes (Kam et al., 2012).
Quantification of RA relies heavily on resolution because the desired RA isomers have different polarities and, therefore, different affinities for RAR and RXR. This
causes them to act differently in vivo (Lan vers et al., 1996; McCaffery et al., 2002 ; Van Merris et al., 2002).It is beneficial to initiate study of atRA in vitro since it has
recently been shown that atRA metabolites are active in vitro against human leukemia cells, inhibiting their growth and maturation (Idres et al., 2001 ).
Among a series of isomers, atRA was chosen as an analyte of interest in method
development because atRA has a relatively higher plasmatic concentration level
compared to other retinoids and is responsible for most of the biological effects of vitamin A. It has a wide spectrum of biological activities such as cell growth,
differentiation and morphogenesis. Furthermore, it is a precursor of several
metabolites such as 4-0H-RA, 4-oxo-RA, 18-0H-RA and 5,6-epoxy-RA. atRA can
also be isomerised to 9-cis-RA and 11-cis-RA. Therefore, the study of atRA has
priority over the other isomers for the development of a sensitive and selective
method for the trace analysis of atRA and its metabolites in physiological media.
To meet this goal the following steps were planned:
Extraction and trace analysis of atRA in aqueous media was optimized and then its
concentration was quantified by HPLC-UV (high performance liquid chromatography
with ultra violet detector) and HPLC-ESI-MS/MS (High Perfonnance Liquid Chromatography with Tandem Mass Spectroscopy Using Electrospray Ionization).
Extraction and trace analysis of samples consisting of serum-supplemented cell culture aMEM: FBS 90: 10, v/v (Alpha Minimum Essential Medium: Fetal Bovine
Serum) to which was added atRA and quantification by HPLC-UV and
HPLC-ESI-MS/MS.
1.1 History of Vi tamin A and the Retinoids
Vitamin A was probably known by ancient Egyptians at least 3500 years ago.
However, the modem investigation of the vitamin A began aroun~ 130 years ago (Wolf, 1996).
• In 1816, François Magendie conducted nutritional experiments with dogs.
• In 1880, Nicolai Lunin showed that there was a substance in milk that was essential for growth and Carl Socin discovered that the same substance, present in the yolk, was essential for chick growth.
• In 1906, Frederick Gowland Hopkins suggested that there were unsuspected dietetic factors necessary for life.
• In 1911, Wilhelm Stepp demonstrated that the essential substance i'n milk was also fat soluble.
• In 1913, Elmer McCollum and Marguerite Davis, Thomas Osborne and Lafayette Mendel showed that butter and egg yolk were superior ·to lard and olive oil in supporting the growth and survival of rats.
• In 1918, the growth-supporting factor became known as fat-soluble vitamin A.
• In 1932, Paul Karrer described the chemical structure of vitamin A.
• In 193 7, Harry Holmes and Ruth Corbet isolated and crystallized vitamin A. • David Adrian van Dorp and Jozef were the first who applied the methods for
the synthesis and characterization of vitamin A.
• Research on the role of vitamin A in immunity and child survival continued into the 1990s (Wolf, 1996).
Vitamin A Derivatives (The Retinoids)
The retinoids are natural and synthetic derivatives of Vitamin A. They are divided into three categories (Chapman, 2012; Roos et al., 1998):
• The non-aromatic retinoids such as ~-carotene, atRA and 13-cis-RA, the two latter are naturally occurring retinoids formed from the metabolism of retinol. They are present in small amounts in the body and were first synthesized in 1955.
• Non-aromatic retinoids such as 9-cis-RA, the etetinate and the acitretin.
• Polyaromatic retinoids (the arotinoids) such as adapalene, tazarotene, and bexarotene
1.2 Structures, Nomenclature and Classification of the Retinoids.
1.2.1 Structure
Structurally, the retinoids consist of four isoprenoid units attached head to tail, with each unit having a (H2C=C(CH3)-CH=CH2) structure. The molecule can be
considered to be divided into three parts, a trim ethylated cyclohexene ring, a conjugated tetraene side chain and a carbon-oxygen functionality (Barua and Furr, 1998; Cox, Muccio and Hamilton, 2013 ; Luterotti, Sikovec and Bicanic, 2000).
1.2.2 Nomenclature
The numbering of the carbons of the main retinoid chain, according to IUP AC, is shown in Figure 1.1 (IUP AC, 1983).
16 19 20
H
3
C
,
..
CH
3
CH
3
. .
2
8
10
12
3
CH
3
HO
4
18all-trans Retinoic Acid (atRA)
Figure 1.1: atRA Chernical Structure (Cox, Muccio and Hamilton, 2013).
1.2.3 Classification
The retinoids can be classed by ongm, i.e. natural or synthesis. The naturally
occurring retinoids include vitamin A and its physiological metabolites e.g.
retinaldehyde, atRA and 9-cis-RA, all of which are provided to the human organism
by the diet and their general chemical structure is shown in Figure 1.2.
From 1967 onwards, synthetic retinoids were developed by changes in the nucleus
and the side chain, as well as in the terminal group. Synthetic derivatives of vitarnin
A are less toxic than the naturally-sourced vitamin and are used at present as
therapeutics. The synt~esis of retinoids has helped the advancement of the topical
treatment forms of comedonal acne. Since 1968, more than 2000 molecules have
been synthesized however, only a few are currently being used clinically. Among
aromatic retinoids, etretinate was used clinically but now it has been replaced by
acitretin. Adapalene was the first retinoid of a new class to be discovered. lt is used in
the topical treatrnent of acne. The main structural features of synthetic retinoids are shown in Figure 1.2.
1.3 Isomerization and Degradation Products
There are several reports on the formation of photoisomers of RA after exposing solution of the latter to light for short time (Urbach and Rando, 1994). As shown in Figure 1.1, each of double bonds in the conjugated polyene chain can undergo isomerization to give both mono cis and multiple cis isomers. However, due to steric
hindrance, some of the isomers are not thermodynamically stable at room temperature
and thus quickly isomerize to more stable forms. Mono cis isomers of retinoids play important biological roles. There are differences in receptor binding and thus, biological activity, for these isomers. Furthermore, some of isomers of RA are teratogenic. Therefore, determination of the exact isomerization products obtained from synthesis is essential (Ruhl, 2006). The chemical structures of these retinoid isomers are shown in Figure 1.2.
Structure Products H3C CH3 CH3 CH3 ~ ~ ~ ~ Retinol OH CH3 CH3 CH3 0 ~ ~ ~ ~ Retinaldehyde H 8
CH3 CH3 ~ ~ ~ 13-cis-RA ~ CH3 HO
~
0
CH
3 ~ ~ 9-cis-RA ~HO
0H
3C
CH
3H
3C
0 ~ ~ ~ ~ 1 4-0H-RAOH
CH
3 0H
CH
3CH
3 0 ~ ~ ~ ~ 4-oxo-RAOH
0 18-0H-RAOH
OH
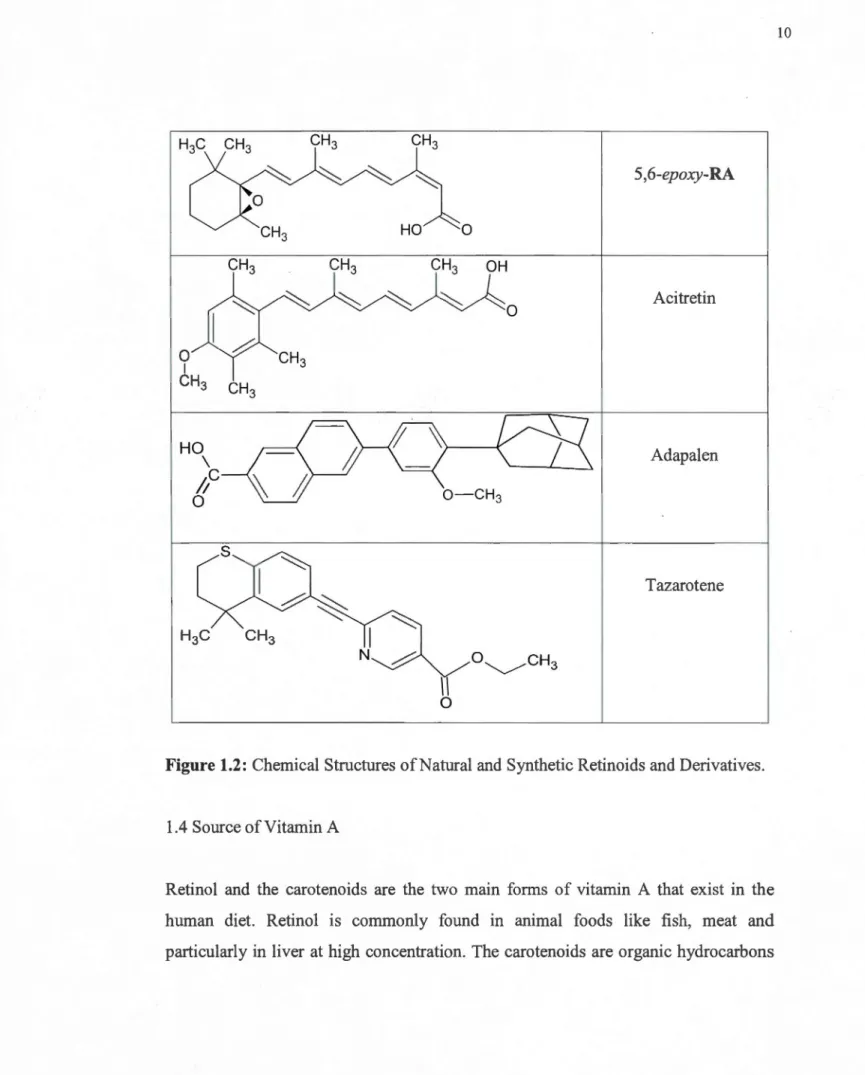
H3C CH3 CH3 CH3 ~ ~ ~ 5,6-epoxy-RA CH3 HO 0 CH3 CH3 CH3 OH ~ ~ ~ ~ Acitretin 0 0 CH3 1 CH3 CH 3 HO \ Adapalen
/;c
O -CH3 0 Tazarotene 1 N 1 0Figure 1.2: Chemical Structures of Natural and Synthetic Retinoids and Derivatives.
1.4 Source of Vitamin A
Retinol and the carotenoids are the two main forms of vitamin A that exist in the human diet. Retinol is commonly found in animal foods like fish, meat and particularly in liver at high concentration. The carotenoids are organic hydrocarbons
composed of eight isoprene units, which act as pigments in plants, bacteria and algae. They are synthesized by photosynthetic microorganisms and plants. There are two types of carotenoids:
• The xanthophylls (having oxygen). • The carotenes (not having oxygen).
The carotene is plant-, not animal-sourced. Beta-carotene is probably the best known of these retinoids providing the red, orange and yellow pigments found in many fruit, vegetables and green leafy plants (Chapman, 2012 ; Luterotti, Sikovec and Bicanic, 2000).
1.5 Physiological Roles of Vitamin A
1.5.1 Vision
Night vision or dark adaptation is a physico-chemical phenomenon associated with vitamin A. The presence of a photosensitive pigment called rhodopsin in the rod cells of the retina, allows for this phenomenon. Rhodopsin, a derivative of vitamin A, is synthesized from 11-cis- retinal with a protein opsin. When rhodopsin is exposed to light of low intensity, 11-cis-retinal is isomerized to trans-retinal (Perlman, Tamarhaim and Schramek, 1983 ; Sieving et al., 2001 ).
1.5.2 Embryonic Development
atRA is the major retinoid needed for the early stages of embryonic development. It
regulates the formation of the germ layers and body axis and is involved in neurogenesis. It is important for the development the pancreas, Jung and eye organs
and is a critical element for vision (De Luca, 1991 ; Kam et al., 2012 ; Sharon et al.,
2000). It can also induce carcinogenesis if present in unadequate concentrations.
1.5.3 Cellular Differentiation
RA and its isomers influence many physiological processes and act as honnones to
regulate gene expression. RA is the most potent factor for cell differentiation. atRA's
ability to differentiate cells is the main focus of research into the development of
therapies for prevention and treatment of various human cancers (Idres et al., 2001)
1.5.4 Reproduction
atRA supports both male and female reproduction and is also essential for the
maintenance of male genital tracts and for spermatogenesis. Vitamin A is involved in
the development of spermatozoa, avaries and placenta in addition to the growth of the
embryo and in the differentiation and proliferation of epithelium cells. Low serum vitamin A in the mother is associated with infant morbidity or, indeed mortality
(Clagett-Dame and Knutson, 2011).
1.5.5 Immune System
Vitamin A, used as dietary supplement, is believed to enhance resistance to infection.
It is known as an anti-infection vitamin because it is essential for the proper
functioning of the immune system. It plays an important role in the development and
differentiation of white blood cells and the activation of T-lymphocytes via the
binding of atRA to the RAR (Bidad et al., 2011).
1.5.6 Oncology
The role of vitamin A (through RA) in cell differentiation, growth and control makes it very important in oncology. Many retinoids have been used alone or in combination for the treatment of several cancers such as basal cell carcinomas, squamous cell carcinoma of the skin, melanoma, cell lymphoma, acute promyelocytic leukemia (APL), ovarian, lung, breast, prostate, mouth and renal cell carcinomas and squamous cell head and neck syndrome. Vitamin A and its esters are capable of inhibiting
. .
carcmogenes1s.
1.5.7 Dennatology
The importance of retinoids in dermatology was discovered by Wallach and Howe in 1925 (Roos et al., 1998). This research group identified the epidermal changes which occur m abnormal keratinization in vitamin A-deficient animals. Vitamin A is presently a molecule of interest in dermatology because its effect on the differentiation and proliferation of epithelium cells. The mechanisms for action of retinoids on skin are still the subject of research. Nonetheless, it is known, from the study of epithelial morphogenesis rebuilding at a low dose atRA allows for the optimal formation of the epidermis. As the active precursor in the skin, atRA is converted in the epidermis and probably in the dermis into 13-cis-RA, 9-cis-RA and 4-0H-RA.
1.6 Metabolic Pathway of atRA
The metabolism of atRA is complex and currently is only partially understood, the metabolism has different mechanisms depending on whether it is analysed in vivo or
in vitro. A few enzymes are known to participate in RA metabolism. The latter may play a role in cancer cell response or resistance to retinoid therapy (Marill et al., 2003). atRA can be oxidized by P450 cytochrome to different metabolites and these metabolites may be further metabolised to water soluble glucuronides (Idres et al., 2001). The metabolism of atRA occur in two phases:
• First Phase in vivo
atRA can be metabolized by isomerase into several isomers which can undergo phase 1 metabolism into oxidized metabolites: 4-oxo-RA, 4-0H-RA, 18-0H-RA and
5,6-epoxy-RA while these isomers are believed to be less biologically active and more polar than atRA.
• Second Phase
The second phase of retinoids metabolism involved the production of conjugated metabolites of atRA. The oxidized metabolites produced in phase 1 can undergo glucuronidation in animais and humans. Thus, at-retinol P-glucuronide, 13-cis-retinol p-glucuronide, at-4-oxo-retinol p-glucuronide, 13-cis-4-oxo-retinol p-glucuronide are all conjugated metabolic products. RA metabolism reduces biopotency and results into an auto-regulatory loop. Several groups have observed that atRA metabolites can stop the differentiation and growth of several cancer cell lines. The analysis of glucuronides products has shown that atRA-4-oxo-RA and 5-6 epoxy-RA are carboxyl-linked glucuronides whereas 4-0H-RA was glucuronidated via the hydroxyl group (Marill et al., 2003). Another interesting observation is that RA glucuronide shows activity in vitro and but not in vivo. The glucuronide derivatives doesn't bind
to RAR due to their polar nature which facilitates their excretion (Marill et al., 2003).
CHAPTER II METHODOLOGY
The choice of the method for atRA trace quantification was based on several
considerations, i.e. desired level of concentration, the resolution and the nature and
effect of the sample matrix. Furthermore, the speed and cost of analysis must be
optimized.
2.1 Reported Methods for RA Analysis
Analytical methods for retinoids have been developed usmg vanous high perfonnance liquid chromatography-diode array detection (HPLC-DAD) (Van Merris
et al., 2002). HPLC coupled to thermal lens detection (Luterotti, Sikovec and
Bicanic, 2000), HPLC coupled with ultra violet detector (HPLC-UV) (De Leenheer,
Lambert and Glaeys, 1982 ; Gundersen and Blomhoff, 2001 Klvanova and Brtko,
2002; Schmidt, Brouwer and Nau, 2003 ; Tatum and Chow, 2005), HPLC coupled to
particle beam mass spectrometry (Lehman and Franz, 1995), electroionisation mass
spectroscopy (Bempong, Honigberg and Meltzer, 1995), HPLC coupled with
atmospheric pressure chemical ionisation tandem mass spectrometry (HPLC-
APCI-MS/MS) (Gundeson, Bastani and Blomhoff, 2007 ; Kane et al., 2008 ; Wang et al.,
2001) and HPLC-ESI-MS/MS in both positive and negative modes (Lin, Jing and
Jianping, 2011 ; Van Breemen and Huang, 1996) have also been reported.
2.2 Categorisation for RAs
Two different methods, routine and high sensitivity, were developed based on the
};;;>- The routine method involves high performance liquid chromatography
coupled with ultra violet detector (HPLC-UV), as is generally required for
pharmacological level (µg) scale analyses (Marillet al., 2003).
};;;>- The high sensitivity method of high performance liquid chromatography
coupled with electrospray ionization mass spectrometer (HPLC-ESI-MS/MS)
is more appropriate for ng scale quantification. This method is suitable for
researchers who work in the field of embryonic development (Marill et al.,
2003) and may be applied to the physiological level quantification.
2.2.1 HPLC-UV
High perfonnance liquid chromatography coupled with a UV detector (HPLC-UV) is
a powerful method for the analysis of atRA. The main advantages of HPLC-UV
method are:
};;;>- Rapid, low cost, accurate, accessible and suitable for routine analysis (Barna,
2001).
};;;>- atRA has a specific UV absorption. Retinoids absorb light in the high UV
(Àmax= 325 to 370 nm) as the result of their conjugated polyene chains (Van
Merris et al., 2002).
};;;>- UV detection allows the possibility of simultaneous quantitative and
qualitative testing (Van Merris et al., 2002).
};;;>- No interfering peaks with similar retention tünes were observed in
chromatogram of extracted atRA in both aqueous solution and
serum-supplemented cell culture media.
};;;>- This method is not selective nor can one detect low or trace level
2.2.2 High Sensivity Method (HPLC-ESI-MS/MS)
High performance liquid chromatography electrospray ionization coupled with tandem mass spectrometry (HPLC-ESI-MS/MS) is a flow analysis technique for rapid and high through-put analysis (Ho et al., 2003 ). This method is one of the most powerful tools in modem analytical chemistry. It is particularly useful in trace analysis. HPLC-ESI-MS/MS is very powerful tool capable of analysing both small and large molecules of varying polarity, e.g. in complex biological mixtures (Banerjee and Mazumdar, 2012).
ESI-MS has also become an important technique in clinical laboratories (Ho et al.,
2003). Most HPLC-ESI-MS/MS analyses are carried out using reverse phase liquid chromatography with a non-polar Cl 8 silica bonded stationary phase. The molecule of interest must be able to undergo charge changes via protonation and deprotonation.
The main advantages of this method are:
~ It is capable of providing both qualitative (structure) and quantitative (molecular mass or concentration) results for analytes (Ho et al., 2003). ~ It is a valuable method for complicated matrix analysis (Wu et al., 2004). ~ lt is the most sensitive analytical method for structural characterization of a
molecule (Banerjee and Mazumdar, 2012).
~ lt is the most powerful method for target compound characterization.
~ It allows for the possibility of obtaining the entire molecular mass by selecting the appropriate parent ion peak.
~ Finally, it is a time saving method when a large number of samples must be analysed.
Limitations of HPLC-ESI-MS/MS are:
);:> The selectivity and sensitivity of HPLC-ESI-MS/MS analysis not only
depends on the ionization technique and mass spectrometer used, but also on
the chromatographie technique chosen (Kostiainen and Kauppila, 2009).
);:> The optimization of chromatographie and mass spectrometric conditions is
required while maintaining a balance between sensitivity and resolution (Kane
et al., 2005).
);:> The mobile phase composition for the HPLC must be compatible with
electrospray mass spectrometry. For example, nonvolatile ion pair reagents
and/or buffers must be excluded to prevent precipitation in the ion source
(Van Breemen and Huang, 1996).
);:> Ionization suppression can occur when mass spectrometric analysis is carried
out at atmospheric pressure (Manuur et al., 201 l).
);:> The signal response depends on many parameters: sample concentration,
sample matrix, analyte characteristics, buffer, organic solvent and/or curtain
gas purities as well as collision cell parameters and eluent composition.
);:> There is no possibility to apply non-volatile additives and/or buffers in mobile
phase as this can causes excessive background noise and/or rapid
contamination of the interface source (Kostiainen and Kauppila, 2009).
A summary of the numerous advantages using a high sensitivity method for analysis
of atRA are as follows:
);:> There is a favorable ionization efficiency due to conjugation and the
carboxylic acid group in atRA (Hung, 1996).
);:> Greater sensitivity allows for greater signal intensity and lower background
~ Creating RA derivatives is not required for this method in comparison with
other methods like Negative Ion Electron Capture Chemical Ionization (Hung,
1996).
~ This method has higher selectivity and does not require prolonged sample preparation in comparison of GC-MS (Peng et al., 2014).
2.3 High Sensitivity Instrumentation (HPLC-ESI-MS/MS)
The figure 2.1 represents three components of a m~ss spectrometer :
1. An ion source for producing gaseous ions from the sample m ionization compartment.
2. An analyser for resolving the ions into their characteristics mass components according to their mass to charge ratio.
3. An ion detector system which measures the relative abundance of each of the resolved ionic species and converts the ions into electrical signais.
A sample introduction system is necessary to introduce the samples into the ion source such as in an HPLC. All mass spectrometers operate under vacuum allowing ions to reach the detector without colliding with the other gaseous molecules or atoms (Kang, 2008).
,---,
1 GasP~!>? Ion; Ion 'S-Orting loci Detectlon 1Source 1 1 1 1 Sampi~ 1 Vacuum Pumps : Introduction " ____________________ _, M.3ss Spectrum Data
~
Data Output Figure 2.1: Components of a Mass Spectrometer (www.premierbiosoft.com).2.3.1 Ion Source and Ionization Technique
Electrospray Ionization (ESI) is conducted at atmospheric pressure ionization technique, and it is used to produce polar and ionic species in gas-phase ions at high voltage (Tang, Bruce and Hill, 2006). John Fenn, the first person to develop this method, shared the 2002 Nobel Prize in chemistry for the crafting ESI-MS.
ESI promotes electrostatic dispersion and creation of aerosols and is sometimes improperly called electro-hydrodynamic atomization (Kebarle and Verberk, 2010). This ionization technique has totally replaced other earlier ones such as continuous Fast Atom Bombardment (F AB), Thermospray and Particle Beam Ionization (PBI) (Kostiainen and Kauppila, 2009).
Mechanism of Action
All stages of the ESI occur in atmospheric pressure regions of the machine and the sample proceeds through three major steps in the conversion from electrolytes in solution to gas phase ions (Figure 2.2):
1- Initial production of charged droplets in very small diameter ESI capillary tips. 2-Shrinkage of the charged droplets due to sol vent evaporation.
3-Gaseous ion formation.
A voltage of 2-5 kV is applied across the capillary spray tip, and a high electric field at the capillary tip causes polarization of the solvent. The solution supplied to the capillary must be polar and one in which the analyte is soluble: (ex: MeOH or MeOH/H20; and ACN or ACN/H20).
In the presence of an electrolyte, the solution must be sufficiently conducting and the positive and negative ions in solution sufficiently labile under the influence of the
field. A common electrolyte used in these solutions is ammonium acetate which provides an excess, at the surface, of NH/ as the positive ion.
The droplets initially produced are expected to be approximately of similar size and positively charged due to an excess of positive electrolyte ions at the surface of the cane and the cane jet. The mode of charging, which depends on the positive and negative ions traveling in opposite directions under the influence of the electric field, has been called the electrophoretic mechanism. The droplets migrate downfield towards the oppositely charged electrode. Solvent evaporation at constant charge causes droplet shrinkage and an increase in the repulsion between the charges. Increasing repulsion overcomes the surface tension of the drop let and thus columbic fission can occur. Formation of a cane jet splits the charged droplet into numbers of smaller ones while further evaporation of the parent drop let leads to repeated fissions and generation of smaller drop lets.
In 1882, Lord Rayleigh theoretically estimated the maximum amount of charge a droplet can carry which is called the Rayleigh limit. Evaporation of droplet's solvent increases the charge on the analyte until Rayleigh limit is achieved. At this point, the droplet breaks apart and the analyte is accelerated toward the counter electrode and subsequently into mass spectrometer.
+ - + + _-... -- +_-+ .... + .. _ ... _' : •.,., + 1 : +-+"" + i· ',
Figure 2.2: Mechanism of Electrospray Ionization (Ho et al., 2003).
Sensitivity is an important aspect of ESI-MS/MS, and depends on several factors including:
);>- Ionization efficiency, defined as the method' s effectiveness in producing
gaseous 10ns.
);>- Ion transmission efficiency, defined as the fraction of electrospray current
which enters the mass spectrometer and the ability to transfer the charged ions from an area of atmospheric pressure to the vacuum of the mass spectrometer.
Limitations in ionization and transmission efficiencies lead directly to a reduction in the ESI-MS sensitivity (Page et al., 2007). Severa! factors affect the ionization
efficiency:
);>- Interface design.
);>- Flow rate. A lower flow rate provides better ionization efficiencies because it generates smaller initial droplets that require less solvent evaporation which offers a better sensitivity (Page et al., 2007 ; Tang, Bruce and Hill, 2006). );>- The chemical and physical properties of the analyte (pKa, hydrophobicity,
surface activity, ion solvation, and proton affinity).
);>- Eluent composition and volatilities, surface tensions, viscosities, conductivities, ionic strengths, dielectric constants, electrolyte concentrations,
pH and potential gas-phase ion-molecule reactions (Kostiainen and Kauppila, 2009).
);>- Solvent charge separation (cation vs anion). The conductivity of the solvent
must be sufficient to achieve good sensitivity along with good stability. );>- Polarity of solvent. A more polar solvent better stabilizes multiply charged
ions in solution.
);>- Sensitivity is improved when higher proportions of organic sol vents are used.
The signal response in ESI increases with increased amount of organic sol vent
- - - -- - -
-~ Smaller initial droplet s1ze mcreases the amount of charge per analyte molecule and improves the ionisation efficiency as well as the surface
activity.
~ Instrumental conditions and ion source voltages.
ESI has numerous benefits:
~ lt is an excellent method for the detection of analytes generated by HPLC. Furthermore, ESI coupling with an HPLC is relatively easy (Page et al.,
2007).
~ lt is a soft ionization technique which can produce the gas phase ions of large,
thermally liable supermolecules (Banerjee and Mazumdar, 2012).
~ ESI is sensitive, robust and reliable tool for the study of femtomole quantities
of analytes in microliter volumes (Ho et al., 2003).
~ Using ESI increases the speed of analysis for a variety of analytes of differing polarities such as organic or inorganic species, polymers, nucleic acids or,
indeed, very high mass proteins in physiological matrices (Ho et al., 2003
Kebarle and Verberk, 2010).
~ ESI allows for creation of intact multiply charged gas-phase biomolecules
(Page et al., 2007), protonated and deprotonated molecular ions from
compounds with high molecular weights (130 KDa) · as well as from
thermostable compounds.
~ ESI is particularly effective for analytes with a polar functionality (Banerjee and Mazumdar, 2012), like atRA which has an acidic carboxylic moiety. ~ ESI is less affected by salt contaminations of the analyte solution than the
other ionization techniques.
ESI Ionization Mode (Negative)
Negative ion mode was seldom used in the past due to irreproducibility arising from several factors:
~ It is more difficult to obtain a stable signal in negative vs positive mode because the electrical discharge occurs at lower electric field (Kostiainen and Kauppila, 2009).
~ In negative ion mode mass spectroscopy, the ion sources are operated at pressure of up to 133Pa, producing a high concentration of low energy electrons which may directly react with sample molecules to fonn negative molecular daughter ions.
~ Mass spectra in negative mode generally exhibit less fragmentation than in positive mode.
~ The sensitivity of electron attachment process is very high for electronegative elements, and precursors which react as Bronsted based frequently give [M-l
r
ions, which commonly undergo electron capture or anion attachment (Pavani et al., 2012).Nonetheless reagent gases may be used to generate negative ions and acids, phenols and nitro compounds which are easily ionized in negative mode by ESI (Kebarle and Verberk, 2010).
Mass spectra resulting from production of negative ions via ESI are more efficient, sensitive and selective than mass spectra produced in positive mode. Furthermore, the presence of acetic acid improves the signal response for ESI in negative mode (Wu et al., 2004). In the current context, atRA has a medium polarity, having a non-polar hydrocarbon chain and a polar acidic group which can be ionized via negative mode ESI.
Negative Electrospray tonizatïon
char·ged drop10t -~
counter electrode
1
emitter tip '·Rayleigh" li1mit _ _ Taylor cone - ve reaçhed
11
-_, _"Coulomblc' _ - •
-ainalyte moiec1.1le
High Voltage Power Supply
~plos;
~
-
·
Î
-+ v.e multlply-cha:rged an.alyte i·ons
Figure 2.3: Diagram ofNegative Electrospray Ionization (Pavani et al., 2012).
2.3.2 Mass Spectrometer
Quadrupole mass spectrometers sort ions according of their mass-to-charge ratio (Miller and Denton, 1986). They consist of four circular sections arranged with their axes in a square array. The quadrupoles have a tuneable and a variable band pass region. At present, the most widely used tandem mass spectrometer is the quadrupole mass spectrometers. Only the first and third quadrupole scan and analyse the ions. The performance of the mass analyser is defined by such characteristics as accuracy, resolution of the mass range as well as the scan speed. Selected Ion Monitoring (SIM) is the most selective mode used for single quadrupole MS, while triple quadrupole is used for enhanced sensitivity and selectivity in multiple reaction monitoring (MRM). Tandem mass spectrometry, having two stages of mass analysis, includes a product and a constant natural loss scan.
ion source
electron
quadrupole mass multiplier quadru~le collision filter
quadrupole mass c amber
sample
ionlzation
filter ----...
precursor
ion selection
Figure 2.4: Schematic Diagram of a Triple Quadrupole Mass Spectrometer (Edmond
de Hoffmann, 1996).
Significant Advantages of the Quadrupole
~ The shorter distance between the ion source and the detector having a relatively low pressure (Sx10-5 Torr), allows for the coupling of a HPLC to the mass spectrometer (Miller and Denton, 1986).
~ Quadrupole MS resolves ions on the basis of mlz instead of kinetic energy momentum (Miller and Denton, 1986).
~ The quadrupole is relatively low cost while having bulk weight due to its mechanical simplicity. lt also avoids the slow scan speeds associated with magnets (Miller and Denton, 1986).
Advantages of the Triple Quadrupole
~ Triple quadrupole MS/MS offers higher selectivity due to double mass filtering (Schreiber, 2010).
);>- This allows for quantification of many targeted analytes m a single
experiment.
);>- Higher selectivities result in less interference from co-eluting compounds and
the matrix (Schreiber, 2010).
);>- The quadrupole collision chamber and the mass analyser allow for high
efficiency fragmentations.
);>- The triple quadrupole MS/MS is capable of analysing up to m/z 4000 with a
precision of mlz O. l-0.2.
);>- The triple quadrupole allows for better accuracy and reproducibility especially
at low concentrations.
);>- This technique has a better signal to noise ratio (SIN) allowing for a lower
limit of quantification (Schreiber, 2010).
);>- Speed of such scans are up to 5000 m/z per second.
);>- Triple quadrupole MS/MS tolerates relatively lower pressures.
2.4 Buffer Choice
2.4.1 Strategies for Choosing the Right Buffer
Small changes in the mobile phase pH have a dramatic effect on atRA analysis (Kaushal and Srivatara, 2010). Therefore, a buffer is used to maintain the pH of the solution for analysis within a narrow range. The nature of the buffer is detennined by its buffer capacity, i.e., its resistance to change in pH when strong acids or bases are added. The doser the pKa of the buffer is to the desired pH, the greater is its buffer capacity and the better it controls the pH of the analysis, an important factor for the results (www.bartek.on.ca) ; one of the analyte should have a pH of 1.5 units above or below that of the mobile phase. A lower pH decreases the solubility of RA in