an author's
https://oatao.univ-toulouse.fr/26924
https://doi.org/10.1016/j.ijfatigue.2020.105541
Liang, Xiaoyu and Robert, Camille and Hor, Anis and Morel, Franck A numerical investigation of the high cycle
fatigue sensitivity to microstructure and defect. (2020) International Journal of Fatigue, 136. 105541-105556. ISSN
0142-1123
A numerical investigation of the high cycle fatigue sensitivity to
microstructure and defect
Xiaoyu Liang
a,b,⁎, Camille Robert
a, Anis Hor
b, Franck Morel
aaAngers Laboratory of Mechanics, Manufacturing Process and Innovation (LAMPA), Arts et Métiers Campus Angers, 49035 Angers Cedex, France bInstitut Clément Ader (ICA), Université de Toulouse, CNRS, ISAE-SUPAERO, UPS, INSA, Mines-Albi, 3 rue Caroline Aigle, 31400 Toulouse, France
Keywords: Non-local method
Microstructure sensitive modeling High cycle fatigue
Defect Finite element
A B S T R A C T
This study aims at investigating the effect of defect on the high cycle fatigue behavior of polycrystalline ag-gregates. An explicit virtual microstructurefinite element model is created to conduct fatigue simulations. Different stress-based criteria frequently applied in fatigue assessment are tested with a combination of the non-local methods. Two realizations of the non-non-local method are used and compared. Simulation results are com-pared to experimental results of 316L. From the parametric simulations, better qualitative understandings on the choice of non-local method as well as its parameters are obtained. The effect of Kitagawa-Takahashi can be reproduced and explained by this proposed framework of microstructure modeling-simulation.
1. Introduction
The numerical simulation of metallic polycrystalline aggregates has developed quickly in the past decades[1–3]. Its application to the fa-tigue predictions is more and more valued for the efficiency and cost-saving as the fatigue experiments are very time consuming and require massive efforts on the devices’ setting up and specimens’ preparation. In the high cycle fatigue regime, it is well known that the strength is highly influenced by the defects, especially the ones on (or close to) the free surface [4]. The defects in the metallic materials are frequently encountered due to the manufacturing process or the material nature, e.g. shrinkage pores in cast aluminum alloys with large grain size[5], gas pore or lack-of-fusion defects andfine microstructure for materials from additive manufacturing process[6]. More investigations on arti-ficially induced defect[7]or surface irregularities[8]are reported too. Even though anisotropy and stochasticity of microstructure can be displayed by advancing experimental instruments such as SEM, EBSD
and AFM, sometimes definitive conclusions from experiments are
hardly achievable due to the restrictions as sample number, fabrication reproducibility, etc. Since fatigue is a local phenomenon, micro-structure impacts obviously the initiation and propagation of fatigue crack from inherent defect by acting as the main source of scatter in fatigue test results. Vincent et al. found that the critical defect size has a connection with characteristic microstructural dimension other than actual physical length for different steels [9]. But the converse
conclusion is reported by Bracquart et al. for aluminum alloy [10]. When dealing with the issue of microstructure/defect competition in fatigue, a simulation would be reliable if the microstructure is explicitly taken into consideration.
The effect of defect size on reducing the high cycle fatigue perfor-mance of a material is often schematically shown by the Kitagawa-Takahashi (K-T) diagram[11](seeFig. 1). El Haddad et al.[12] pro-posed a single curve for all defect sizes by using the short crack cor-rection. Two main mechanisms are presented by the two lines. The horizontal line represents that, within a certain range, the defect size does not change the high cycle fatigue limit while the other line in-dicates that the fatigue limit drops linearly on the log-log scale as the defect size increases. Based on the good prediction of Linear Elastic Fracture Mechanics on fatigue performance of specimen having a long crack, the second line can generally be related to the stress intensity threshold. In the K-T diagram, the non-damaging cracks do not affect fatigue performance, as well as the long cracks, lead to a strong de-crease of fatigue limit. From the perspective of industrial application, it is of great importance to explore the transition region where the short crack has an influence but does not play the dominant role.
Microstructural features such as grain boundaries and crystal-lographic orientations play important roles in the fatigue damage pro-cess[13]. For a crack with the length on the order of several grains, the microstructure governs its propagation which cannot be predicted by
LEFM using macroscopic variables [14]. A framework of explicit
https://doi.org/10.1016/j.ijfatigue.2020.105541
⁎Corresponding author at: Angers Laboratory of Mechanics, Manufacturing Process and Innovation (LAMPA), Arts et Métiers Campus Angers, 49035 Angers Cedex, France.
microstructure sensitive modeling is for instance proposed by McDo-well et al.[15]to estimate fatigue behavior from microstructural per-spectives. The introduction of defects and microstructure to the nu-merical model can bring a great amount of stress heterogeneity, i.e. local stress concentration and local stress gradient. Stress concentration will affect strongly the local mechanical response which causes dis-location or deformation leading to fatigue failure. Theoretical stress concentration factor Ktdefined by the ratio of the local maximum stress
and the nominal stress is commonly used to characterize the stress concentration in the vicinity of the defect. In terms of fatigue behavior, another parameter Kfwhich is the ratio of fatigue strength of a smooth
specimen to that of a notched specimen presents more clearly the in-fluence brought by a stress concentrator [16]. However, Kfis always
less than Ktbecause of the effect of stress gradient and size. For
de-fective materials, the critical point at the notch root always over-em-phasizes the effect of stress concentration which leads to an under-estimation of fatigue performance. Additionally, the extreme value fromfinite element model is highly dependent on the mesh size without further treatment.
In order to investigate the effect of defect and microstructure as well as their competition, the non-local method is implemented under the framework of microstructure sensitive modeling in this study. The concept used is the critical distance theory[17]. The idea of the critical distance theory is assuming there is a small zone with the size of several grains in which the grains affect each other mutually leading to fatigue initiation. This method has been successfully applied in several pieces of research on the fatigue performance of defective materials. But in the applications, the definition of the critical distance is somehow vague. Taylor gives an explicit expression of the critical distance parameter L
[18]which is a function of material’s threshold ΔKthand fatigue limit
σ0. This model works well in the life assessment as it can give the
prediction of fatigue life within the same order of the experimental observation[19]. But considering the microstructure, the result is not that satisfactory since the parameters are macroscopic and cannot re-present what happens locally. Even if we calibrate these parameters locally in the hot spot, a local calibration for a non-local method seems to be unreasonable. A more frequently encountered treatment is to give a suitable Lcrwithout further explanation[20]. Besides the concept of
Lcr, an alternative realization using microscopic parameters (layer
depth) was proposed and tested[21].
However, from the concept of the critical distance theory, the non-local parameter should have a connection with the critical defect size and the microstructure. Inspired by the findings of Vincent et al.[9]
that the critical defect size is relative to the microstructural attributes, two different realizations of the non-local method are proposed and evaluated in this study. One is the critical radius method which doesn’t make explicit reference to microstructure. Another one is the neighbor layer method characterized via microstructural attributes.
It is also important to point out that this study is an extension of previous researches dealing with microstructure sensitive modeling.
Based on the explicit microstructure sensitive modeling framework, Robert et al. tested both elastic and plastic material behavior models under different types of loading to simulate the meso-mechanical re-sponse in the polycrystalline aggregate[22]. The predominant role of elastic anisotropy on simulations in the HCF regime, which is in agreement with thefinding of Sauzay[23], authorizes the simpli fica-tion of neglecting crystal plasticity in HCF predicfica-tion for some mate-rials. Hor et al.[24]evaluated several multi-axial stress-based fatigue criteria statistically at the grain scale of polycrystalline aggregate. Guerchais et al.[21]firstly introduced the neighbor layer method in his investigation of the effect of defects. Though the predictions from his probabilistic and non-local determinant criteria are in line with the experimentalfindings, the identification of parameters is not explained which remains unclear in the simulation perspective.
The aim of the present study is to enrich the fatigue modeling of defective materials by investigating the effect of defects under the framework of microstructure sensitive modeling. We focus on the parametric study of non-local method in its application to the micro-structure sensitive modeling. This work is purely numerical and the results are compared to the experimental results from Guerchais et al.
[25]. An explicit virtual microstructurefinite element model is built up and used. Modifications of fatigue criteria by introducing non-local method are explained and evaluated to qualitatively explore the con-nection between critical distance and the defect size or the micro-structure. To better reveal the value of the non-local method, further investigations concerning grain morphology and grain size are con-ducted. It is expected that the proposed realizations of the non-local method are compatible with general simulation scenarios.
2. Explicit microstructure model and fatigue prediction approach 2.1. Finite element model
The objective numerical model is an explicit microstructure sensi-tive model which contains the quasi-realistic forms of grains and the organized distribution of grain orientations. A frequently used and realistic way of generating the microstructure of polycrystalline is to use Voronoi polyhedral to tessellate the microstructure[26]. The ceived model should be three-dimensional. But for the models con-taining defects that can be of tens of the grain size, the three-dimen-sional models are not feasible considering the computation expense. For instance, a 316L steel having a mean grain size of 15 µm will be divided into more than 200,000 grains even if the studied volume is set to only 1 mm3. The 2D model is acceptable for its approximated results and a lower expense of computational resources. The simulations in this study are performed by a two-dimensional square-shaped domain partitioned by convex polygons[27]. Three batches of models are built up and are summarized inTable 1. The models in thefirst batch have the same average grain size corresponding to the cited experimental research which serves as the reference results. In the second batch, equiaxed and non-equiaxed grain distribution are used and compared. The equiaxed case is represented by a normal distribution of grain size which is in good agreement with the conventional fabricated steel and the non-equiaxed cases are described by the uniform distribution or the log-normal distribution. More grain sizes are examined by the models of the third batch. The loading type is tension-compression fatigue loading with a ratio R =−1. The left end of the FE model is pinned while the bottom is restrained from vertical displacement. The loading is applied to the right end. The top surface is considered as the free surface. Several illustrations are presented inFig. 2.
For the benchmark model, which has a 2 * 1 mm2studied area with
an average grain size of 15 µm, approximate 9000 grains are used to discretize the space. The mesh generator Gmsh[28]is used. The re-duced 3-ordered triangular element is employed in the mesh. Previous research about the numerical methods for the modeling of poly-crystalline materials points out that the yielded results change with an
increasing mesh resolution [26]. The convergence is not always achieved in thefinite element model, but the error is assumed to be insignificant with a fine mesh. Convergence tests of the non-local re-sponses which will be presented in the following section are performed to choose an appropriate mesh size. The characterized lengths of 2 µm in the vicinity of the defect and 5 µm in the rest part are applied. i.e. the grains near the defect are each discretized on average with 50 elements while 10 elements for the remote grains. The model has approximately two million degrees of freedom. The finite element model is two-di-mensional, but the slip direction is in a three-dimensional space. The generalized plane strain hypothesis is used to take the deformation in the third direction into account. Isotropic texture is used in this model, which means this crystallographic aggregate can be considered as having no preferential orientations (seeFig. 3).
2.2. Material constitutive laws and fatigue approach 2.2.1. Crystal cubic elasticity
The anisotropy of metallic polycrystalline aggregates is due to its microstructure. The anisotropy of the material has two main sources that are the elastic anisotropy and the plastic deformation in the slip systems. To better describe the contribution to the anisotropy of elastic part and plastic part,Fig. 4presents an investigation on the mechanical response in polycrystal copper which shows an anisotropy factor of 3.26
[22]. In all the loading types, the cubic elastic model produces highly scattered results (gray scattered points inFig. 4a) compared to that of the isotropic elastic model (black straight line inFig. 4b). Even though the addition of crystal plasticity part to the cubic elastic model can slightly reduce the maximum shear stress in the highest value range, the
Table 1
Characteristics summary of the different configured model.
Model Configurations Number of simulations
Defect size Grain morphology Grain orientation Grain size
Batch1 6 values 4 kinds 24 sets 1 576
5, 15, 30, 60, 120, 200 µm Voronoi tessellations*4 Isotropic*24 15 µm
Batch2 6 values 4 kinds 24 sets 1 576
5, 15, 30, 60, 120, 200 µm Uniform tessellation, Voronoi tessellation, Log-normal Voronoi tessellation *2 Isotropic*24 15 µm
Batch3 3 values 4 kinds 12 sets 2 288
15, 60, 200 µm Voronoi tessellations*4 Isotropic*12 30,100 µm
results with or without crystal plasticity are still in quite good agree-ment as the distributionfits well the regression line. Even though the mechanism of fatigue is still linked to plastic deformation, the crack initiation is mostly local slip-driven, as is pointed out by Gao et al.[29]. More specifically, inherent surface defect, for instance, pores induce the slip dislocation and stress concentration[30]. Nevertheless, the aim of the numerical model is to use mechanical quantities to indicate fatigue initiation. Since stress concentration actives the slip dislocation, stress can be considered a relevant indicator of fatigue initiation. In terms of simulated mechanical responses under the HCF regime, especially the calculated stresses, the crystal plasticity part has limited influence. For the sake of simplicity, the constitutive model is characterized by crystal cubic elasticity in this study. The accuracy loss due to the missing of crystal plasticity is expected not to affect the main tendencies observed in our simulations.
Material used is the austenitic stainless steel 316L. On one hand, austenitic steel shows a Face-centered cubic (FCC) crystal structure having limited slip systems number (12 slip systems) compared to other microstructures which reduce the computation time. On another hand, austenitic steel has been widely used for several decades. Abundant related researches can be found in the literature. The anisotropic elas-ticity material constitutive law contains 3 independent coefficients describing the crystal stiffness tensor C1111, C1122 and C1212. The
anisotropic factor has a value of 3.64 which is close to the value 3.26 of the copper studied by Robert et al.[22]. Teklu et al.[31]calibrated these values for the Fe-18Cr-14Ni steel which are listed inTable 2. They are in good agreement with the parameters for the pureɣ-Fe[32]. All the grains share the same parameters while each of them has a different crystallographic orientation. Isotropic elasticity characterized by Young’s modulus and Poisson’s ratio is used to describe macroscopic homogeneity. The cubic elastic model is homogenized to make sure that it is equivalent to the isotropic elastic model for the isotropic textured situation at the macroscopic scale.
2.2.2. Fatigue criteria
As will be shown in the next part, the local stress state at the scale of the grains is most of the time multiaxial even if the macroscopic applied loading is a uniaxial one. To deal with these multiaxial states of stress and their effects on fatigue crack initiation, it is proposed to make use of multiaxial stress criteria detailed hereafter.
To reflect the oriented nature of fatigue crack initiation, stress cri-tical plane criteria have been proposed by many authors in the litera-ture[33]. They aim at reducing a multiaxial stress state to an equiva-lent uniaxial one and very often combine normal and shear stress parameters on a critical plane. Three representative stress-based criteria are used in this study: Matake[34], Dang Van[35], Papadopoulos[36].
2.2.2.1. Matake criterion. From many observations in the literature dealing with the fatigue of metallic materials, shear is the overwhelming mechanism of fatigue initiation. Matake proposed a criterion assuming that fatigue damage of material is due to the maximum shear stress amplitudeτa,maxalong with the normal stress
σn,maxin the plane of maximum shear stress.
The criterion is formulated as follows:
Fig. 3. Polefigures of (a) 100, (b) 111 orientation for the crystallographic or-ientations implanted in numerical models.
(a) Effect of cubic elasticity
(b) Effect of crystal plasticity
Fig. 4. Comparison of the maximal shear stress (a) between isotropic elasticity (Iso. E.) and cubic elasticity (Cub. E.). and (b) between cubic elasticity (Cub. E.) and cubic elasticity + crystal plasticity (Cub. E. + CP.)[22].
Table 2
Parameters of the constitutive models. Isotropic elasticity cubic elasticity
E (GPa) ν C1111 (GPa) C1122 (GPa) C1212 (GPa) anisotropic factor 2*C1212/(C1111 -C1122) 194 0.284 197 125 122 3.64
+ ≤
τa max, αmat n maxσ, βmat (1)
αmatandβmatare material parameters identified from tension and
tor-sion fatigue limit (s-1and t-1) by following equations:
= − − = − − α t s β t 2 1; mat mat 1 1 1 (2)
2.2.2.2. Dang van criterion. The Dang Van criterion is widely used for its multi-scale approach. He proposed that there are two parameters involved in the fatigue process, namely the microscopic shear stress in grain area and the microscopic hydrostatic stress, both assessed in the elastic shakedown state. The former is responsible for crack nucleation
along with slip bands and the later influences the crack opening
process. The criterion is mathematically formulated as follows:
+ ≤
max max{ [‖ ^ ( , )‖τ n t α σ^ ( )]}t β
t n _ _ dv hyd dv
_ (3)
In which, τ
_ denotes resolved shear stress andσhyd̂ denotes
hydro-static stress. As the cyclic loading changes with time, both τ
_ and ̂
σhyd
are time-dependent and are expressed in time functions. n
_ is the slip
systems in a grain.αdvandβdvare material parameters identified from
tension and torsion fatigue limit (s-1and t-1) by following equations:
= − − − = − − α t s s β t 2 3 ; dv dv 1 1 1 1 (4)
2.2.2.3. Papadopoulos criterion. In the case of the specimen subjected to a load below the fatigue limit, small cracks are often observed and do not propagate. Generalized shear stress amplitude (Ts a, ) and the
maximum value of normal stress (Σn) are combined to predict the
fatigue failure in the Papadopoulos criterion.
Instead of using the maximum value of resolved shear stress and normal stress, Papadopoulos chose the integral values of shear stress and normal stress along all the slip systems and slip planes. The cri-terion is given in the following equations:
+ ≤ Ts a αpapmax[ Σ ( ) ]t β t n pap , 2
∫ ∫ ∫
= = = = T π T dχsin θ dθdϕ 5 1 8 ( ) s a ϕ π θ π χ π s a , 2 2 0 2 0 2 0 2 , 2∫ ∫ ∫
= = = = t π t dχsin θ dθdϕ Σ ( ) 1 8 Σ ( ) ( ) n ϕ π θ π χ π n 2 0 2 0 2 0 2 (5) where αpapand βpapare material parameters identified from tension andtorsion fatigue limit (s-1and t-1) by the following equations:
= − − = − − α t s β t 3 3 ; pap pap 1 1 1 (6) The values of parameters mentioned above in these criteria are listed inTable 3.
2.2.3. Non-local method
In this research, the non-local method is based on the well-estab-lished“critical distance” theory. It supposed that there exists an effec-tive zone in which the grains affect each other mutually and lead to plastic deformation during the fatigue crack initiation[18]. Regarding its application to the numerical simulations there exists different ways to apply this theory, i.e. point method, line method, area method and
volume method[19]. In terms of the area method, which is used in this study, the determinant criterion mentioned above is adapted to the following form:
∫
≤(
σ dS)
S βS FIP (7)
in which,σFIP, S andβ are fatigue indicating parameter, the effective
zone, and the fatigue limit, respectively.
The critical distance is often determined by the effective crack length l0 introduced by El Haddad or an empirically derived value.
Successful applications were reported [37,38] on the homogeneous
models. It is expected that the critical zone has some connections with the microstructure. Particularly, the explicit microstructure modeling contains the sources of scatter e.g. the crystallographic orientations, the grain size, the grain morphology which is omitted in the homogeneous models.
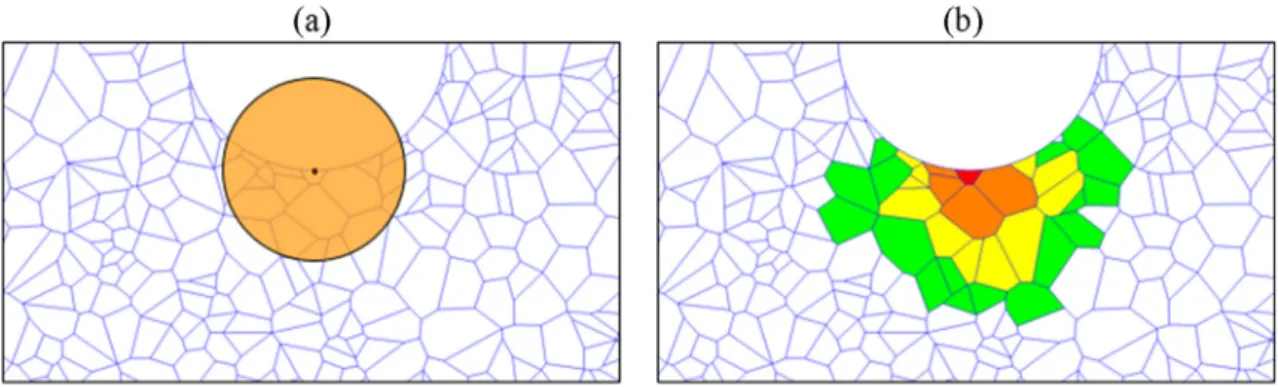
Two types of non-local approaches are examined in this paper: the critical radius method and the neighbor layer method. The sensitivity of the parameters to the microstructure features are evaluated. Two non-local parameters are proposed: R* and N*, which denotes the radius of this effective zone or the depth of neighbor layers respectively. These two different implementations of the non-local method stand for two different fatigue initiation mechanisms: critical radius method empha-sizes an effective area within a certain range without explicit con-sideration of actual microstructure configuration; neighbor layer method shows the interaction among adjacent grains and characterized by microstructural features as grain shape and grain size. Two sche-matic diagrams are shown in Fig. 5. The critical zones for the two methods are defined in Eq.7. In the literature, the non-local method is often applied locally, i.e. only the most stressed element or grain is chosen as the critical spot to which the non-local treatment is applied. The implementation of the non-local method in this study is a global treatment over the whole model. So, the extreme value can be obtained not only at the singular point of defect edge but also at several potential positions in the vicinity of defect which corresponds to the experi-mentalfinding.
= ≤ ∈
= ≤ ∈
∗ ∗
V element dist element e R element FEmodel V grain neighbor grain g N grain FEmodel
{ | ( , 0) , } { | ( , 0) , } e g 0 0 (8)
Identification and calibration of the non-local parameters can be laborious and are not the point of this research. We make a compromise on the accuracy of results by only trying several possible values. For the N*, 2,3,5,9 and 13 are tested representing thefirst layers, the first two layers, etc. This neighbor layer parameter is assumed to be of the same order of magnitude as the grain size. For the R*,five different values are tested in the following analysis, 15 µm, 30 µm, 60 µm,120 µm and 180 µm representing one, two, four, eight and twelve times of grain size, respectively.
3. Results
3.1. Application and evaluation of non-local method based on experimental results
The evaluation is based on 576 circular defected models with equiaxed morphology and 15 µm average grain size. These 576 models contain 6 different sizes denoted by the radii of circular defects: 5, 15, 30, 60, 120, 200 µm, respectively (shown inFig. 6). For each defect, 4 different realizations of grain shapes combined with 24 grain orienta-tions are applied. Among the 6 defect sizes, the 5 and 15 µm defects represent the defect within the range of one or two grains. The 30 and 60 µm defects represent the defects’ sizes on the order of several grains. The 120 and 200 µm defects represent the defects pass through a lot of grains.
Table 3
Parameters of the fatigue criteria for a 316L steel.
αmat βmat(MPa) αdv βdv(MPa) αpap βpap(MPa)
3.1.1. Mechanical analysis
The Von Mises equivalent stressfields for 6 finite element models with the same microstructures but different defect sizes are plotted in
Fig. 7. The defects inFig. 7a–f ranges from 5 to 200 µm as introduced
before. As far as the microstructure is concerned, the stress distribution of loaded polycrystalline is strongly heterogeneous. Even in the remote area to the defect, a strong loaded grain can have equivalent stress several times over that from an adjacent grain for their different crys-tallographic orientations. Moreover, the position of the most stressed element changes due to microstructure. This heterogeneity also has an influence on the stress concentration factor. The local stress con-centration factors from critical elements of all polycrystalline models are calculated and categorized by the defect size into 6 groups. Each group contains 96 different microstructure realizations. To present the scatter of calculated Kt, histograms, as well as distribution curves, are plotted inFig. 8. Average values and standard deviations for each group of models with the same defect are listed inTable 4. Refined meshes for
models with small defects are used to better capture the local stress concentration. For the isotropic models, the yielded Kt from models
with different defects is close to each other which makes the results from models containing explicit microstructure comparable. The cal-culated Ktfrom polycrystal models is always higher compared to that
from isotropic models because of the interaction among neighboring
grains. For the models containing small defects (5 µm and 15 µm), the defect may exist within one certain grain while larger defect passes through several grains which increases the influence of heterogeneity from grain boundary. Therefore, the Ktfrom polycrystal models with
small defects are smaller.
The mesoscopic quantities, namely the average shear stress ampli-tude in a grain (τa,g) and the average hydrostatic stress amplitude in a
grain (σh,a,g), are significant to characterize the fatigue initiation. The
bivariate distributions of these two quantities are plotted for the models with different defect sizes inFig. 9. Regarding the distribution of hy-drostatic stress amplitude, the general appearance looks like a quasi-normal distribution while for the distribution of shear stress amplitude, the general appearance is a skewed distribution. The stress state for each grain can be quite complex. Some grains are in uni-axial stress state while others are in multi-axial stress state. Even for the macro-scopic tension loading, there are grains subjected to compression loading locally. As the defect size increases, the distributions of both shear stress amplitude and hydrostatic stress amplitude show stronger dispersion. But a linear tendency can be observed between the shear stress and hydro-static stress, especially for the extreme value. In terms of the extreme values, the maximum values in large defect models can be two times larger than those of small defect models. The change of extreme value in the critical grain exaggerates the effect of defects on
Fig. 5. Schematic illustrations of non-local methods: (a) critical radius method and (b) neighbor layer method.
the fatigue behavior.
The mechanical analysis offers some validity to the hypothesis in the critical distance theory that the fatigue crack is not only due to one or several most stressed grain(s). Crack initiation is the mutual effect of a series of grains.
3.1.2. Fatigue analysis
Experimental research on the effect of defect has been conducted previously in authors’ laboratory[25]. The results of uni-axial tension and torsion fatigue tests with respect to different semi-spherical de-fected specimens are shown inFig. 10.
These experimental results reveal that the HCF behavior of 316L has
a tolerance of small defect for that the fatigue limit does not change greatly for a specimen with a defect inferior to several tens of µm. Moreover, scatter was observed from the test. For specimens with same defect size, their fatigue strengths may differ due to other influential factors as defect shape, microstructure, etc.
The Kitagawa-Takahashi diagrams are plotted for different non-local methods. The predicted fatigue limits of each non-non-local para-meters are normalized by the average prediction for the models con-taining 5 µm defect. This normalization is based on the experimental observation that non-propagating small defect has no influence on the fatigue behavior. The geometry parameter Area is chose to describe the defect size. In order to connect the two-dimensional simulations and the experimental results of three-dimensional semi-spherical defects, the artificial defects in 2D models are considered as notches in 3D
models. The method proposed by Murakami[39]to estimate the
ef-fective area for a very shallow circumferential notch and for roughness is adopted. In this way, the semi-circular defect in the studied model has an equivalent Murakami parameter calculated by the following equation:
=
Area 10r (9)
In which, r denotes the 2D defect radius.
Fig. 11shows the predictions of the“local method” for which the extreme values are from the most solicited elements. Error bars are used to represent the average value ± 1 standard deviation of the scattered normalized fatigue limits of models with different microstructures. To eliminate the dependency on the element size of the local integral point, a convergence test has been conducted. For the current micro-structure, each grain is discretized by approximate 60 three-ordered
Fig. 7. Von Mises equivalent stressfields in numerical models with same microstructure configuration but different defect size: (a) 5 µm; (b) 15 µm; (c) 30 µm; (d) 60 µm; (e) 120 µm; (f) 200 µm.
Fig. 8. Distribution of maximum local stress concentration factor in models with different microstructures but same defect size (defect size as legend).
Table 4
Local stress concentration factor with respect to different defect radius.
Defect Radius (µm) 5 15 30 60 120 200
Kt(isotropic model) 2.78 2.81 2.81 2.81 2.78 2.85
elements. For notched/defected models, it can be seen that the pre-dictions are always too conservative because of the sensitivity to the stress concentration.
The non-local methods show good tolerance for the small defects, presented inFig. 12. For a certain size of the defect, the larger non-local parameters yield the higher predicted fatigue limits. As the values of non-local parameters increase, the sizes of error bars decrease. Changes in the standard deviation demonstrate the different sensitivities to the microstructure of different values of non-local parameters. All three criteria yield similar predictions. From a qualitative perspective, the application of non-local methods gives a good description of the trend of the defect size effect on the high cycle fatigue behavior. From a
quantitative perspective, the values of non-local parameters can be evaluated by comparing it to the experimental data. The data are pre-sented inTable 5and are plotted in the Kitagawa-Takahashi diagrams. Atfirst glance, none of the 10 chosen parameters can perfectly fit the experimental data. The small parameters (i.e. R*=0.030 mm or N*=3) work well for the small defects but the predictions drop quickly when the defect size increases. The intermediate values (R*=0.060 mm or N*=5) can yield good predictions for the large defect size but they overestimate the performance of the small defect. The large parameters always overestimate the fatigue limit for the defects in this range. We may suppose that the non-local parameters have a connection with the defect size. But the fatigue experiments for defective material, espe-cially for the material having small defects can be hardly achievable
Fig. 9. Distributions of grain-average hydrostatic stress amplitude and shear stress amplitude in numerical models with same microstructure configuration but different defect size: (a) 5 µm; (b) 15 µm; (c) 30 µm; (d) 60 µm; (e) 120 µm; (f) 200 µm.
Fig. 10. Results of the fatigue tests conducted on the 316L steel in uniaxial tension and torsion with a loading ratio R =−1[25].
because the error of artificial defect size can usually be ± 20 µm. Be-sides, the scatter in HCF experimental results can be a concern that the accurate fatigue limit can hardly be obtained. Because of these limita-tions of experiments, we cannot determine whether the non-local parameter is a material constant which only depends on the kind of material or not. Considering that our main objective is to propose a
numerical method to evaluate the effect of common defects which
usually range within several hundreds of micrometers, we may say that when the N* equals to 5 or the R* equals 0.060 mm, the predictions are acceptable.
We use the box-and-whisker plot to better present the dispersion in the fatigue predictions of different criteria (Fig. 13). The box indicates thefirst and third quartiles by its upper and lower bound. The band
inside the box represents the median value. Values with 1.5 inter-quartile range (IQR) of the lower inter-quartile or of the upper inter-quartile are considered maximum and minimum values shown by the ends of whisker. The black diamond marker represents the out-of-range value. Each box in thefigures represents the distribution of the predicted fa-tigue limits from 96 models containing 4 different sets of grain position and morphology and 24 different crystallographic orientations. All three criteria show sensitivity to the microstructure. Among the three criteria, the Matake criterion is apt to yield higher predictions com-pared to the other two. Apart from the shear stress which is considered as the principal cause of fatigue failure, the Matake criterion uses the maximum normal stress, while the other two use the maximum hydro-static stress, as the subsidiary factor. The difference between Dang Van criterion and Papadopoulos criterion is the way to calculate resolved shear stress as Dang Van uses the maximum shear stress from all the slip systems, while Papadopoulos integrates the shear stress on the slip systems. There are only minor differences in these tested criteria and we cannot judge which criterion can be the best because of the restriction of our limited simulation configurations. The application of fatigue
Fig. 12. Normalized Kitagawa-Takahashi diagrams with the application of (a) critical radius Dang Van criterion; (b) neighbor layer Dang Van criterion; (c) critical radius Matake criterion; (d) neighbor layer Matake criterion; (e) critical radius Papadopoulos criterion; (f) neighbor layer Papadopoulos criterion.
Table 5
Experimental results for defective steel 316L.
Equivalent Murakami parameter Area[µm] 31 60 229 320 Experimental fatigue limitΣ0[MPa] 232.5 212.5 180 152.5
criterion should be based on the mechanism involved in the fatigue failure. Overall, all three criteria are compatible with the multi-axial stress state. By comparing the predictions of the neighbor layers method and the critical radius method, we can see that the neighbor layers method is more sensitive to the microstructure while the latter can still present the effect of microstructure. For the defects which are of several grains size, stronger dispersion can be seen which indicates the com-petition between the defect and the microstructure. The explicit mi-crostructure modeling coupled with the non-local fatigue analysis method can explain well the experimental observation on metallic polycrystalline aggregate’s high cycle fatigue behavior where the main source of scatter comes from the microscopic features.
Two microscopic parameters are considered in the explicit micro-structure sensitive model. In Fig. 14, these two parameters are pre-sented separately. Each box represents the twenty-four predictions from Dang Van criterion of different crystallographic orientations. The
concatenated four boxes stand for the four different grain positions respectively. The effect of grain orientation can be observed in the re-sults of both methods. Different grain orientations can result in a dif-ference of 20 MPa of the fatigue limit. As is mentioned before, the grain morphology is equiaxed in the numerical model. It is expected the neighbor layer method and the critical radius method would have si-milar outputs for the same grain arrangement. Surprisingly, the neighbor layer method is sensitive to the grain position and mor-phology while the critical radius method gives similar predictions re-gardless of grain position and morphology. This comparison shows different application scenarios of the two methods. A further study about the grain morphology’s effect on the two methods is presented in the following section.
Fig. 13. Fatigue limit intervals of 96 models containing the same defect but different microstructure from the criteria: Dang Van, Matake, Papadopoulos. (a) critical radius method (b) neighbor layer method.
Fig. 14. Fatigue limit intervals of 24 models containing the same defects and grain shapes but different grain orientations from the criterion: Dang Van. (a) critical radius method (b) neighbor layer method.
3.2. Further investigation of the non-local method on the microstructure effect
Several characteristic features are often used to describe the mi-crostructure of polycrystalline, i.e. grain morphology, grain size, and grain texture. These microstructural parameters are usually determined by the fabrication process and affect both the mechanical and fatigue responses. To expand the application of the proposed non-local methods, it is of great value to study the effect of microstructural parameters. Considering the conventional fabricated metallic materials are often isotropic textured, only the effects of grain morphology and of grain size are investigated in the present study.
3.2.1. Effect of grain morphology
In the previous polycrystalline FE models which served as the benchmark, Voronoi polygon tessellation is employed for its simple implementation and quasi-reality as many other pieces of research did
[13]. Theoretically, the distribution of Voronoi polygons’ equivalent sizefits the Gaussian distribution, which is an approximation of many experimental observations on EBSD cartography of metallic poly-crystalline aggregates [40]. The average grain size 15 µm is used as position parameter (µ) for Gaussian distribution while the shape para-meter (σ) is 35% of the grain size. A histogram representing the dis-tribution of the Voronoi polygon tessellated models is shown inFig. 15. To explore the effect of grain morphology on the proposed non-local methods, more different configurations are implemented for compar-ison. The quadrangle tessellated model (shown inFig. 15b andFig. 16b) is chosen as the simplest description where all the grains are identical in size and form. This tessellation is the most efficient modeling method although it loses some fidelity of microstructure. Additionally, the
manufacturing process affects the sizes and shapes of grains. Log-normal distribution was adopted in previous report[41]to describe the grain size distributions obtained by full re-crystallization or additive manufacturing. As our objective is to test the non-local methods’ compatibility with different kinds of microstructure but not to re-produce the experimental results, two log-normal distributions (Figs. 15c, d,16c and d) with different artificial parameters are used in the following simulations. Both have an average grain size of 15 µm. But the latter is more deviated distributed which leads to the appear-ance of more small grains.
The predictions from the fatigue criteria of two non-local methods are shown inFig. 17. Regarding the sensitivity of the grain morphology for small defects where the defect size is within the range of two grains, the uniform distributed tessellation gives the highest prediction. The Gaussian distributed tessellation has the intermediate result. For the log-normal distributed tessellation, the more deviated is the distribu-tion, the lower is the prediction. Hence, for small defect, both the neighbor layer method and the critical radius method lessen the pre-dictions if more and more small grains are involved in the effective zone. Comparing the numerical values of prediction, the difference of averages generated by different tessellation is about 1% in the neighbor layer method’s prediction and does not exceed 5% in the critical radius method’s prediction. Both predictions can be considered stable.
When the defect size increases to several grains’ size, different trends are observed for the two methods. The critical radius method gives similar predictions for all the four tessellations which means only the defect size has an influence on the fatigue performance compared to the grain morphology. The neighbor layer method shows the compe-tition between defect and grain morphology. For instance, the di ffer-ence between the prediction of the second log-normal distributed model
Fig. 15. Histograms of grain size for different grain morphology configurations: (a) Gaussian distributed Voronoi polygon (b) uniform distributed quadrangle (c) log-normal distributed Voronoi 1 (d) log-log-normal distributed Voronoi 2.
and the square tessellated model for a 120 µm defect is more than 20%.
Fig. 18shows the effective areas considered in the two methods from different tessellated models. Effective area in neighbor layer method is very dependent upon the microstructure (size and shape of grains) while the area in critical radius method is independent of the grain size and morphology.
The analysis reveals that when using the neighbor layer method, the microstructure should be considered while a simple tessellation can be used with the critical radius method without changing predictions.
Unlike conventional fabricated materials where equiaxed grains are frequently encountered, in additive manufacturing, as-built parts often have elongated grain morphology along with the presence of veryfine grains near the surface. The neighbor layer method could be a better choice in this situation because it can reflect more microstructural characteristics.
3.2.2. Effect of grain size
Regarding the explicit microstructure modeling, the role of grain size should be explored. Based on the simulations presented in the previous section, two more batches of numerical models representing coarse grains having the size of 30 µm and 100 µm, respectively, were built up and tested.Fig. 19shows the schematic of numerical models with different grain sizes.
It is generally accepted that the fatigue or endurance strength of planar slip materials, such as steel and brass, is increased by refining the grain size, whereas, in wavy slip materials, such as pure copper and pure aluminum, the fatigue strength is unaffected. For example, ex-periments of alpha brass indicated the decreasing grain size acts to increase fatigue life while the copper and aluminum show the opposite tendency that grain size has a negligible effect on fatigue behavior[42]. For the defective materials, it is reported that the critical defect size varies linearly with grain size for steel[43]. The plot of effective defect size against the average grain size is presented inFig. 20. Nevertheless, the exact relation between fatigue phenomenon and defective mate-rials’ microstructure remains an open question because of limited lit-erature.
The choice of non-local method parameters for this batch of models cannot be quantitatively verified due to the lack of experimental results. So, R* and N* are set to 60 µm and 5 respectively from the previous calibrations from benchmark models. The hypothesis behind the choice
of R* is that a circular area with a radius of 60 µm is effective when fatigue crack initiates. And the choice of N* implies 5 layers of adjacent grains contribute together to result in fatigue initiation. The effective defect size is defined as the critical size where the predicted fatigue limit drops 10% compared to the prediction of the smooth model. Due to the geometrical size of our finite element model, effective crack length defined by Haddad[12], which corresponds to a defect causing fatigue strength drop to 70%, is not achievable. The value is linearly interpolated from the Kitagawa-Takahashi diagram based on the threshold stress intensity theory. As can be seen inFig. 21, the critical radius method shows a strong sensitivity to the grain size. It corre-sponds to the experimental trends for the steels. Unlike the critical ra-dius method, the neighbor layer method yields similar results when the grain size changes when the value of N* isfixed at 5. These tests re-garding grain size reveal that for a non-local parameter whose value is pre-fixed, the effective area considered for critical radius method or for neighbor layer method may vary if the microstructure is changed. The critical radius method emphasizes the influence of defect size while the neighbor layer method pays more attention to microstructural factors. Considering the realities in experiments, both methods have their ap-plication scenario, but care must be taken when choosing the parameter value. Under certain circumstances where exact calibrations of non-local parameters are not attainable, for materials like the steel of which a linear relationship between critical defect size and grain size was reported, an approximate value of R* can be applied as it displays sensitivity to the change of grain size. For other materials like cast aluminum alloy where the microstructure is often characterized not by grain size but by dendrite arm spacing, similar N* may be used because of its independence of the specific size of grain.
4. Conclusions
The effect of defects and microstructure, as well as their competition on the fatigue behavior of polycrystal aggregate, are investigated by the non-local method along with thefinite element method.
By creating an explicit virtual microstructurefinite element model, the local mechanical response from elements and mesoscopic grain-average characteristic stress distribution are obtained. It is revealed by the mechanical analysis that the microstructure introduces a strong heterogeneity as the defect brings a strong stress concentration. To
Fig. 16. Illustrations of different grain morphology configurations: (a) Gaussian distributed Voronoi polygon (b) uniform distributed quadrangle (c) log-normal distributed Voronoi 1 (d) log-normal distributed Voronoi 2.
Fig. 17. Fatigue limit intervals of 24 models containing same defects but different grain morphology from (a) critical radius Dang Van criterion; (b) neighbor layer Dang Van criterion; (c) critical radius Matake criterion; (d) neighbor layer Matake criterion; (e) critical radius Papadopoulos criterion; (f) neighbor layer Papadopoulos criterion.
better assess the effect of defects on fatigue behavior, the micro-structure is an essential factor.
However, a local approach cannot reflect the Kitagawa-Takahashi effect properly during numerical simulation since the LEFM theory does not work well in the fatigue crack initiation stage. Overemphasized results are obtained from the local approach in this study.
By introducing the non-local method, the fatigue prediction based on both defects and microstructure can be achieved. In terms of the influence of changing defect size on fatigue performance, the simula-tions and experiments are in good agreement in the qualitative aspect. The tolerance of small defect and the perceptible influence of larger defects can be clearly shown with the application of the non-local method. The dispersion of results due to microstructure attributes are shown and discussed. Especially, for the medium-sized defect, the wide dispersion demonstrates the competition between defect and local mi-crostructure.
Three multi-axial stress-based fatigue criteria are used and eval-uated. All three criteria can present the Kitagawa-Takahashi effect that a very small defect has a negligible influence on high cycle fatigue strength. Matake criterion always provides the most elevated fatigue limit. Because the secondary parameter initiator is normal stress in Matake criterion and is hydrostatic stress in the other two criteria. Further comparison between Dang Van and Papadopoulos criteria shows the influence of stochasticity in microstructure, the maximum resolved shear stress in slip directions in Dang Van criterion is not al-ways higher than its integrated counterpart in Papadopoulos criterion. Regarding the realizations of the non-local method, the neighbor layer method is more sensitive to the microstructure. Stronger scatters can be seen in the results of different configurated models from the neighbor layer method compared to those from the critical radius method.
Further investigations on grain morphology and grain size distin-guish the difference between the proposed critical radius method and neighbor layer method. The sensitivity to the grain size is also depen-dent upon the non-local model employed. Each method has its ad-vantages in different application scenarios. With an appropriate choice
of non-local parameter as well as understandings of materials’ sensi-tivity to microstructure, it is expected the non-local method can be applied to different metallic materials.
Fig. 18. Effective areas of critical radius method and neighbor layer method in different studied microstructures: (a) uniform distributed grains and (b) log-normal distributed grains.
Fig. 19. Illustrations of different grain size configurations: (a) 30 µm; (b) 100 µm.
Fig. 20. Relationship between grain size and effective crack length (replot from
Declaration of Competing Interest
The authors declare that they have no known competingfinancial interests or personal relationships that could have appeared to in flu-ence the work reported in this paper.
References
[1] McDowell DL, Dunne FPE. Microstructure-sensitive computational modeling of fa-tigue crack formation. Int J Fafa-tigue 2010;32:1521–42.https://doi.org/10.1016/j. ijfatigue.2010.01.003.
[2] Schwartz J, Fandeur O, Rey C. Numerical approach of cyclic behaviour of 316LN stainless steel based on a polycrystal modelling including strain gradients. Int J Fatigue 2013;55:202–12.https://doi.org/10.1016/j.ijfatigue.2013.07.003. [3] Briffod F, Shiraiwa T, Enoki M. Microstructure modeling and crystal plasticity
si-mulations for the evaluation of fatigue crack initiation inα-iron specimen including an elliptic defect. Mater Sci Eng A 2017;695:165–77.https://doi.org/10.1016/j. msea.2017.04.030.
[4] Nadot Y, Mendez J, Ranganathan N, Beranger AS. Fatigue life assessment of nodular cast iron containing casting defects. Fatigue Fract Eng Mater Struct
1999;22:289–300.https://doi.org/10.1046/j.1460-2695.1999.00162.x. [5] Le VD, Saintier N, Morel F, Bellett D, Osmond P. Investigation of the effect of
porosity on the high cycle fatigue behaviour of cast Al-Si alloy by X-ray micro-tomography. Int J Fatigue 2018;106:24–37.https://doi.org/10.1016/j.ijfatigue. 2017.09.012.
[6] Le VD, Pessard E, Morel F, Edy F. Interpretation of the fatigue anisotropy of addi-tively manufactured TA6V alloys via a fracture mechanics approach. Eng Fract Mech 2019;214:410–26.https://doi.org/10.1016/j.engfracmech.2019.03.048. [7] Billaudeau T, Nadot Y, Bezine G. Multiaxial fatigue limit for defective materials:
Mechanisms and experiments. Acta Mater 2004;52:3911–20.https://doi.org/10. 1016/j.actamat.2004.05.006.
[8] Abroug F, Pessard E, Germain G, Morel F. HCF of AA7050 alloy containing surface defects: Study of the statistical size effect. Int J Fatigue 2018;110:81–94.https:// doi.org/10.1016/j.ijfatigue.2018.01.012.
[9] Vincent M, Nadot Y, Nadot-Martin C, Dragon A. Interaction between a surface de-fect and grain size under high cycle fatigue loading: Experimental approach for Armco iron. Int J Fatigue 2016;87:81–90.https://doi.org/10.1016/j.ijfatigue.2016. 01.013.
[10] Bracquart B, Mareau C, Saintier N, Morel F. Experimental study of the impact of geometrical defects on the high cycle fatigue behavior of polycrystalline aluminium with different grain sizes. Int J Fatigue 2018;109:17–25.https://doi.org/10.1016/j. ijfatigue.2017.12.009.
[11] Kitagawa H, Takahashi S. Applicability of Fracture Mechanics to Very Small Cracks or the Cracks in the Early Stage. Proc. Conf Mech Behav Mater 1976:627–39. [12] El Haddad MH, Smith KN, Topper TH. Fatigue Crack Propagation of Short Cracks. J
Eng Mater Technol 1979;101:42.https://doi.org/10.1115/1.3443647. [13] Guilhem Y, Basseville S, Curtit F, Stéphan JM, Cailletaud G. Investigation of the
effect of grain clusters on fatigue crack initiation in polycrystals. Int J Fatigue 2010;32:1748–63.https://doi.org/10.1016/j.ijfatigue.2010.04.003. [14] Lukáš P, Kunz L. Comparison of fatigue behaviour of single crystals and
poly-crystals. Mater Sci Eng A 1994;189:1–7.https://doi.org/10.1016/0921-5093(94) 90395-6.
[15] McDowell DL. Simulation-based strategies for microstructure-sensitive fatigue modeling. Mater Sci Eng A 2007;468–470:4–14.https://doi.org/10.1016/j.msea. 2006.08.129.
[16] Yao W, Xia K, Gu Y. On the fatigue notch factor. Kf. Int J Fatigue 1995;17:245–51.
https://doi.org/10.1016/0142-1123(95)93538-D.
[17] Qylafku G, Azari Z, Kadi N, Gjonaj M, Pluvinage G. Application of a new model proposal for fatigue life prediction on notches and key-seats. Int J Fatigue 1999;21:753–60.https://doi.org/10.1016/S0142-1123(99)00046-8.
[18] Taylor D. Geometrical effects in fatigue: a unifying theoretical model. Int J Fatigue 1999;21:413–20.https://doi.org/10.1016/S0142-1123(99)00007-9.
[19] Bellett D, Taylor D, Marco S, Mazzeo E, Guillois J, Pircher T. The fatigue behaviour of three-dimensional stress concentrations. Int J Fatigue 2005;27:207–21.https:// doi.org/10.1016/j.ijfatigue.2004.07.006.
[20] Vayssette B, Saintier N, Brugger C, El May M, Pessard E. Numerical modelling of surface roughness effect on the fatigue behavior of Ti-6Al-4V obtained by additive manufacturing. Int J Fatigue 2019;123:180–95.https://doi.org/10.1016/j. ijfatigue.2019.02.014.
[21] Guerchais R, Morel F, Saintier N. Effect of defect size and shape on the high-cycle fatigue behavior. Int J Fatigue 2017;100:530–9.https://doi.org/10.1016/j. ijfatigue.2016.12.010.
[22] Robert C, Saintier N, Palin-Luc T, Morel F. Micro-mechanical modelling of high cycle fatigue behaviour of metals under multiaxial loads. Mech Mater 2012;55:112–29.https://doi.org/10.1016/j.mechmat.2012.08.006.
[23] Sauzay M. Cubic elasticity and stress distribution at the free surface of polycrystals. Acta Mater 2007;55:1193–202.https://doi.org/10.1016/J.ACTAMAT.2006.09. 035.
[24] Hor A, Saintier N, Robert C, Palin-Luc T, Morel F. Statistical assessment of multi-axial HCF criteria at the grain scale. Int J Fatigue 2014;67:151–8.https://doi.org/ 10.1016/j.ijfatigue.2014.01.024.
[25] Guerchais R, Morel F, Saintier N, Robert C. Influence of the microstructure and voids on the high-cycle fatigue strength of 316L stainless steel under multiaxial loading. Fatigue Fract Eng Mater Struct 2015;38:1087–104.https://doi.org/10. 1111/ffe.12304.
[26] Robert C, Mareau C. A comparison between different numerical methods for the modeling of polycrystalline materials with an elastic-viscoplastic behavior. Comput Mater Sci 2015;103:134–44.https://doi.org/10.1016/j.commatsci.2015.03.028. [27] Quey R, Dawson PR, Barbe F. Large-scale 3D random polycrystals for thefinite
element method: Generation, meshing and remeshing. Comput Methods Appl Mech Eng 2011;200:1729–45.https://doi.org/10.1016/j.cma.2011.01.002.
[28] Geuzaine C, Remacle JF. Gmsh: A 3-Dfinite element mesh generator with built-in pre- and post-processing facilities. Int J Numer Methods Eng 2009;79:1309–31. https://doi.org/10.1002/nme.2579.
[29] Gao Y, Stölken JS, Kumar M, Ritchie RO. High-cycle fatigue of nickel-base super-alloy René 104 (ME3): Interaction of microstructurally small cracks with grain boundaries of known character. Acta Mater 2007;55:3155–67.https://doi.org/10. 1016/j.actamat.2007.01.033.
[30] Jiang R, Bull DJ, Evangelou A, Harte A, Pierron F, Sinclair I, et al. Strain accu-mulation and fatigue crack initiation at pores and carbides in a SX superalloy at room temperature. Int J Fatigue 2018;114:22–33.https://doi.org/10.1016/j. ijfatigue.2018.05.003.
[31] Teklu A, Ledbetter H, Kim S, Boatner LA, McGuire M, Keppens V. Single-crystal elastic constants of Fe-15Ni-15Cr alloy. Metall Mater Trans A Phys Metall Mater Sci 2004;35A:3149–54.https://doi.org/10.1007/s11661-004-0059-y.
[32] Huntington HB. The elastic constants of crystals. Solid State Phys– Adv Res Appl 1958;7:213–351.https://doi.org/10.1016/S0081-1947(08)60553-6.
[33] Karolczuk A, Macha E. A review of critical plane orientations in multiaxial fatigue failure criteria of metallic materials. Int J Fract 2005;134:267–304.https://doi.org/ 10.1007/s10704-005-1088-2.
[34] Matake T. An explanation on fatigue limit under combined stress. Bull JSME 1977;20:257–63.
[35] Dang Van K, Cailletaud G, Flavenot JF, Le Douaron A, Lieurade HP. Criterion for high cycle fatigue failure under multuiaxial loading. Biaxial Multiaxial Fatigue 1989:459–78.
[36] Papadopoulos IV, Panoskaltsis VP. Invariant formulation of a gradient dependent multiaxial high-cycle fatigue criterion. Eng Fract Mech 1996;55:513–28.https:// doi.org/10.1016/S0013-7944(96)00047-1.
[37] El May M, Saintier N, Palin-Luc T, Devos O. Non-local high cycle fatigue strength criterion for metallic materials with corrosion defects. Fatigue Fract Eng Mater Struct 2015;38:1017–25.https://doi.org/10.1111/ffe.12329.
[38] Krzyżak D, Robak G, Łagoda T. Non-local line method for notched elements with use of effective length calculated in an elasto-plastic condition. Fatigue Fract Eng Mater Struct 2017;40:89–102.https://doi.org/10.1111/ffe.12478.
[39] Murakami Y. Metal Fatigue: Effects of Small Defects and Nonmetallic Inclusions. Elsevier Science Ltd; 2002.
[40] Baudoin P, Magnier V, El Bartali A, Witz JF, Dufrenoy P, Demilly F, et al. Numerical investigation of fatigue strength of grain size gradient materials under hetero-geneous stress states in a notched specimen. Int J Fatigue 2016;87:132–42.https:// doi.org/10.1016/j.ijfatigue.2016.01.022.
[41] Toth LS, Biswas S, Gu C, Beausir B. Notes on representing grain size distributions obtained by electron backscatter diffraction. Mater Charact 2013;84:67–71. https://doi.org/10.1016/j.matchar.2013.07.013.
[42] Thompson AW, Backofen WA. The effect of grain size on fatigue. Acta Metall 1971;19:597–606.https://doi.org/10.1016/0001-6160(71)90012-5.
[43] Masounave J, Baflon JP. Effect of grain size on the threshold stress intensity factor in fatigue of a ferritic steel. Scr Metall 1976;10:165–70.https://doi.org/10.1016/ 0036-9748(76)90142-3.
Fig. 21. Effective defect sizes for different average grain size configurations of proposed realizations of non-local method and pre-fixed parameter values.