Blood Pressure and Cerebral White Matter Share Common
Genetic Factors in Mexican Americans
Peter Kochunov, David C. Glahn, Jack Lancaster, Anderson Winkler, Kathrin Karlsgodt,
Rene L. Olvera, Joanna E. Curran, Melanie A. Carless, Thomas D. Dyer, Laura Almasy,
Ravi Duggirala, Peter T. Fox, John Blangero
Abstract—Elevated arterial pulse pressure and blood pressure (BP) can lead to atrophy of cerebral white matter (WM),
potentially attributable to shared genetic factors. We calculated the magnitude of shared genetic variance between BP and fractional anisotropy of water diffusion, a sensitive measurement of WM integrity in a well-characterized population of Mexican Americans. The patterns of whole-brain and regional genetic overlap between BP and fractional anisotropy were interpreted in the context the pulse-wave encephalopathy theory. We also tested whether regional pattern in genetic pleiotropy is modulated by the phylogeny of WM development. BP and high-resolution (1.7⫻1.7⫻3 mm; 55 directions) diffusion tensor imaging data were analyzed for 332 (202 females; mean age 47.9⫾13.3 years) members of the San Antonio Family Heart Study. Bivariate genetic correlation analysis was used to calculate the genetic overlap between several BP measurements (pulse pressure, systolic BP, and diastolic BP) and fractional anisotropy (whole-brain and regional values). Intersubject variance in pulse pressure and systolic BP exhibited a significant genetic overlap with variance in whole-brain fractional anisotropy values, sharing 36% and 22% of genetic variance, respectively. Regionally, shared genetic variance was significantly influenced by rates of WM development (r⫽⫺0.75; P⫽0.01). The pattern of genetic overlap between BP and WM integrity was generally in agreement with the pulse-wave encephalopathy theory. Our study provides evidence that a set of pleiotropically acting genetic factors jointly influence phenotypic variation in BP and WM integrity. The magnitude of this overlap appears to be influenced by phylogeny of WM development, suggesting a possible role for genotype-by-age interactions. (Hypertension. 2011;57:330-335.) ● Online Data Supplement
Key Words: population science 䡲 genetics 䡲 blood pressure 䡲 pulse pressure 䡲 white matter integrity
䡲 fractional anisotropy 䡲 diffusion tensor imaging 䡲 DTI
E
levated blood pressure (BP) is a well-known risk factor for atrophy of cerebral white matter (WM), and this can lead to cognitive decline and disability in the elderly.1BP andthe integrity of cerebral WM are under strong genetic control, with up to 80% of individual variance explained by genetic factors.2– 8We hypothesized that the genetic factors
respon-sible for elevation in BP were also responrespon-sible for decline in WM integrity. This hypothesis was tested in a well-characterized population of Mexican Americans randomly selected from large extended families.9 WM integrity was
gauged as fractional anisotropy (FA) using diffusion tensor imaging (DTI), a fully quantitative technique that is capable of ascertaining subtle decline in WM integrity.10
First, we investigated whether shared genetic variance between BP and FA measurements was consistent with the pulse-wave encephalopathy (PWE) theory, as suggested pre-viously.5,6 PWE posits the direct and indirect biological
effects to explain the regional pattern of BP-related decline in the integrity of cerebral WM.11–13 The direct PWE effect
suggests that an increase in arterial pulse pressure (PP) can lead to gliosis of periventricular WM resulting from mechan-ical damages associated with increased amplitude of cerebro-spinal fluid movement.5 The indirect PWE effect suggests
that an increase in systolic BP (SBP) can lead to focal gliosis in subcortical WM because of stenosis and loss of permeabil-ity of small cerebral blood vessels.13,14Next, we investigated
whether shared genetic variance between BP and FA was influenced by a difference in WM development rates.15
Previous studies suggested a connection between the rates of cerebral development and the genetic contribution to the variance of several brain structures.16,17Development of WM
tracts associated with higher cognitive function follow a more protracted trajectory, with larger FA increases per year than sensory and motor tracts.15 We therefore investigated
Received August 31, 2010; first decision September 22, 2010; revision accepted November 9, 2010.
From the Research Imaging Institute (P.K., D.C.G., J.L., A.W., R.O., P.T.F.), University of Texas Health Science Center at San Antonio, San Antonio, TX; Department of Psychiatry (D.C.G., A.W.), Yale University and Olin Neuropsychiatry Research Center, Institute of Living, Hartford, CT; Department of Psychiatry (K.K.), Cognitive Neuroscience Center, University of California Los Angeles, Los Angeles, CA; and Department of Genetics (P.K., J.E.C., M.A.C., T.D.D., L.A., R.D., J.B.), Southwest Foundation for Biomedical Research, San Antonio, TX.
Correspondence to Peter Kochunov, University of Texas Health Science Center at San Antonio, Research Imaging Institute, 7703 Floyd Curl Dr, San Antonio, TX 78284. E-mail kochunov@uthscsa.edu
© 2011 American Heart Association, Inc.
Hypertension is available at http://hyper.ahajournals.org DOI: 10.1161/HYPERTENSIONAHA.110.162206
whether WM tracts that exhibit high maturation rates would be more susceptible to detrimental effects of ele-vated BP and would therefore show more genetic overlap with the BP measurements.
Methods
Subjects and MeasurementsAnalyses were performed in 332 (202 females) active participants in
the San Antonio Family Heart Study (SAFHS)9for whom DTI and
BP measurements were available. Participants in the SAFHS study are urban-dwelling Mexican Americans from large extended pedi-grees selected randomly from the community. These subjects are characterized by a relatively adverse cardiovascular risk profile, including increased rates of obesity, dyslipidemia, glucose intoler-ance, and hyperinsulinemia, compared with non-Hispanic whites in
San Antonio.9 Subjects ranged in age from 19 to 79 years
(47.9⫾13.3 years) and were part of 45 families (9.2⫾8.1 individuals per family; range 2 to 35). Among the 400 subjects recruited for this study, 39 were excluded from MRI for MRI contraindications (n⫽31), history of neurological illnesses (n⫽5), or stroke, transient ischemic attack, or other major neurological event (n⫽3). DTI data were not collected for 29 subjects because a subject was unable to complete the MRI session (n⫽22), scanner malfunction (n⫽4), and other reasons (n⫽3). At the time of collection of BP measurements, 117 subjects (35%; 72 females; average age 54.8⫾13.0 years) were diagnosed with hypertension, including 44 subjects (31 female;
average age 58.7⫾12.2 years) who were observed to be taking
antihypertensive medications (all antihypertension drugs were di-rectly visually verified and recorded). There was no evidence for hypotension in this cohort, with none of the individuals exhibiting
BPs with an SBP of ⬍90 mm Hg and/or diastolic BP (DBP)
⬍60 mm Hg. In addition,133 subjects were obese (body mass index ⬎30), 96 subjects had elevated cholesterol levels (total cholesterol levels⬎200 mg/dL), 22 subjects had elevated blood lipids (⬎150 mg/dL), 63 subjects were reported to have type 2 diabetes, and 12 subjects were reported to have coronary heart disorders (supplemen-tal Table I, available online at http://hyper.ahajournals.org). Alcohol and depression disorders were not exclusion criteria, with 26 subjects reporting alcohol dependence and 99 subjects reporting a lifetime major depressive episode (supplemental Table I). All subjects provided written informed consent on forms approved by the institutional review board of the University of Texas Health Science Center at San Antonio.
BP Measurements
Collection of SBP and DBP measurements was detailed in
Ruther-ford et al2 and proceed the imaging by an average of 3.0⫾0.8
(maximum 5.3) years. In short, SBP and DBP measurements were performed using a random-zero sphygmomanometer on the left arm. Three measurements were performed with 5-minute intervals, and the average of the last 2 measurements was used as trait value. PP was calculated as the difference between SBP and DBP. The average ⫾SD SBP, DBP, and PP values were 122.6⫾16.6, 71.3⫾10.8, and 51.3⫾14.2, respectively.2
DTI and Processing
DTI was performed at the Research Imaging Institute, University of Texas Health Science Center at San Antonio, on a Siemens 3T Trio scanner. A single-shot, single refocusing spin-echo, echo-planar imaging sequence was used to acquire diffusion-weighted data, with a spatial resolution of 1.7⫻1.7⫻3.0 mm. The sequence parameters were echo time/repetition time⫽87/8000 ms; field of view⫽200 mm; 55 isotropically distributed weighted directions; 2 diffusion-weighted values; b⫽0 and 700 s/mm2 and 3 b⫽0
(nondiffusion-weighted) images. These parameters were calculated using an optimization technique that maximizes the contrast to noise ratio for FA measurements.18
Details for the processing of DTI scans have been discussed previously.3,19,20In short, the tract-based spatial statistics software21
was used for multisubject analysis of FA images. FA images were created by fitting the diffusion tensor to the raw diffusion data.22All FA images were nonlinearly aligned to a group-wise, minimal-deformation target brain.23Next, individual FA images were aver-aged to produce a group-average anisotropy image. This image is used to create a group-wise skeleton of WM tracts that encodes the medial trajectory of the WM fiber tracts. Finally, FA values from each image were projected onto the group-wise skeleton of WM structures. This step accounts for residual misalignment among individual WM tracts. FA values are assigned to each point along a skeleton using the peak value found within a 20-mm distance perpendicular to the skeleton. The FA values vary rapidly perpen-dicular to the tract direction but very slowly along the tract direction. By assigning the peak value to the skeleton, this procedure effec-tively maps the center of individual WM tracts on the skeleton.
The whole-brain (WB) average FA value for each subject was calculated as the average FA value for the entire WM skeleton of ⬇300⫻103voxels. Next, the tract-wise average FA measurements
were calculated for 10 major WM tracts (Table 1) as described in our previous publications.3,20In short, the population-based, 3D, DTI cerebral WM tract atlas developed at Johns Hopkins University and distributed with the FSL package21was used to calculate population average diffusion parameter values along the spatial course of the 10 largest (volumeⱖ5 cm3) WM tracts (Table 1). The Johns Hopkins
University atlas was nonlinearly aligned to the minimal-deformation target brain, and image-containing labels for individual tracts were transferred to minimal-deformation target space using nearest-neighbor interpolation. Per-tract average values were calculated by averaging the values along the tracts in both hemispheres.
Genetic Analyses
Two sets of analyses were performed to study the magnitude and regional variations in shared genetic variance between the BP and FA using bivariate genetic correlation analyses methods imple-mented in the SOLAR software package. First, we analyzed the magnitude of shared genetic effect between BP and WB average FA (WB-FA) values. This was followed by calculation of regional bivariate genetic correlations between BP and tract-wise regional FA values. Beverage genetic analysis calculates the magnitude and significance of genetic correlation coefficient (G), which is the
proportion of variability attributable to shared genetic effects. The overall phenotypic correlation (P) between 2 traits A and B
(Equation) can be expressed using the correlation attributable to shared additive genetic effects (G) and the residual correlation (E)
attributable to shared environmental effects: P⫽
冑
hA 2冑
hB 2⫻ G⫹冑
1⫺hA 2冑
1⫺hB 2⫻ E,Table 1. WM Tracts Used in the Analysis
Tract Fiber Type Connections
Genu of corpus callosum C Cerebral hemispheres
Body of corpus callosum C Cerebral hemispheres
Splenium of corpus callosum
C Cerebral hemispheres
Cingulum A Cingulate gyrus/hippocampus
Corona radiata P Cortical/subcortical
External capsule A Frontal/temporal/occipital
Internal capsule (including thalamic radiation)
P Subcortical/brainstem/cortex
Superior/inferior fronto-occipital fasciculi
A Frontal/parietal/occipital
Superior longitudinal fasciculus A Frontal/temporal/occipital
Sagittal stratum A/P Subcortical/temporal/occipital
where h2Aand h2Bdenote the additive genetic heritabilities for each
of the traits (ie, the proportion of the total phenotypic variance that is explained by additive genetic factors). If the genetic correlation coefficient (G) is significantly different from zero, then the
signif-icant portion of the variance in 2 traits are considered to be influenced by shared genetic factors.24 All genetic analyses were conducted with age, sex, age⫻sex, age2 age2⫻sex included as
covariates. The health screening data (supplemental Table I) were not used as covariates because of the loss of statistical power to detect genetic effects attributable to their potentially overlapping genetic bases.24
Estimating Confounding Effects of the Antihypertensive Treatment
Genetic analyses can potentially be confounded by the antihyperten-sive treatment. We estimated the confounding effects of the antihy-pertensive drugs using 2 approaches, as suggested by Cui et al.25 First, we used an exclusion approach in which the genetic correlation analyses were performed in a cohort that excluded 44 subjects who were taking antihypertensive medication at the time of BP collection (supplemental Table I). Next, we used a phenotype adjustment approach in which fixed values of 10 and 5 mm Hg were added to the SBP and DBP values, respectively, for the 44 subjects who were taking antihypertensive medication.25The estimate of the magnitude of the confounding effect was made based on the significance of the difference in the genetic correlation coefficient among the measure-ments made in the original versus adjusted cohorts.
Results
WB-FA values showed a significant negative linear trend with both PP and SBP (r2⫽0.20 and 0.11, respectively;
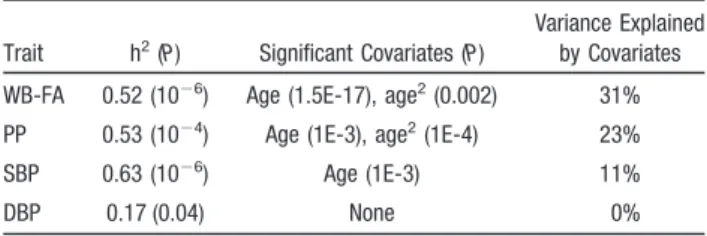
P⬍10⫺4), with no significant relationship observed between WB-FA and SBP (supplemental Figure I). Quantitative ge-netic analyses estimated that ⬎50% of the intersubject variance for the WB-FA, PP, and SBP and 17% of the variance for the DBP were attributed to additive genetic factors (Table 2). Age and age2 were significant covariates
for PP and WB-FA. Age was a sole significant covariate for SBP. DBP did not have significant covariates. There were no significant (P⬍0.05) age by sex or age2 by sex interactions
detected.
Genetic correlation analyses between BP and the WB-FA values reported that PP and SBP shared 36% (obtained from
squaringG) and 22% of genetic variance with the WB-FA
values, respectively (Table 3). The negative sign of these correlation coefficients suggested that the same genetic fac-tors associated with higher PP and SBP were linked to progressively lower FA values. Genetic correlation between WB-FA and DBP was not significant (Table 3). The estimates of the confounding effects of the antihypertensive were obtained by excluding 44 subjects who were taking antihy-pertensive medications and by adding 10 and 5 mm Hg to the SBP and DBP values for the treated subjects. There was no significant difference in either sign or magnitude of genetic correlations (Table 3). Therefore, all further regional analyses were performed in the full pedigree, using the uncorrected BP measurements.
Genetic correlation analyses between BP and the tract-wise FA values (Table 4) indicated that 6 of 10 WM tracts (genu of corpus callosum, body of corpus callosum, splenium of corpus callosum, fronto-occipital, superior longitudinal fas-ciculus, and sagittal stratum) showed a statistically significant (Pⱕ0.05) genetic correlation with PP. Genetic correlation failed to reach statistical significance (0.05ⱕPⱕ0.10) for 3 more tracts: cingulum, corona radiata, and external capsule (Table 4). Genetic correlation coefficients for FA of 4 tracts (genu of corpus callosum, body of corpus callosum, fronto-occipital, and sagittal stratum) showed a statistically signifi-cant (Pⱕ0.05) genetic correlation with SBP and approached significance (Pⱕ0.10) for splenium of corpus callosum (Ta-ble 4). There were no significant or suggestive genetic correlation coefficients observed for the genetic correlation coefficients with DBP (Table 4).
The plot of the genetic correlation coefficients (G) for 10
WM tracts versus tract-wise rates of cerebral maturation20
(Figure) demonstrate that WM bundles with higher rates of maturation shared a progressively higher genetic overlap with both PP and SBP. Linear regression analysis reported that this relationship was statistically significant for both PP and SBP (Pearson r2⫽0.55 and 0.57; Pⱕ0.01, respectively; Figure) but not for DBP (Pearson r2⫽0.23; P⫽0.16).
Discussion
This study in a large, well-characterized sample of Mexican American participants in the SAFHS9demonstrated that the
arterial PP and SBP shared 36% and 22% of genetic variance with the WB FA of WM, respectively. In the past, the integrity of cerebral WM was commonly assessed using the T2-hyperintense WM (HWM) lesion imaging techniques.5– 8
HWM lesions are the regions of accumulation of extracellular water attributable to focal degradation of the myelin sheath,14
Table 2. Heritability of WB-FA and BP Indices
Trait h2(P) Significant Covariates (P)
Variance Explained by Covariates
WB-FA 0.52 (10⫺6) Age (1.5E-17), age2(0.002) 31%
PP 0.53 (10⫺4) Age (1E-3), age2(1E-4) 23%
SBP 0.63 (10⫺6) Age (1E-3) 11%
DBP 0.17 (0.04) None 0%
Table 3. Genetic Correlation CoefficientsG(95% CI; P) Between WB-FA Values and 3 Measurements of Arterial BP: PP, SBP, and DBP
WB-FA PP (CI; P) SBP (CI; P) DBP (CI; P)
G(P) ⫺0.60 (⫺0.96, ⫺0.24; P⫽10⫺3) ⫺0.47 (⫺0.81, ⫺0.13; P⫽0.01) 0.10 (⫺0.52, 0.72; P⫽0.8) G(P)* ⫺0.62 (⫺1.0, ⫺0.24; P⫽10⫺3) ⫺0.45 (⫺0.81, ⫺0.09; P⫽0.02) 0.12 (⫺0.05, 0.74; P⫽0.7) G(P)† ⫺0.64 (⫺1.0, ⫺0.22; P⫽10⫺3) ⫺0.43 (⫺0.79, ⫺0.07; P⫽0.03) 0.08 (⫺0.50, 0.64; P⫽0.7)
*Calculated after the exclusion of 44 subjects taking antihypertensive medications.
†Calculated after the addition of 10 and 5 mm Hg to the SBP and DBP measurements for subjects taking antihypertensive medications.
and their volume is an important neuroimaging marker of cerebral integrity.26 DTI has an advantage over
HWM-imaging techniques because it is capable of ascertaining subtle WM damage that precedes formation of HWM le-sions.10 Several recent studies confirmed that DTI is a
sensitive neuroimaging marker of WM integrity in hyperten-sive individuals.10,27,28Specifically, FA values were inversely
correlated with the arterial PP and SBP in both normotensive and hypertensive individuals.27
The PP shared more genetic variance with the WB-FA values than SBP. This is consistent with the PWE theory,12,13
which suggests that elevation in the arterial pulsativity can lead to cerebral injury even in normotensive individuals.27
Similar pattern was observed in a previous whole-genome linkage study in this population, in which PP and the volume of HWM lesion shared significant genetic loci, whereas the association between SBP and HWM lesion volume only reached suggestive significance.5 The regional patterns of
Table 4. Heritability
WM Tract h2(P)
Rate of Maturation
(FA/Year)20
G(CI; P) PP G(CI; P) SBP G(CI; P) DBP
Genu of corpus callosum 0.66 (10⫺9) 21.3⫻10⫺4 ⫺0.59 (⫺0.90, ⫺0.30; 10⫺4) ⫺0.55 (⫺0.85, ⫺0.25; 10⫺3) ⫺0.17 (⫺1.0, 0.83; 50) Body of corpus callosum 0.54 (10⫺7) 14.7⫻10⫺4 ⫺0.44 (⫺0.80, ⫺0.08; 0.01) ⫺0.61 (⫺0.97, ⫺0.08; 10⫺4) ⫺0.32 (⫺0.92, 0.28; 30) Splenium of corpus callosum 0.57 (10⫺7) 8.4⫻10⫺4 ⫺0.43 (⫺0.85, ⫺0.01; 0.04) ⫺0.33 (⫺0.71, 0.05; 0.10) ⫺0.05 (⫺1.0, 1.0; 0.87) Cingulum 0.34 (10⫺3) 13.6⫻10⫺4 ⫺0.39 (⫺0.85, 0.07; 0.10) ⫺0.18 (⫺0.64, 0.28; 0.40) 0.37 (⫺0.23, 0.97; 0.30) Corona radiata 0.56 (10⫺7) 2.5⫻10⫺4 ⫺0.33 (⫺0.71, 0.05; 0.08) ⫺0.19 (⫺0.55, 0.17; 0.30) 0.23 (⫺0.70, 1.0; 0.46) External capsule 0.43 (10⫺5) 0.3⫻10⫺4 ⫺0.25 (⫺0.65, 0.15; 0.21) ⫺0.19 (⫺0.57, 0.19; 0.30) 0.21 (⫺0.87, 1.0; 0.54)
Internal capsule (including thalamic radiation) 0.43 (10⫺6) 4.7⫻10⫺4 ⫺0.41 (⫺0.93, 0.11; 0.09) ⫺0.19 (⫺0.63, 0.25; 0.40) 0.42 (⫺0.14, 0.98; 0.28) Frontal-occipital 0.41 (10⫺6) 10.9⫻10⫺4 ⫺0.45 (⫺0.85, ⫺0.05; 0.03) ⫺0.43 (⫺0.85, ⫺0.01; 0.05) ⫺0.16 (⫺1.0, 1.0; 0.65) Superior longitudinal fasciculus 0.58 (10⫺7) 6.8⫻10⫺4 ⫺0.38 (⫺0.76, 0.00; 0.04) ⫺0.29 (⫺0.67, 0.10; 0.20) ⫺0.11 (⫺1.0, 1.0; 0.72) Sagittal stratum 0.40 (10⫺4) 12.4⫻10⫺4 ⫺0.67 (⫺1.0, ⫺0.29; 10⫺4) ⫺0.51 (⫺0.91, ⫺0.30; 0.01) 0.21 (⫺0.90, 1.0; 0.54)
The rates of maturation and senescence20and the genetic correlation coefficients
G(95% CI; P) were calculated for 10 major WM tracts.
The rate of maturation (FA unit/year)
Genetic Correlation Coefficient (
ρ G ) SBP 0.0 -0.1 -0.2 -0.3 -0.4 -0.5 -0.6 -0.7 -0.8
Genetic Correlation Coefficient (
ρ G ) PP 0 0.0005 0.0010 0.0015 0.0020 0.0025 0 0.0005 0.0010 0.0015 0.0020 0.0025 0.0 -0.1 -0.2 -0.3 -0.4 -0.5 -0.6 -0.7 -0.8
Figure. The tract-wise genetic correlation coefficients (G) for PP (top graph) and SBP (bottom graph) are plotted versus tract-wise rates of cerebral maturation (Table 4) in FA units per year taken from.20Linear regression analyses (solid lines) indicated that the by-tract variability in the magnitude of genetic overlap was significantly correlated with the by-tract rates of FA increase during matura-tion for both PP and SBP (Pearson r⫽0.74 and 0.76; Pⱕ0.01).
genetic overlap between BP and FA were in agreement with the direct and indirect mechanisms of BP-related cerebral injury as described by the PWE theory. The direct mechanism is primarily responsible for the gliosis of the periventricular WM.12,13 This explains the high negative (
G⫽⫺0.43 to
⫺0.67) genetic correlation between PP and periventricular WM tracts. The highest genetic correlation was observed for the sagittal stratum, which is located in the area that is especially susceptible to the periventricular gliosis.27 The
indirect mechanism of the PWE theory is suggested to be responsible for formation of subcortical WM lesions, most commonly observed in the frontal lobe.11,27This may explain
high genetic correlations observed between the SBP and the FA of the genu and the body of CC because these tracts contain commissural fibers connecting frontal lobes. The biological pathway of the indirect mechanisms remains un-clear. Stenosis of small cerebral vessels, especially in the watershed areas,29and high metabolic demands of
oligoden-drocytes of associative WM contribute to a high vulnerability of the frontal WM to the indirect PWE mechanism.30
Oligo-dendrocytes of the associative frontal WM are among the most metabolically active cells in the adult central nervous system and are therefore highly susceptible to damages from hypoxia.30In addition, the oligodendrocytes of the associated,
frontal WM tracts have reduced rates (per axonal-segment) of myelin production and repair,31 and this is thought to be
responsible for the protracted age-related myelination and sharp age-related decline.20
Previous findings suggested that the protracted develop-ment and high metabolic demands of associative WM make it more vulnerable to age-related neurodegeneration than sen-sory and motor WM.19,27,32In agreement with these findings,
our results showed that WM tracts that continue to myelinate into adulthood, and therefore show higher age-related matu-ration rates, shared progressively more genetic overlap with PP and SBP. In fact,⬎50% of regional variability in shared genetic variance was explained by the regional rates of cerebral maturation. We interpret this finding as the evidence for genotype-by-age interaction, with protracted development of associative WM contributing to its higher susceptibility to the neurodegeneration associated with elevated PP and SBP. Unlike PP and SBP, significant genetic correlations were not observed between DBP and FA. However, given the lower observed heritability of DBP, the current study is relatively underpowered and can therefore fail to identify genetic correlations for this pair of phenotypes. The statistical power of the current study may also have been limited to detect significant genetic correlation for track-wise measure-ments of FA, in which the magnitude of genetic correlation coefficients for several analyses approached statistical signif-icance. Therefore, the lack of significant genetic correlations cannot be interpreted as evidence against the existence of those pleiotropic relationships. In addition, our study exam-ined Mexican Americans, a population with significant Na-tive American admixture. If relaNa-tively rare variants are involved in the determination of quantitative variance, we may expect considerable differences in the degree of shared genetic variance in other populations, such as European Americans.33
Perspective
Our findings in a population characterized by an adverse cardiovascular risk profile demonstrated that genetic factors responsible for elevation in arterial PP and SBP were also responsible for declining integrity of cerebral WM. In agree-ment with PWE theory, the highest genetic association with WM integrity was observed for PP. Further, our data dem-onstrated that associative WM tracts that facilitate high-order cognitive functioning showed higher vulnerability to the elevated PP and SBP than motor and sensory WM tracts. The statistical power of this study was not sufficient to localize the individual genes responsible for the pleiotropy between BP and FA, but previous studies in this population provide a likely candidate: selectin genes.2,5,6The region harboring the
constellation of selectin genes (SELP, SELL, and SELE) has been identified as a region of significant linkage (LOD⫽3.82) between PP and HWM volume. In particular, the adhesion molecule P-selectin34 is a marker of potential endothelial
dysfunction that has been implicated as a risk factor in essential hypertension35,36 and stroke.35,37 Increased blood
levels of P-selectin have been implicated in formation of atherosclerotic plaque, loss of vascular reactivity, and in-crease in arterial pulsativity and SBP.35,37In addition,
plate-let-derived gene expression levels of SELP were shown to be strongly and positively correlated with arterial BP.38,39 Limitations
Our data indicate that a genotype-by-age interaction is poten-tially responsible for genetic overlap between BP and FA. Hence, it may be useful to explicitly allow for the potential influences of genotype by age interactions. Although ad-vanced statistical genetic methods for family-based data allow for the formal detection of such interactions within cross-sectional data, longitudinal family studies will have much greater power to localize and ultimately identify the specific genes involved in intersubject differences in the rates of WM atrophy. Therefore, further research is needed to confirm the cross-sectional trends observed here using a longitudinal design.
A potential limitation of this study is that the collection of BP measurements preceded the acquisition of brain images by 3.0⫾0.8 (maximum 5.3) years. Individual subjects could have experienced a rise in BP during the period between BP and brain assessment, suggesting caution when interpreting these findings.
Sources of Funding
This research was supported by National Institute of Biomedical Imaging and Bioengineering grant K01 EB006395 to P.K., National Heart Lung and Blood Institute grant P01HL045522 to J.B., and National Institute of Mental Health grants R37MH059490 and R01MH078111 to J.B. and grants R01MH0708143 and R01MH083824 to D.G.
Disclosures
None.
References
1. He W, Sengupta M, Velkoff V, DeBarros K. Current population reports. Special studies. 65⫹ in the United States: 2005. US Census Report. 2006;http://www.census.gov/prod/2006pubs/p23-209.pdf.
2. Rutherford S, Cai G, Lopez-Alvarenga JC, Kent JW, Voruganti VS, Proffitt JM, Curran JE, Johnson MP, Dyer TD, Jowett JB, Bastarrachea RA, Atwood LD, Goring HH, Maccluer JW, Moses EK, Blangero J, Comuzzie AG, Cole SA. A chromosome 11q quantitative-trait locus influences change of blood-pressure measurements over time in Mexican Americans of the San Antonio Family Heart Study. Am J Hum Genet. 2007;81:744 –755.
3. Kochunov P, Glahn DC, Lancaster JL, Winkler AM, Smith S, Thompson PM, Almasy L, Duggirala R, Fox PT, Blangero J. Genetics of microstructure of cerebral white matter using diffusion tensor imaging. Neuroimage. 2010; 53:1109 –1116.
4. Brouwer RM, Mandl RC, Peper JS, van Baal GC, Kahn RS, Boomsma DI, Hulshoff Pol HE. Heritability of DTI and MTR in nine-year-old children. Neuroimage. 2010;53:1085–1092.
5. Kochunov P, Glahn D, Lancaster J, Winkler A, Kent J, Olvera R, Cole S, Dyer T, Almasy L, Duggirala R, Fox P, Blangero J. Whole brain and regional hyperintense white matter volume and blood pressure: overlap of genetic loci produced by bivariate, whole-genome linkage analyses.
Stroke. 2010;41:2137–2142.
6. Kochunov P, Glahn D, Winkler A, Duggirala R, Olvera R, Cole SA, Dyer TD, Almasy L, Fox P, Blangero J. Analysis of genetic variability and whole genome linkage of whole-brain, subcortical and ependymal hyper-intense white matter volume. Stroke. 2009;40:3685–3690.
7. DeStefano AL, Atwood LD, Massaro JM, Heard-Costa N, Beiser A, Au R, Wolf PA, DeCarli C. Genome-wide scan for white matter hyperin-tensity: the Framingham Heart Study. Stroke. 2006;37:77– 81. 8. Turner ST, Fornage M, Jack CR Jr, Mosley TH, Kardia SL, Boerwinkle
E, de Andrade M. Genomic susceptibility loci for brain atrophy in hypertensive sibships from the GENOA study. Hypertension. 2005;45: 793–798.
9. Mitchell BD, Kammerer CM, Blangero J, Mahaney MC, Rainwater DL, Dyke B, Hixson JE, Henkel RD, Sharp RM, Comuzzie AG, VandeBerg JL, Stern MP, MacCluer JW. Genetic and environmental contributions to cardiovascular risk factors in Mexican Americans. The San Antonio Family Heart Study. Circulation. 1996;94:2159 –2170.
10. Maclullich AM, Ferguson KJ, Reid LM, Deary IJ, Starr JM, Seckl JR, Bastin ME, Wardlaw JM. Higher systolic blood pressure is associated with increased water diffusivity in normal-appearing white matter. Stroke. 2009;40:3869 –3871.
11. Bateman GA. Pulse wave encephalopathy: a spectrum hypothesis incor-porating Alzheimer’s disease, vascular dementia and normal pressure hydrocephalus. Med Hypotheses. 2004;62:182–187.
12. Henry Feugeas MC, De Marco G, Peretti II, Godon-Hardy S, Fredy D, Claeys ES. Age-related cerebral white matter changes and pulse-wave encephalopathy: observations with three-dimensional MRI. Magn Reson
Imaging. 2005;23:929 –937.
13. Bateman GA. Pulse-wave encephalopathy: a comparative study of the hydrodynamics of leukoaraiosis and normal-pressure hydrocephalus.
Neuroradiology. 2002;44:740 –748.
14. Fazekas F, Kleinert R, Offenbacher H, Schmidt R, Kleinert G, Payer F, Radner H, Lechner H. Pathologic correlates of incidental MRI white matter signal hyperintensities. Neurology. 1993;43:1683–1689. 15. Flechsig P. Developmental (myelogenetic) localisation of the cerebral
cortex in the human. Lancet. 1901;158:1027–1030.
16. Brun C, Lepore N, Pennec X, Chou YY, Lee AD, Barysheva M, de Zubicaray G, Meredith M, McMahon K, Wright MJ, Toga AW, Thompson PM. A tensor-based morphometry study of genetic influences on brain structure using a new fluid registration method. Med Image
Comput Comput Assist Interv. 2008;11:914 –921.
17. Kochunov P, Castro C, Davis D, Dudley D, Brewer J, Zhang Y, Kroenke CD, Purdy D, Fox PT, Simerly C, Schatten G. Mapping primary gyro-genesis during fetal development in primate brains: high-resolution in utero structural MRI of fetal brain development in pregnant baboons.
Front Neurosci. 2010;4:20.
18. Jones DK, Horsfield MA, Simmons A. Optimal strategies for measuring diffusion in anisotropic systems by magnetic resonance imaging. Magn
Reson Med. 1999;42:515–525.
19. Kochunov P, Thompson PM, Lancaster JL, Bartzokis G, Smith S, Coyle T, Royall DR, Laird A, Fox PT. Relationship between white matter fractional anisotropy and other indices of cerebral health in normal aging:
tract-based spatial statistics study of aging. Neuroimage. 2007;35: 478 – 487.
20. Kochunov P, Williamson D, Lancaster J, Fox P, Cornell J, Blangero J, Glahn D. Fractional anisotropy of water diffusion in cerebral white matter across the lifespan. Neurobiol Aging. 2010 Jan 30;[Epub ahead of print]. 21. Smith SM, Jenkinson M, Johansen-Berg H, Rueckert D, Nichols TE, Mackay CE, Watkins KE, Ciccarelli O, Cader MZ, Matthews PM, Behrens TE. Tract-based spatial statistics: voxelwise analysis of multi-subject diffusion data. Neuroimage. 2006;31:1487–1505.
22. Smith SM. Fast robust automated brain extraction. Hum Brain Mapp. 2002;17:143–155.
23. Kochunov P, Lancaster JL, Thompson P, Woods R, Mazziotta J, Hardies J, Fox P. Regional spatial normalization: toward an optimal target.
J Comput Assist Tomogr. 2001;25:805– 816.
24. Almasy L, Dyer TD, Blangero J. Bivariate quantitative trait linkage analysis: pleiotropy versus co-incident linkages. Genet Epidemiol. 1997; 14:953–958.
25. Cui JS, Hopper JL, Harrap SB. Antihypertensive treatments obscure familial contributions to blood pressure variation. Hypertension. 2003; 41:207–210.
26. Kochunov P, Thompson PM, Coyle TR, Lancaster JL, Kochunov V, Royall D, Mangin JF, Riviere D, Fox PT. Relationship among neuro-imaging indices of cerebral health during normal aging. Hum Brain
Mapp. 2008;29:36 – 45.
27. Kennedy KM, Raz N. Pattern of normal age-related regional differences in white matter microstructure is modified by vascular risk. Brain Res. 2009;1297:41–56.
28. Nitkunan A, Charlton RA, McIntyre DJ, Barrick TR, Howe FA, Markus HS. Diffusion tensor imaging and MR spectroscopy in hypertension and presumed cerebral small vessel disease. Magn Reson Med. 2008;59: 528 –534.
29. Minkner K, Lovblad KO, Yilmaz H, Alimenti A, Sekoranja L, Delavelle J, Sztajzel R, Rufenacht DA. White matter lesions in watershed territories studied with MRI and parenchymography: a comparative study. Neuroradiology. 2005;47:425– 430.
30. Bartzokis G, Sultzer D, Lu PH, Nuechterlein KH, Mintz J, Cummings JL. Heterogeneous age-related breakdown of white matter structural integrity: implications for cortical “disconnection” in aging and Alzhei-mer’s disease. Neurobiol Aging. 2004;25:843– 851.
31. Hof PR, Cox K, Morrison JH. Quantitative analysis of a vulnerable subset of pyramidal neurons in Alzheimer’s disease: I. Superior frontal and inferior temporal cortex. J Comp Neurol. 1990;301:44 –54.
32. Kochunov P, Coyle T, Lancaster J, Robin DA, Hardies J, Kochunov V, Bartzokis G, Stanley J, Royall D, Schlosser AE, Null M, Fox PT. Processing speed is correlated with cerebral health markers in the frontal lobes as quantified by neuroimaging. Neuroimage. 2009;49:1190 –1199. 33. Blangero J, Williams JT, Almasy L. Novel family-based approaches to
genetic risk in thrombosis. J Thromb Haemost. 2003;1:1391–1397. 34. Herrmann SM, Ricard S, Nicaud V, Mallet C, Evans A, Ruidavets JB,
Arveiler D, Luc G, Cambien F. The P-selectin gene is highly poly-morphic: reduced frequency of the Pro715 allele carriers in patients with myocardial infarction. Hum Mol Genet. 1998;7:1277–1284.
35. Zee RY, Cook NR, Cheng S, Reynolds R, Erlich HA, Lindpaintner K, Ridker PM. Polymorphism in the P-selectin and interleukin-4 genes as determinants of stroke: a population-based, prospective genetic analysis.
Hum Mol Genet. 2004;13:389 –396.
36. Blann AD, Nadar SK, Lip GY. The adhesion molecule P-selectin and cardiovascular disease. Eur Heart J. 2003;24:2166 –2179.
37. Preston RA, Coffey JO, Materson BJ, Ledford M, Alonso AB. Elevated platelet P-selectin expression and platelet activation in high risk patients with uncontrolled severe hypertension. Atherosclerosis. 2007;192: 148 –154.
38. Duggirala R, Blangero J, Almasy L, Dyer TD, Williams KL, Leach RJ, O’Connell P, Stern MP. A major susceptibility locus influencing plasma triglyceride concentrations is located on chromosome 15q in Mexican Americans. Am J Hum Genet. 2000;66:1237–1245.
39. Goring HH, Curran JE, Johnson MP, Dyer TD, Charlesworth J, Cole SA, Jowett JB, Abraham LJ, Rainwater DL, Comuzzie AG, Mahaney MC, Almasy L, MacCluer JW, Kissebah AH, Collier GR, Moses EK, Blangero J. Discovery of expression QTLs using large-scale transcriptional pro-filing in human lymphocytes. Nat Genet. 2007;39:1208 –1216.
Duggirala, Peter T. Fox and John Blangero
L. Olvera, Joanna E. Curran, Melanie A. Carless, Thomas D. Dyer, Laura Almasy, Ravi
Peter Kochunov, David C. Glahn, Jack Lancaster, Anderson Winkler, Kathrin Karlsgodt, Rene
Print ISSN: 0194-911X. Online ISSN: 1524-4563
Copyright © 2010 American Heart Association, Inc. All rights reserved.
is published by the American Heart Association, 7272 Greenville Avenue, Dallas, TX 75231
Hypertension
doi: 10.1161/HYPERTENSIONAHA.110.162206
2011;57:330-335; originally published online December 6, 2010;
Hypertension.
http://hyper.ahajournals.org/content/57/2/330
World Wide Web at:
The online version of this article, along with updated information and services, is located on the
http://hyper.ahajournals.org/content/suppl/2010/12/03/HYPERTENSIONAHA.110.162206.DC1.html
Data Supplement (unedited) at:
http://hyper.ahajournals.org//subscriptions/
is online at:
Hypertension
Information about subscribing to Subscriptions:
http://www.lww.com/reprints
Information about reprints can be found online at: Reprints:
document.
Permissions and Rights Question and Answer
this process is available in the
click Request Permissions in the middle column of the Web page under Services. Further information about Office. Once the online version of the published article for which permission is being requested is located,
can be obtained via RightsLink, a service of the Copyright Clearance Center, not the Editorial
Hypertension
in
Requests for permissions to reproduce figures, tables, or portions of articles originally published Permissions:
Kochunov Peter Ph.D
1,4*, Glahn David C Ph.D.
1,2, Lancaster Jack Ph.D
1, Winkler Anderson MD
1,2, Karlsgodt Kathrin Ph.D
3, Olvera
Rene L MD
1, Curran Joanna E Ph.D
4, Carless Melanie A Ph.D
4, Dyer Thomas D Ph.D
4, Almasy Laura Ph.D
4, Duggirala Ravi. Ph.D
4,
Fox Peter T M.D
1, Blangero John Ph.D
4.
1. Research Imaging Institute, University of Texas Health Science Center at San Antonio
2. Department of Psychiatry, Yale University & Olin Neuropsychiatric Research Center Institute of Living.
3.
Department of Psychiatry, Cognitive Neuroscience Center, University of California Los Angeles, Los Angeles, CA, USA
4. Department of Genetics, Southwest Foundation for Biomedical Research, San Antonio, TX
*For correspondence and reprint information contact:
Peter Kochunov Ph.D, Dip ABMP.
University of Texas Health Science Center at San Antonio
Research Imaging Institute
7703 Floyd Curl Drive
San Antonio, Texas 78284
kochunov@uthscsa.edu
210-567-8100
phone
subjects (M/F)
obese
cholesterolemia lipidemia disorder hypertensive
meds 19-29 27 (11/16) 118.7±12.5 68.4±7.7 50.3±10.9 10 3 1 0 1 3 1 3 4 30-39 76 (35/41) 117.9±13.0 72.2±9.2 45.6±9.9 32 8 3 0 3 18 3 8 18 40-49 84 (30/54) 118.9±13.3 72.5±9.7 46.4±9.6 35 20 3 1 13 18 6 6 25 50-59 80 (28/52) 125.4±17.5 72.9±10.5 52.5±13.0 29 27 5 3 15 31 12 4 34 60-69 40 (14/26) 135.0±17.9 73.1±13.5 61.8±16.7 17 24 7 4 18 30 12 4 13 70-79 25 (12/13) 131.1±16.4 71.0±13.3 60.2±16.4 10 14 3 4 13 17 10 1 5