Automated Phase Map Referencing Against
Historic Phase Map Data
Roger M. Groves1,2, Dominique Derauw3, Cédric Thizy3, Igor Alexeenko2, Wolfgang Osten2, Marc Georges3, Vivi Tornari4
1
Faculty of Aerospace Engineering, Delft University of Technology,
Kluyverweg 1, 2600 GB, Delft, The Netherlands;
2
ITO Institut für Technische Optik, Universität Stuttgart,
Pfaffenwaldring 9, 70569 Stuttgart, Germany;
3
Centre Spatial de Liège – Université de Liège,
Liège Science Park, B-4031 Angleur, Belgium;
4
Foundation for Research and Technology-Hellas, Institute of Electronic
Structure and Laser, Vassilika Vouton, Voutes, 71110 Heraklion-Crete, Greece
1 Introduction
Holography [1] and shearography [2] techniques are in common use for precise measurements in high technology industries, such as aerospace, automotive, precision manufacturing and for the structural diagnostics of artwork [3]. The phase map data generated by these instruments allows precise measurements of parameters such as displacement, strain and shape. The comparison of data from different measurement campaigns is useful for null testing components [4] and for studying changes. However, the comparison of data with previous measurements is non-trivial due to the sensitivity of these techniques to alignment and to sample loading parameters. This paper addresses image and phase registration issues for holography and shearography. This manuscript describes 2D spatial co-registration to compensate for differences between the field of view between the measurements and a phase referencing to calculate the difference between the phase maps for comparison of data with previous measurements. These techniques are implemented after following a standardised measurement procedure.
2 Springers Word Document Template
2 Standardised Measurement Procedure
The standardised measurement procedure developed for the instrument described in [5] is detailed below. The sensor distance and camera lens parameters control the field of view of the sensor. As optimum parameters, the field of view of the reference and re-measured images should overlap as much as possible, approximately the same number of pixels should be used and out-of-plane image tilt and image rotation differences should be minimised. Acquisition parameter variations, even under optimum conditions, are sufficient to induce phase measurements that are not perfectly superimposable, leading to an incorrect phase comparison. For this reason the sub-pixel accuracy co-registration, detailed in Section 3 is necessary. Samples are thermally loaded using infra-red lamps. To reduce phase differences due to differences in loading parameters, infra-red lamp power, distance to sample, illumination angles and illumination direction are specified by the measurement procedure.
3 Spatial Co-Registration
Co-registration is the computation of the transform that should be applied to a slave image to make it superimposable onto a master image. In this work, computation is limited to an affine transform which takes account translation, rotation, magnifications and out-of-plane tilt variations. Once found, the transform must be applied through proper interpolation process. Mathematically, the affine transform is expressed as:
x2=Ax+Bxx1+Cxy1 (1)
y2=Ay+Byx1+Cyy1 (2) where (x1,y1) and (x2,y2) are the coordinates in the first and second images,
respectively. The parameters of the affine transform are determined from white light reference and re-measured images. The co-registration and interpolation procedure were adapted from processes developed for SAR interferometry [6]. Co-registration in itself is conducted through correlation of imagettes taken from the master and the slave images. The process leads to a list of anchor points in the master image for which corresponding anchor points can be found in the slave image. The affine transform parameters are then found by a mean square calculation, fitting the transform through the list of anchor point pairs. The transform obtained must then be applied to the image in order to make it superimposable to the reference one and to allow for correct phase difference computation.
Guidelines for the Preparation of Manuscript 3
(a) (b) (c) (d) (e)
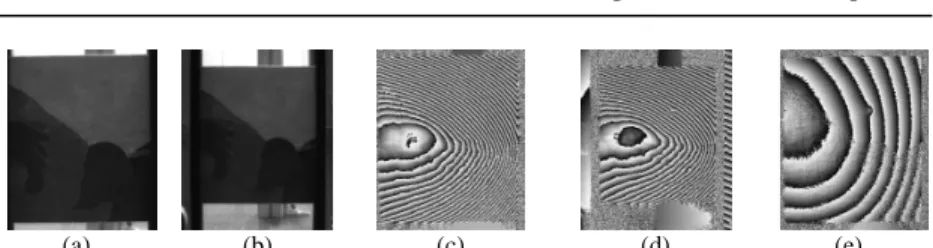
Fig. 1. (a) and (b) are images of a wooden panel painting, recorded using different
camera positions. (c) and (d) are phase maps recorded using these camera positions. (e) is the difference phase map after co-registration and subtraction of the phase maps
To apply the transform, a complex interpolator, based on the Chirp-Z transform, was used. As the viewing geometries are identical, the same transform can be applied to both the intensity image and to the re-measured phase maps. For this latter one, phase is first converted to complex interferograms to allow complex interpolation, then the phase is recalculated from the interpolated complex phase values. Results showing the co-registration of phase maps recorded from a wooden panel painting using dynamic holography [7] are shown in Fig. 1.
4 Phase Referencing
The first step of this procedure is to identify the reference phase map with the most similar time after heating. This time information is obtained from phase map file names. The phase maps selected are unwrapped and divided into sub-images. The size of the sub-image should be small enough to be considered as a planar surface in 3D space and be large enough to smooth variations due to speckle noise. A typical size is 7x7 pixels. The next step is to correct for phase offsets between the reference and re-measured phase maps. These phase offsets may be introduced by the phase-shifting algorithm, deviations in the sample loading and the co-registration procedure. The sub-images are rescaled by calculating the mean intensity and setting this value to 128 intensity. The final stage is to compare these sub-images using the matching-ratio (M-ratio) formula:
{
}
( ){
1( , )1 2( , )2}
I I M I x y I x y + = − ∑ ∑ ∑ (2)where M is the Matching ratio, I1 and I2 are images are the reference and
re-measured phase maps respectively. x and y refer to columns and rows in the phase maps. The meaning of the M-value was empirically determined. Values less than 1.2 indicating a highly-significant change and values greater than 1.7 indicating an insignificant change.
4 Springers Word Document Template 5 Discussion and Summary
The registration application shown here demonstrates how spatial co-registration can be successfully applied to holography when measurement parameters are carefully controlled. The phase referencing described could, in principle, provide fully automated phase analysis and provide the instrument user with clear information on pass or fail. Current work is to refine these empirical M-ratio values using a larger data set. In summary, the manuscript describes an automated procedure for comparing phase maps with historic data, using spatial co-registration algorithms and an empirical matching ratio.
This research was supported by the European Union funded MULTI-ENCODE (Multifunctional Encoding System for the Assessment of Movable Cultural Heritage) FP6 Project (006427 SSPI).
References
1. Vest, CM (1979) Holographic Interferometry. Wiley, New York 2. Steinchen, W, Yang, L (2001) Digital shearography. SPIE Press,
Bellingham
3. Fotakis, C, Anglos, D, Zafiropulos, V, Georgiou, S, Tornari, V (2006) Lasers in the Preservation of Cultural Heritage; Principles and applications. Brown, RGW, Pike, ER, Eds. Taylor and Francis, New York
4. Osten, W, Pedrini, G, Schwab, X, Baumbach, Th (2007) Null test in speckle light by comparative digital holography. Proc. of the 13th International Conference on Experimental Mechanics, Gdoutos, EE, Ed. Springer, pp. 603-604
5. Tornari, V, Bernikola, E, Hatziyannakis, K, Osten, W, Groves, RM, Georges, M, Thizy, C, Hustinx, G-M, Rochet, J, Kouloumpi, E, Doulgeridis, M, Green, T, Hackney, S (2009) Multifunctional encoding system for assessment of movable cultural heritage and resulted prototype device, Proc. FRINGE 2009.
6. Derauw, D, Roose, S (1995) Co-registration and complex
interpolation. Proc. SPIE 2584:326-331
7. Lemaire, Ph, Georges, M (2006) Dynamic holographic interferometry : devices and applications in Photorefractive Materials And Their Applications 3: Applications, Günter, P, Huignard, J-P, Eds., Springer Series in Optical Sciences 115