ABSTRACT
The Chelopech gold-copper mine is localized in the western part of Bulgaria and is one of the largest gold producer in Europe. The most of extracted copper in Chelopech Mining come from arseniate sulfosalts (enargite and tennantite) but also sulphides such as bornite, chalcopyrite and covellite. Gold, silver and critical elements (Ge, Te and Se) are associated with this mineralization but only gold and silver are recovered. An image processing method is applied on different flotation plant samples: ore after milling, tailings 1; tailings 2, total tailings and concentrate. Polished sections made with these samples are analyzed in order to quantify the mineral amounts in each sample. The purpose of this quantitative analysis is to know the nature and proportions of mineral phases at each stage of the process. This study allow to know in which forms copper, arsenic and trace elements are present in the different samples and to track them during the different stages, which is very relevant information in order to improve ore treatment and tailings management.
Introduction
Europe is more and more dependent of metal importation and especially about critical metals (such as Ge,Ga,REE,Se,Te…) needful for a good economic development. Few of these critical metals are present in Chelopech mining in association with copper-sulphides and would deserve a deepest investigation. An image processing method has been applied on the Chelopech plant processing products (ore, tailings and concentrate) to quantify the mineral proportions in each stage of the process. Several pictures of each polished sections have been taken in different wavelength (438,591 and 692nm) in order to distinguish the minerals. Then, these pictures are classified and corrected to know mineral nature and mineral weight proportion present at each stage of the ore processing. In our case, it allows to know in which forms the minerals are present in the plant processing products and to track them, which is relevant information in order to improve the ore processing and tailings management. The quantitative analysis achieved on the different products fits with optical and chemical analysis.
Mineralization
From a geological setting, Chelopech ore composition is made of Cu, Fe, S, As and Ba with occurrence of Sb, Bi, Se, Te, Au, Ag, Pb, Zn, Sn, In, Ga, Ge and Ti as minor elements (Bonev [1], Moritz [2], Chambefort [3], Coffey Mining [4]). Major mineralizations are composed of typical epithermal high sulfidation sulfides such as
pyrite, enargite, tennantite, chalcopyrite, covellite (sphalerite and galena) and bornite. Native gold and silver are closely associated with these sulfides.
71 mineral phases have been identified in Chelopech ore deposit (Bonev [1], Coffey Mining [4]) including critical elements (European Commission [5]): tellurides, renierite, germanite (Petrunov [6] ; Bonev [1] ; Coffey Mining [4]), colusite (Coffey Mining [4]), goldfieldite (Bonev [1]), hessite, kostovite and PGE (Coffey Mining [4]).
Metallic elements occurrence such as Au-Ag-Te-V-Sb-Ge-Hg is quite frequent in epithermal high sulfidation ore deposit (Corbett and Leach [7]). Shallow depths are frequently locally enriched in Te, V, Hg and Sb (Corbett and Leach [7]). Those critical elements can be the main element of a mineral phase (10% Ge in germanite) or on the contrary be “in trace” inside “common mineral” (few ppm Ge in enargite). In the copper/gold Chelopech ore deposit, Ge is present in enargite, bornite and chalcopyrite (Terziyev [8]), Se is present in galena, Te is present with gold (Bonev [1]) and it is now possible to trace them in the process using multispectral quantitative analysis.
Granulometric and mineralogical samples analyses
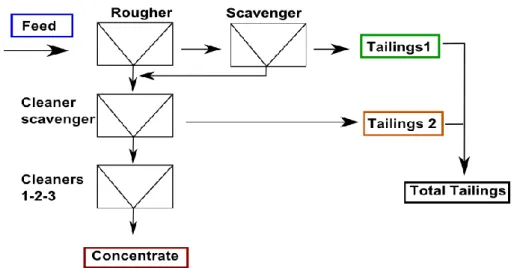
Chelopech flotation plant samples (milled ore, tailings 1, tailings 2, total tailings and concentrate) (“Figure 1”) have been sieved in three size fractions: <38µm, 38µm-75µm, and >75µm. Only +75µm and 38-75 µm have been qualitatively and quantitatively analyzed.
Figure 1 : sampling points in Chelopech flotation plant
EDX analysis
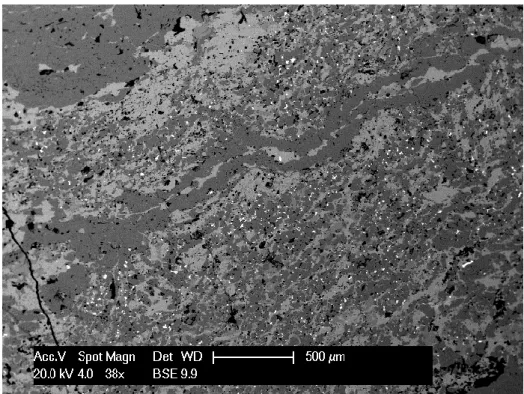
A few enargite-tennantite-chalcopyrite vein samples were analyzed with EDX: no Ge neither Te have been detected but Selenium has been found in galena as a substitution of S and can reach from 8 to 14%wt “Figure 2”.
Figure 2: veins seen with BSE microscope. Rich selenium galena (clausthalite) are bright white small spots
Quantitative analyses
Image acquisition
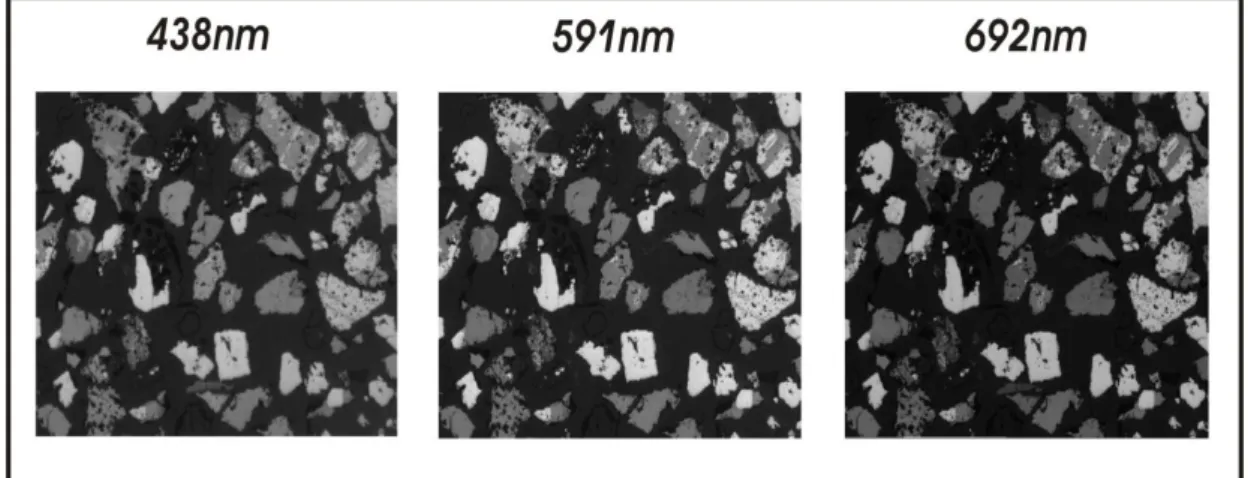
Quantitative analyses was performed on flotation plant samples polished sections 38-75µm and +38-75µm with a reflected light microscope equipped with a CCD camera and a filter wheel. Three spectral bands were used (438nm, 591nm and 692nm) in order to distinguish mineral among each other “Figure 3”. 55 images of each polished section were taken randomly at 3 wavelengths “Figure 4”.
Figure 3: main mineral phase’s reflectance curves
Figure 4: three images of the same area picture with different wavelengths
Classification
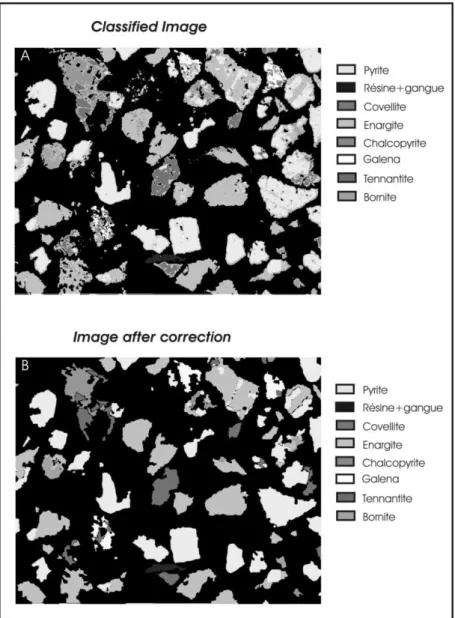
These spectral images are stacked and classified in 8 groups “Figure 5” corresponding to the main mineral phases: pyrite, bornite, covellite, resin + gangue, tennantite, enargite, chalcopyrite and galena. The classification is semi-supervised: a reference area is delimited by the user and identified by the software as a learning zone and then the software applies this classification to the other images.
0 10 20 30 40 50 60 400 450 500 550 600 650 700 750 % R efl ec tan ce Wavelength
Reflectance curves
Bornite Chalcopyrite Covellite Covellite Enargite Enargite Galène Pyrite TennantiteFigure 5: classification of stacked image
These classified images need to be corrected before being quantified to delete plucking and false transition pixels around minerals. After treatment, images are ready to be correctly quantified “Figure 6”.
Results
Pixels number has been counted in each corrected image, which allows to know opaque mineral surface proportions in each sample (tailings 1, tailings 2, total tailings, milled ore and concentrate). The values obtained are then corrected with their respective densities.
Results description
Samples mineral weight proportions have been represented and described in “Figures
7 and 8”.
Ore +75µm and 38-75µm. Pyrite is the main sulfide mineral (>88%wt) and enargite is
the main Cu and As-bearing mineral. Chalcopyrite, covellite, bornite and galena weight proportions are very low “Figure 7 and 8”.
Tailings1 +75µm and 38-75µm. Tailings 1 are composed of a majority of pyrite (>
93%wt) and enargite is the main Cu and As-bearing mineral in Tailings 1 +75µm while chalcopyrite is the main Cu-bearing mineral in the 38-75µm fraction. Other mineral proportions are very low “Figure 7 and 8”.
Tailings2 +75µm and 38-75µm. Pyrite is the main sulfides minerals (> 95%wt) and
chalcopyrite is the main Cu-bearing mineral. Except chalcopyrite, other mineral proportions don’t exceed 0.5%wt “Figure 7 and 8”.
Total tailings +75µm and 38-75µm. More than 95%wt of pyrite and 2%wt of enargite
which is the main Cu-As bearing mineral. Other minerals are present in very low weight proportion “Figure 7 and 8”.
Concentrate +75µm and 38-75µm. Pyrite and enargite are the main minerals
(>80%wt) followed by tennantite and galena (few %) Other minerals are present in low proportions “Figure 7 and 8”.
Concentrate +75µm and 38-75µm. Pyrite and enargite are the main minerals
(>80%wt) followed by tennantite and galena (few %) Other minerals are present in low proportions “Figure 7 and 8”.
Figure 7: ore+75µm weight mineral proportion in the process plant
“Figures 7 and 8” clearly shows that pyrite is the main sulfides in every products and
enargite is the main copper bearing mineral in the most of samples and especially in concentrates while chalcopyrite seems to be the main Cu-bearing mineral in tailings 1 and tailings 2. As-bearing mineral (enargite and tennantite) are mainly present in concentrates and very few in tailings.
Comparison between quantitative results and chemical analyses
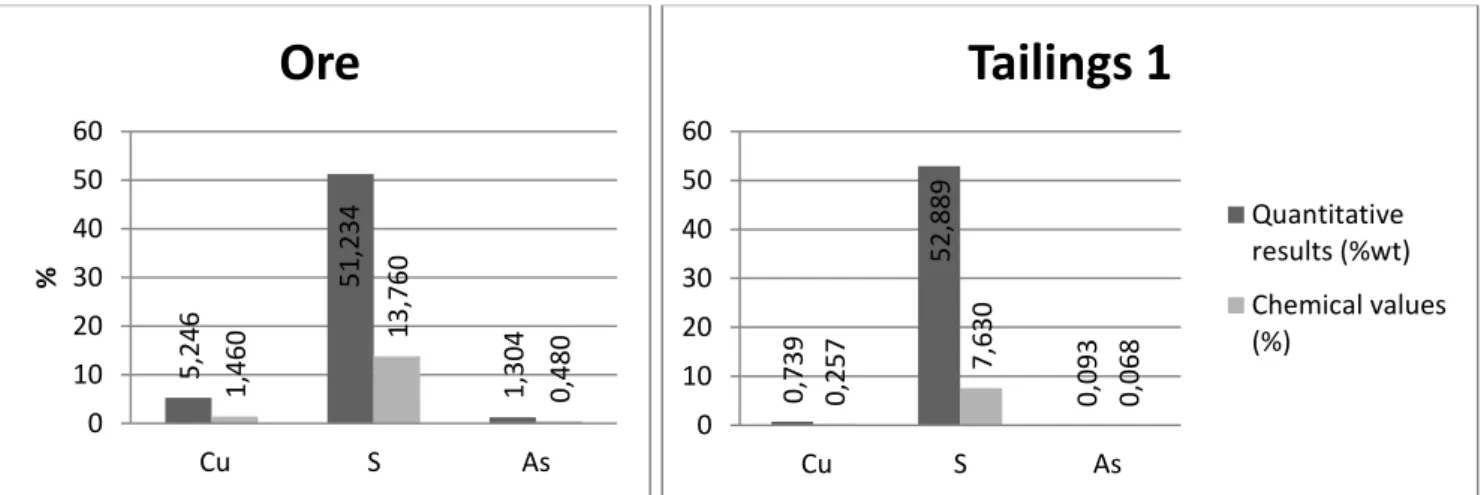
Quantitative results have been compared with chemical analyses “Table 1” and reveal very similar data. This table compares the recalculated total copper, As and S content obtained with spectral imaging to chemical analysis on split samples. The imaged-based values were obtained by adding each mineral average proportions multiplied by its Cu, S and As content (ex: 2% of chalcopyrite (at 34,5%Cu) equal to 0,69%Cu).
i.e %As = ∑ %mineral(i) * proportion of As in mineral i
Quantitative results Chemical values (%) Standardized with S (%wt) Quantitative results Chemical values Cu S As Cu S As Cu As Cu As Concentrate 14,102 46,279 5,195 16,990 43,260 5,910 0,305 0,112 0,393 0,137 Ore 5,246 51,234 1,304 1,460 13,760 0,480 0,102 0,025 0,106 0,035 Tailings1 0,739 52,889 0,093 0,257 7,630 0,068 0,014 0,002 0,034 0,009 Tailings2 0,378 53,067 0,023 0,481 27,570 0,068 0,007 0,000 0,017 0,002 Tot Tailings 0,921 53,073 0,114 0,261 10,980 0,051 0,017 0,002 0,024 0,005
Table1:quantitative values and chemical value of the studied samples
The fraction -38µm is the most represented but wasn’t quantitatively study. It has been considered of same composition than 38-75µm. “Figures 9 to 13” have been achieved with the second and third column of “Table 1”.
Figure 9 and 10: comparison between quantitative results and chemical values for ore and tailings1
5,246 51 ,234 1,304 1,460 13,760 0,480 0 10 20 30 40 50 60 Cu S As %
Ore
0,739 52,889 0,093 0,257 7,630 0,068 0 10 20 30 40 50 60 Cu S AsTailings 1
Quantitative results (%wt) Chemical values (%)Figure 11 and 12: comparison between quantitative results and chemical values for tailings 2 and Total tailings
Figure 13: comparison between quantitative results and chemical values for concentrate
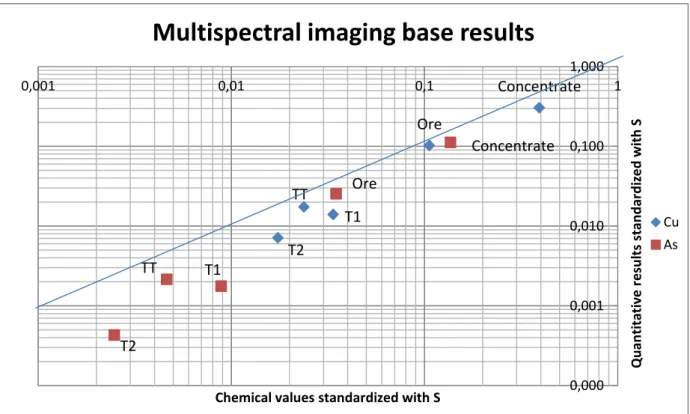
Concentrate results match with chemical analyses (“Figure 13”) but for the others samples (milled ore, tailings1, tailings2 and total tailings) (graphic 12, 13, 14 and 15) the results have to be re-scaled since the chemical analysis was made on entire sample while quantitative analyses only focused on sulphides. Thus, As and Cu percentages of both analyses have been normalized with S element, and results match in this case “Figure 14”.
14,102 46,279 5,195 16,990 43,260 5,910 0 10 20 30 40 50 Cu S As %
Concentrate
Quantitative results (%wt) Chemical values (%)Figure 14: multispectral imaging base results
“Figure 14” represents the position of the different samples in function of chemical and quantitative results, and the blue line represents the perfect corresponding between the two parameters. All the points are localized under the line attesting that quantitative results are slightly lower than chemical values. That gap between the points and the line can be attributed to many parameters such as wrong mineral identification or image processing parameters (erosion, dilatation…) but also because only the 38-75µm fraction is represented in figure 22.Concentrates and ores are closer to the line than tailings 1 (T1), tailings 2 (T2) and total tailings (TT) due to the highest quantity of sulphides analyzed. T1,T2 and T3 from Cu and As presents the same disposition on the graphic but As rate is lower than Cu rate. Globally, the points can be considered as very close to the line (logarithmic scale) confirming quantitative techniques efficiency used in this study.
Discussion
Quantify mineral proportions isn’t easy because results representativeness must be discussed at each stage of the process. Only a few grams of powdered rocks are use in a polished section, which represent a very low part of mining production. We have to realize that we only have access to a very small part of information and this information is perhaps wrong. Furthermore, only the fractions 38-75µm and +75µm have been quantitatively analyzed. Globally, quantitative results are similar to optical observations and chemical analyses, which is a positive observation.
Tailings (tailings 1, tailings 2 and total tailings) are mainly composed of pyrite (>90%) and Cu-bearing minerals are spared , which is coherent with optical observations.
Concentrate Ore T1 T2 TT Concentrate Ore T1 T2 TT 0,000 0,001 0,010 0,100 1,000 0,001 0,01 0,1 1 Quan ti tati ve resu lts stan d ar d ized wi th S
Chemical values standardized with S
Multispectral imaging base results
Cu As
“Figure 15”: comparison between ore, tailings and concentrate
Coffey Mining 2010 report asserts that 50% of extracted copper come from chalcopyrite, but our quantitative results achieved on July and August 2011 samples proved that main part of copper come from enargite (graphics 6 and 7 and annex 4). This difference is perhaps due to the mining ore variation between the two studies, or to a change of recovery in the process plant.
A bad chalcopyrite recovery seems to be detected because this mineral phase represent more than 75% of Cu-bearing minerals in tailings 1 38-75µm, tailings 2 +75µm and tailings 2 38-75µm (“Figure 7 and 8”). This could be explain by the low recovery of this mineral (55% according to Coffey Mining 2010) in flotation process. This phenomenon can’t be due to mineral associations because chalcopyrite, bornite, tennantite and enargite are very often associated together. So there is no reason that chalcopyrite is more present with pyrite than another associated mineral. “Figure 16,
17 and 18” compare 38-75µm and +75µm granulometry of a same sample. Globally,
38-75µm granulometry contains more pyrite and less Cu-bearing minerals than + 75µm granulometry. In milled ore samples, enargite is more present in 38-75µm samples, but this mineral is more present in concentrate as +75µm.
0 20 40 60 80 100 % wt o f su lfi d e s
Comparison between ore, total tailings and concentrate
Ore
Concentrate Total tailings
“Figure 16 and 17”: granulometric comparison between 38-75µm and +75µm fraction for ore and concentrate
“Figure 18”: granulometric comparison between 38-75µm and +75µm fraction for total tailings
Multispectral quantification technique used in this study shows that flotation process in Chelopech is rather good because tailings contain very low proportions of Cu minerals and high proportions of pyrite. On the other hand, concentrate contains nearly only half of Cu-bearing minerals and half of pyrite.
Galena is not recovered by Chelopech mining company but rich Selenium galena has been tracked from milled ore to tailings and concentrate. Its behavior in a non-adapted flotation plant is not so bad because galena has been slightly concentrated in the concentrate (“Figure 7 and 8”).
Conclusion
Multli-spectral imaging can provide automated quantitative mineralogical data useful for the optimization of the flotation recovery plant in Chelopech.
Milled ore, tailings (tailings 1, tailings 2, total tailings) and concentrate polished sections have been quantitatively analyzed in order to know which mineral phases are
0 20 40 60 80 100 Ore 0 20 40 60 80 100 Concentrate "+75µm" "38-75µm" 0 20 40 60 80 100
Total tailings August
"+75µm" "38-75µm"
LITERATURE
[1] Bonev IK., Kerestedjian T., Anatassova R., Andrew CJ.: Morphogenesis and composition of native gold in the Chelopech volcanic –hosted Au-Cu epithermal deposit, Srednogorie zone, Bulgaria. Miner. Deposit., v37, pp614-629, 2002.
[2] Moritz R., Kouzmanov K., Petrunov R.: Late Creataceous Cu-Au epithermal deposit of the Panagyurishte district, Srednogorie zone, Bulgaria. Scheizerische
Mineralogische und Petrographische Mitteilungen, v84, pp79-99, 2004.
[3] Chambefort I.: The Cu-Au Chelopech deposit Panagyurishte district, Bulgaria: Volcanic setting, hydrothermal evolution and tectonic overprint of a late Cretaceous high-sulfidation epithermal deposit. Ph.D. thesis, University of Geneva, Terre et Environnement, v52, 173p, 2005.
[4] Coffey Mining: Mine/ Mill expansion project, Bulgaria. Prepared by Coffey Mining Ptd Ltd on behalf of Dundee Pecious (Chelopech) BV. 705p, 2010.
[5] European Commission: Critical raw materials for EU. Report of the Ad-hoc Working Group on defining critical raw materials, 84p, 2010.
[6] Petrunov R.: Ore mineral paragenesis and zoning in the deposit of Chelopech. Geochim. Mineral Petrol, v30, pp89-98, 1995.
[7] Corbett G., Leach T.: Short Course manual: Souhwest Pacific Rim gold copper systems: structure, alteration and mineralization, 318p, 1997. [8] Terziyev G.I., The conditions of germanium accumulation in hydrothermal mineralizations (as illustrated by Bulgarian deposits). Geochemistry International, v 3, pp 341–346, 1966.